Non-Targeted Screening of Biosolids with the Xevo™ MRT Mass Spectrometer Reveals New Isoforms of PFAS
Hania Khoury-Hollins, Stuart Adams, Jeff Goshawk, Jayne Kirk, Richard Lock
Waters Corporation, United States
Published on March 25, 2026
Abstract
Per- and polyfluoroalkyl substances (PFAS) are persistent contaminants of growing regulatory concern, present in complex environmental matrices. In this study, high resolution mass spectrometry (HRMS) with non-targeted screening (NTS) workflows was employed to characterize PFAS profiles in biosolids reference material, leachate, and river water. Samples were prepared using solid-phase extraction (SPE) following the US EPA 1633 protocol and analyzed by LC-HRMS using the Xevo MRT Mass Spectrometer with data-independent acquisition (MSE) in negative ionization mode. Data were analyzed using the UNIFITM screening and quantitative Workflow, followed by a NTS workflow with the Pattern Analysis Application in waters_connectTM Software Platform. The targeted workflow integrated accurate mass measurements (RMS ≤ 0.59 ppm) and fragment ion data to enable confident identification and quantification of a list of PFAS compounds. Across the three studied matrices, 40 PFAS were quantified. The NTS workflow, using the Pattern Analysis Application, determined eleven untargeted PFAS-like compounds from 10,000 unidentified candidate components detected in biosolids, three of the eleven unknowns were putatively identified as an isoform to perfluorodecane sulfonic acid (PFDS).
This app note demonstrates the capability of HRMS-based NTS to provide comprehensive PFAS characterization and highlights the critical role of advanced software tools in navigating the immense data complexity and pinpointing PFAS-like compounds.
Benefits
- Exceptional mass measurement accuracy: Xevo MRT Mass Spectrometer achieves RMS mass accuracy consistently ≤ 0.59 ppm, effectively reducing the number of candidate compounds for identification.
- Broad PFAS profiling: Identification and quantification of 40 PFAS compounds, including linear and branched isomers, with high confidence using HRMS and data-independent acquisition (MSE).
- Integrated non-target screening and quantification platform: The waters_connect Software Platform, including the UNIFI Application and Pattern Analysis Application, supports non-targeted screening and absolute quantification within a unified platform, enhancing productivity and data traceability.
- Capability of HRMS-based NTS to deliver comprehensive PFAS characterization and exploratory screening in environmental monitoring programs.
Introduction
PFAS are persistent environmental contaminants found in complex matrices such as biosolids, landfill leachate, and surface waters, and are of growing regulatory concern. To evaluate the risk caused by these compounds, there is a growing need for total PFAS content analysis. Targeted approaches, while highly specific, are limited to a predefined list of well‑characterized compounds and therefore cannot fully represent total PFAS content. NTS approaches, using HRMS, offer a broader screening capability, enabling the detection of both known and unknown PFAS. This approach provides comprehensive identification and accurate quantification of known PFAS and facilitates the discovery of previously unrecognized compounds. However, NTS approaches generate large amounts of data from complex matrices, which can be challenging to interpret. Consequently, advanced software tools are essential to simplify data complexity and differentiate PFAS from non-PFAS-like compounds. Different open-source software tools such as FluoroMatch,1 FindPFΔS,2 mzMine3, and others4 have been developed to help facilitate the data interpretation. A total workflow solution for data interpretation eliminates workflow gaps that often arise when relying on multiple open-source tools.
In this study, HRMS with NTS workflows was employed to characterize PFAS profiles in biosolids, leachate, and river water. Samples were prepared following the US EPA 1633 protocol and analyzed with LC-HRMS using the Xevo MRT Mass Spectrometer with data-independent acquisition (MSE). The workflow integrated accurate mass measurements (<0.59 ppm), and fragment ion data to enable confident identification of both known and suspect PFAS compounds. Across matrices, 40 PFAS were identified and quantified. These data were then mined for additional PFAS-like compounds. A novel PFAS isoform—previously overlooked using targeted methods—was tentatively identified in biosolids, building on findings from earlier work.5
This app note demonstrates the performance of the Xevo MRT Mass Spectrometer for non-target screening and quantification of PFAS and PFAS-like compounds in river, leachate, and biosolid reference material showing the sensitivity, mass accuracy, and suitability of the instrument for both quantitative and NTS workflows.
The results highlight the value of a sensitive HRMS platform like the Xevo MRT Mass Spectrometer in delivering both NTS and quantitative analysis, complementing targeted methods to provide a more holistic understanding of PFAS content.
Experimental
Sample Preparation
Samples included river water, biosolid, and landfill leachate. The river water was collected in Scotland, UK from the River Tay. The biosolid (domestic sludge National Institute of Standards and Technology (NIST) 2781) and landfill leachate (LGC 6177) samples were purchased as reference materials with the landfill leachate containing no certified PFAS values. Extraction and SPE clean-up were carried out as outlined in previously published work6,7 with 250 mL river water, 0.5 g biosolid or 25 mL landfill leachate taken as the relevant sample sizes. An initial screen of the river water samples revealed no PFAS contamination,5 so they were spiked with native and internal standards contributing to the 40 PFAS in EPA Method 1633. The biosolid and landfill leachate both had PFAS present and were only spiked with internal standards. For the biosolid, two replicates were extracted, combined and then diluted 1 in 10 with methanol before analysis.5 For both the landfill leachate and spiked river water samples, five replicates of each were extracted and combined before analysis.
LC Conditions
|
LC system: |
ACQUITY™ Premier LC System modified with PFAS Kit (p/n: 205000588, 205000589) |
|
Column(s): |
Analytical column: ACQUITY Premier BEH™ C18 Column, 1.7 µm, 2.1 x 100 mm, 90 Å (p/n: 186009453) Isolator column: Atlantis™ Premier BEH C18 AX Column, 2.1 x 50 mm, 5 µm (p/n: 1860094507) |
|
Vials: |
Polypropylene Autosampler Vials (p/n: 186005219) with pre-slit caps (p/n: 186000305) |
|
Column temperature: |
35 °C |
|
Sample temperature: |
20 °C |
|
Injection volume: |
2 µL |
|
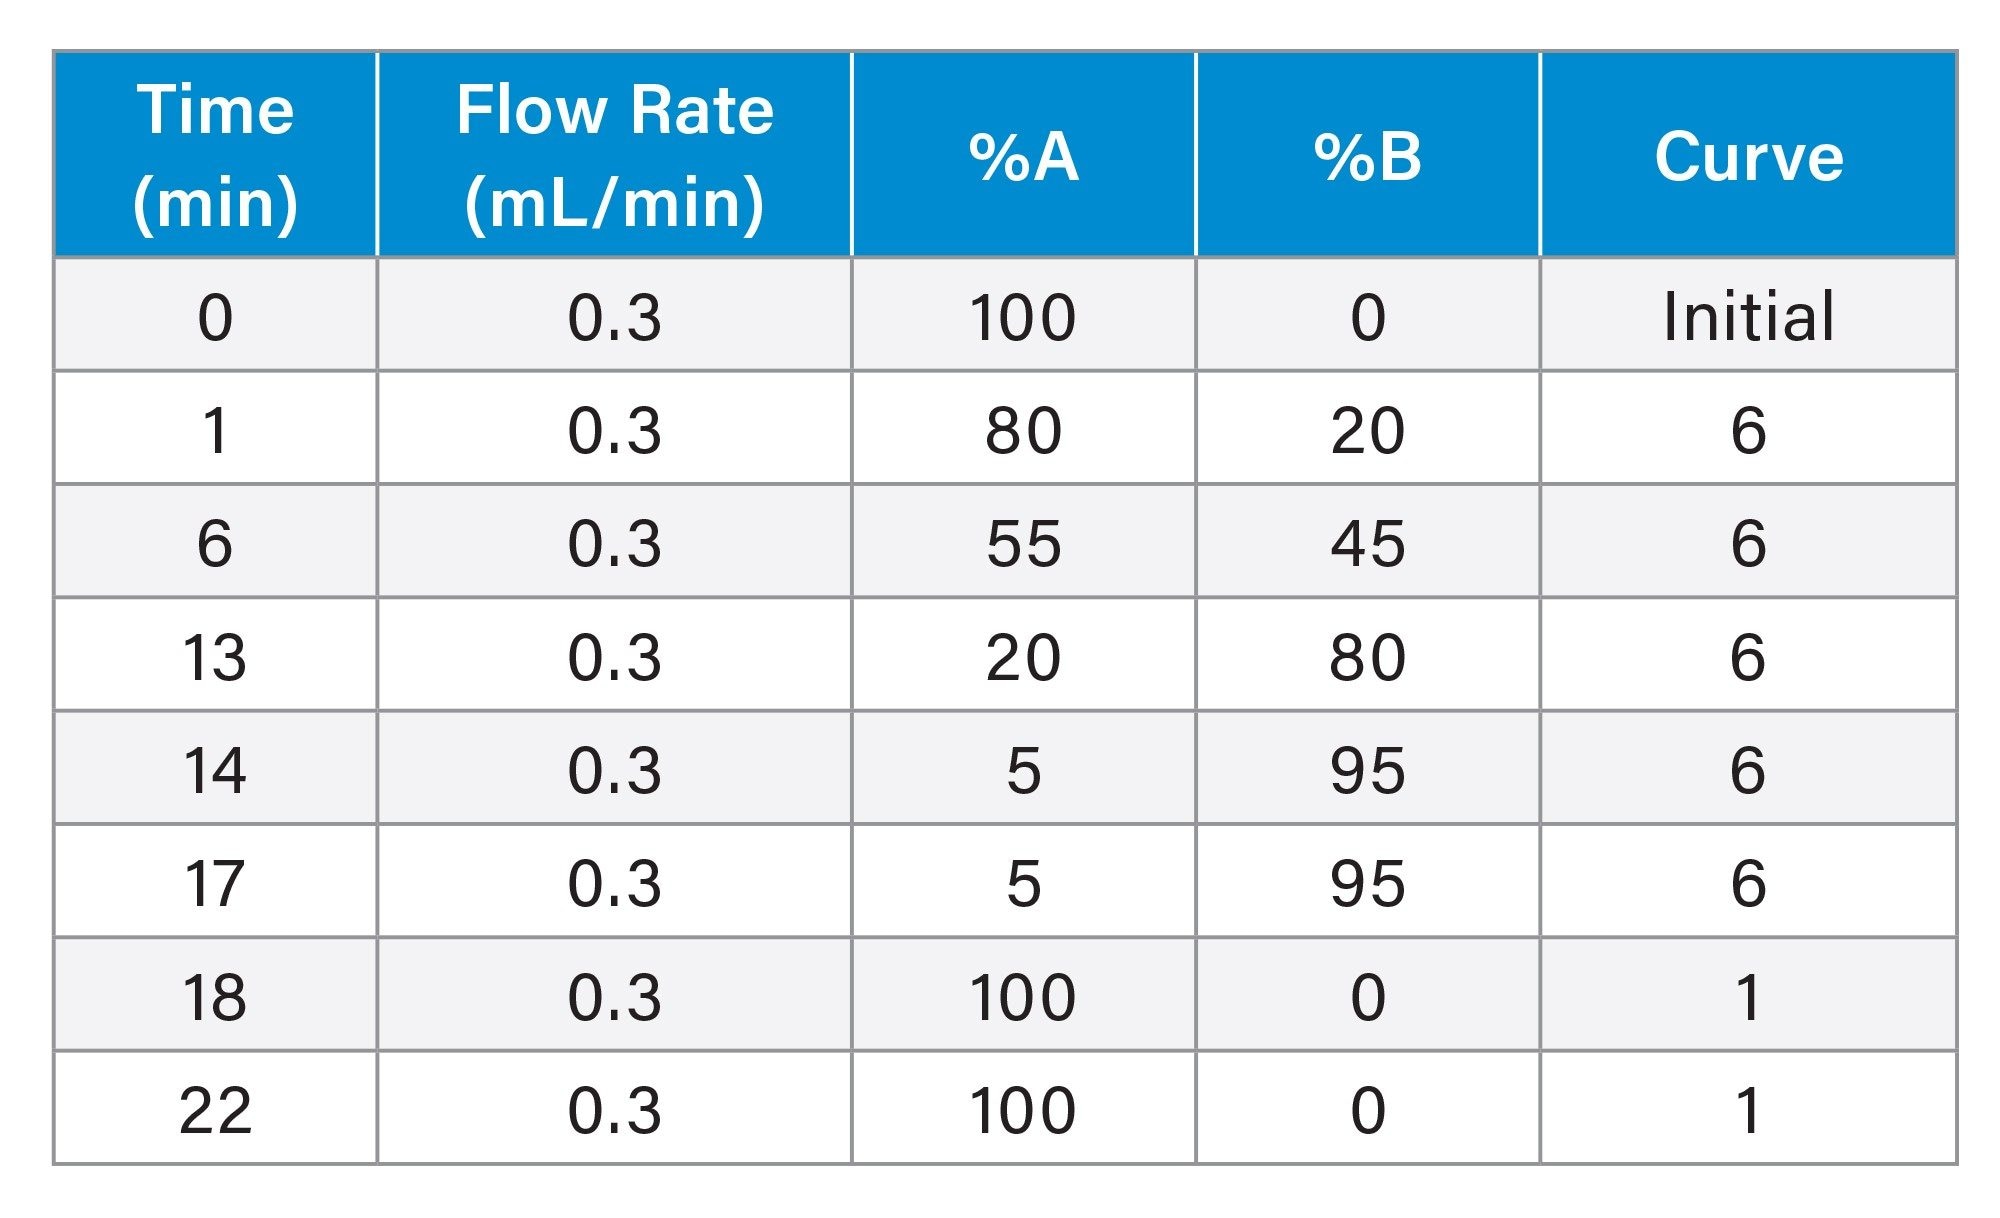
Flow rate: |
0.3 mL/min |
|
Mobile phase A: |
95:5 water:methanol with 2 mM ammonium acetate |
|
Mobile phase B: |
Methanol with 2 mM ammonium acetate |
LC Gradient Table
MS Conditions
|
MS system: |
Xevo MRT Mass Spectrometer System |
|
Ionization mode: |
ESI- |
|
Mass range: |
m/z 50–1200 |
|
Acquisition mode: |
MSE a data independent acquisition method |
|
Acquisition rate: |
10 Hz |
|
Lock mass: |
Dual point lock mass using Leucine enkephalin (m/z 554.26202 and 130.08735) |
|
Source conditions: |
Capillary voltage: 0.5 kV Cone voltage: 10 V Source temperature: 100 °C Desolvation temperature: 250 °C Cone gas: 100 L/h Desolvation gas: 600 L/h |
|
Source offset: |
30 V |
|
Collision energy: |
Low collision energy: 6 V High collision energy: ramp 20–70 V |
|
Transmission tune settings: |
StepWave™ Ion Guide RF: 100 V Body gradient: 5 V |
Software Tools
Data acquisition and processing were performed using the waters_connect Software Platform with UNIFI Application and Pattern Analysis Application, supporting both targeted quantification and NTS workflows.
Results and Discussion
Identification and Quantification of PFAS in Biosolids, River Water, and Leachate
River water, leachate, and biosolid samples were prepared following the U.S. EPA 1633 protocol as outlined by Organtini et al.6,7 and analyzed as described in the method section.8 Data processing was performed using the UNIFI Application and Pattern Analysis Application within the waters_connect Platform, applying both quantitative and NTS workflows. The quantitative workflow included 40 PFAS standards along with their labeled internal standards, a total of 69 compounds. Across 915 measurements in the calibration curve mixes, all PFAS compounds were identified with a root mean square (RMS) mass accuracy of ≤ 0.590 ppm.
PFAS compounds were identified and quantified in river water, leachate, and biosolids, and identification confidence levels were assigned in agreement with Schimanski et al9 and Charbonnet et al.10 Using the five-level confidence scale, the identified compounds had confidence levels from level 1 to 3, where level 1 denotes the highest confidence and level 5 the lowest. The absence of a unique fragment ion distinguishing the labeled internal standard from the corresponding unlabeled compound reduced the confidence levels of certain compounds to level 3.
All quantified PFAS compounds in the samples had concentrations within the studied range of standards. All spiked standards in river water were detected with a confidence level of either 1 or 2 and concentrations were in agreement with the previously reported values5 (Data not shown).
Figure 1 provides a summary of the identified and quantified PFAS in the leachate and biosolid samples. Log 2-transformed concentrations are shown as a color heat map, with the circle size reflecting the identification confidence. Empty cells indicate that the corresponding compound was not detected under the experimental conditions.
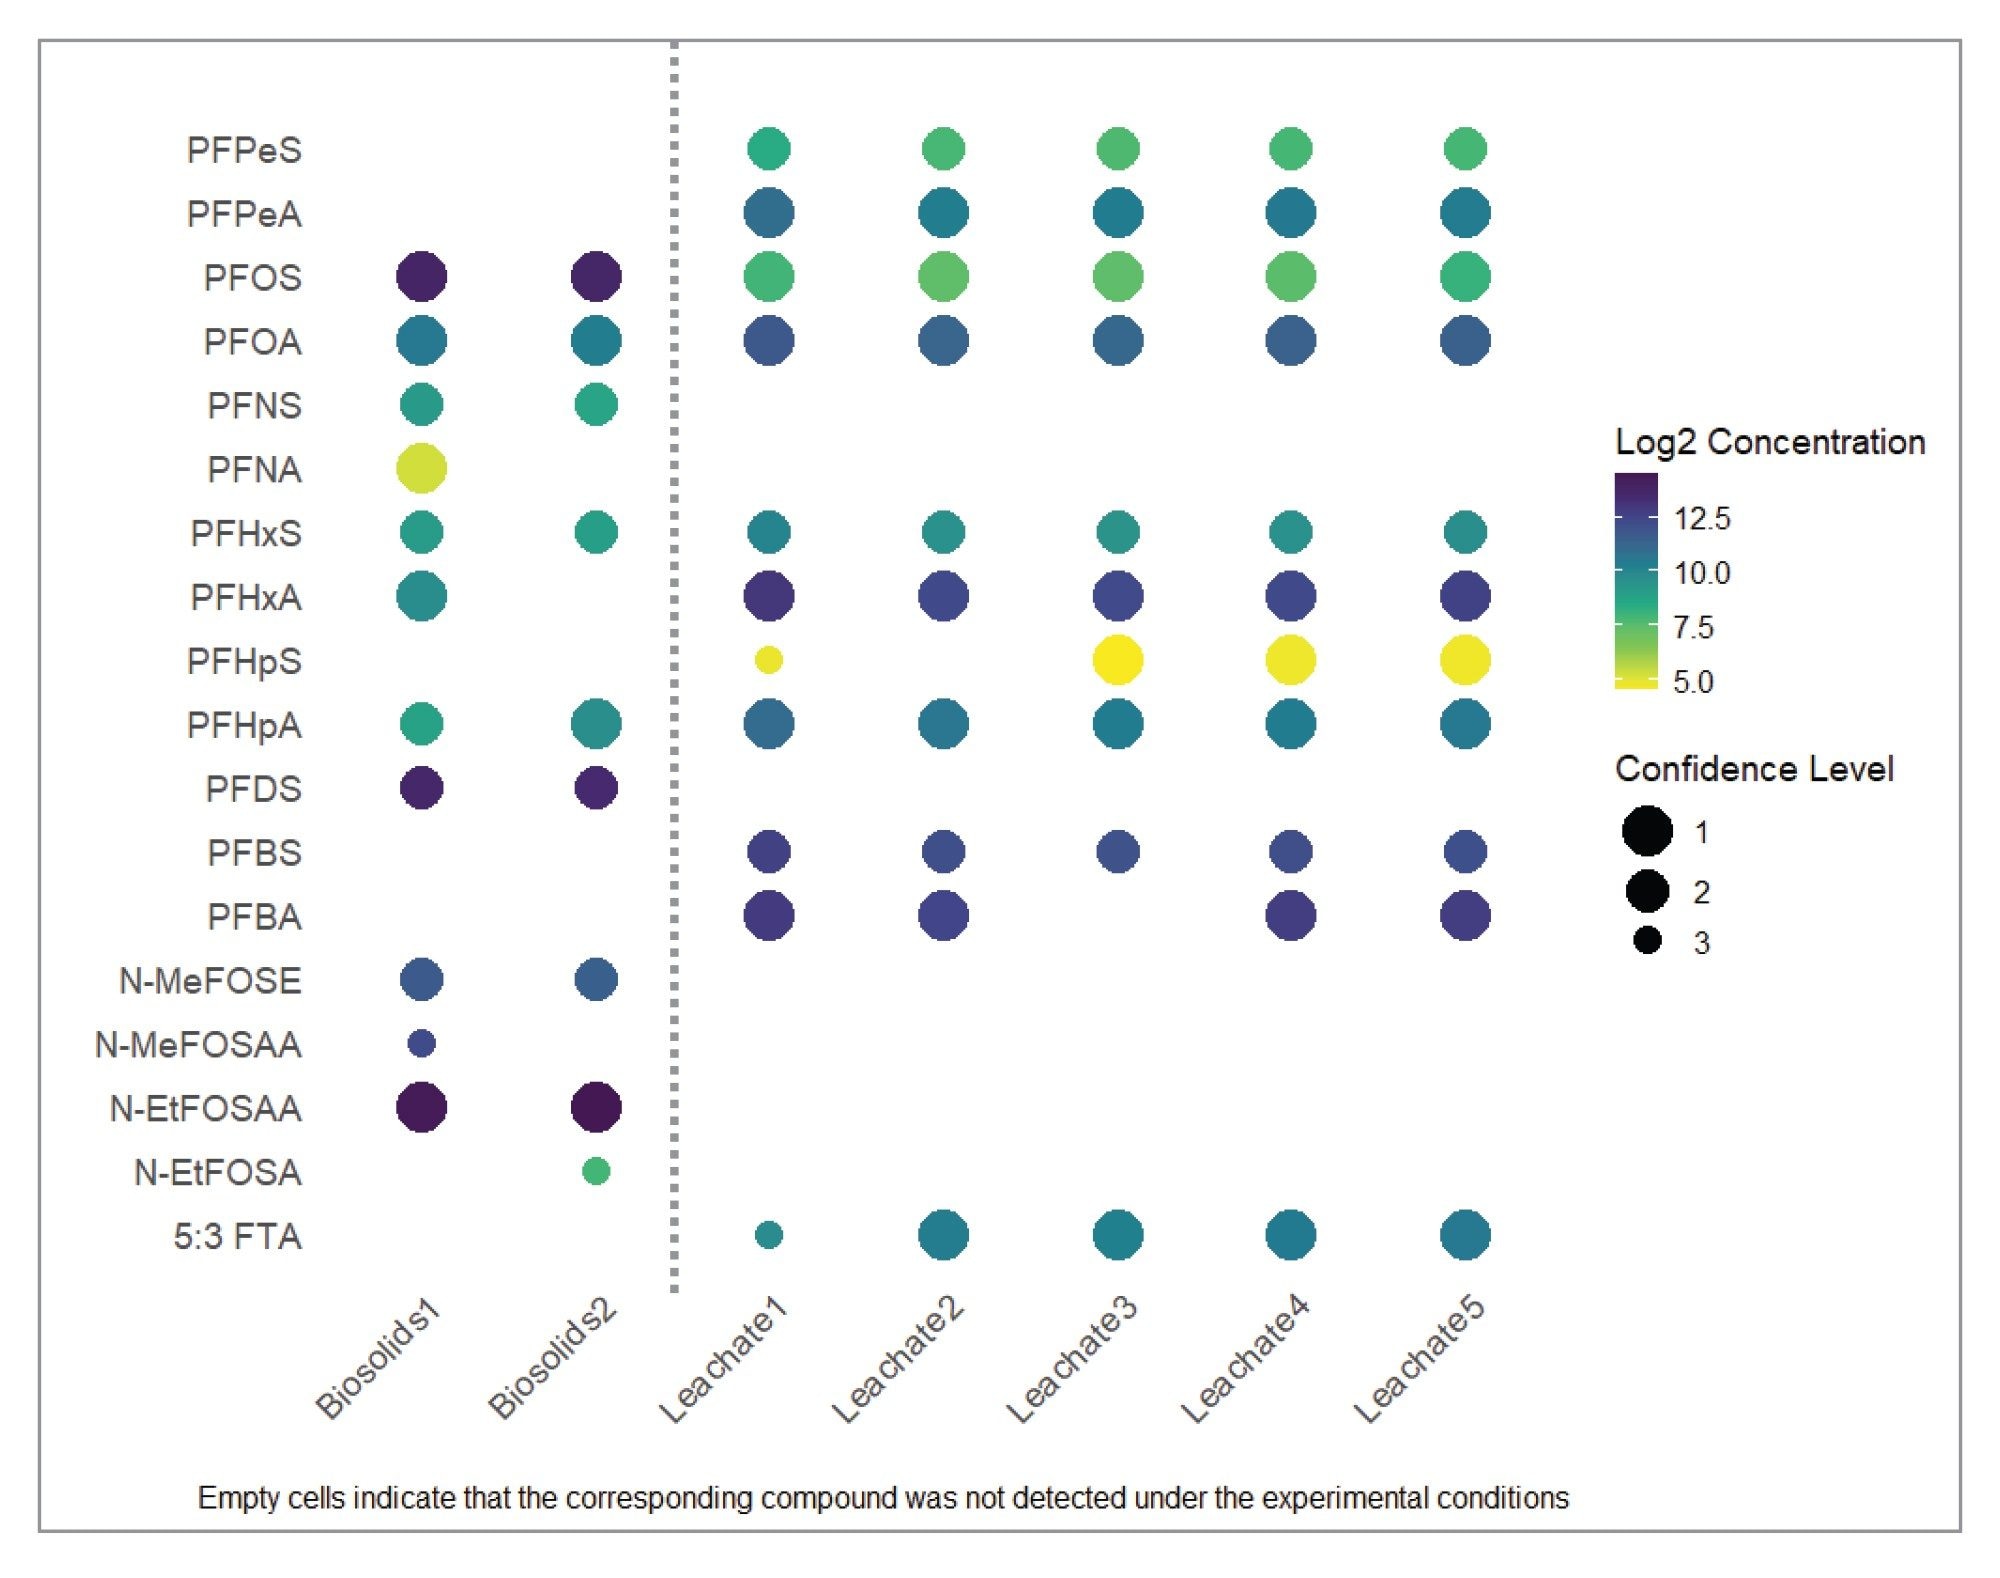
In the leachate samples, 11 compounds were identified and quantified with confidence levels ranging from level 2 and level 1 (Figure 1). For the biosolid reference material, 12 compounds were identified, of which four were detected in one of the duplicates samples prepared, with confidence levels ranging from level 3 to level 1 (Figure 1). As the samples were diluted 10 times before injection, some of the compounds were identified in only one of the duplicate preparations. These quantitative results are in line with those previously reported.5
Herein, the quantitative workflow described above and in previous work8 demonstrates that HRMS is fit for quantitation, achieving high confidence in PFAS identification and quantification across diverse environmental matrices.
NTS of PFAS Using Pattern Analysis Application in the waters_connect Platform
MSE acquisition mode enables further investigations for PFAS beyond quantification and suspect screening workflows. The Pattern Analysis Application within the waters_connect Platform was used for the NTS. It complements the screening and quantitative workflows with the UNIFI Application by leveraging processed data and incorporating additional calculations and visualization tools, enabling PFAS-like compounds to be distinguished from other compound classes.
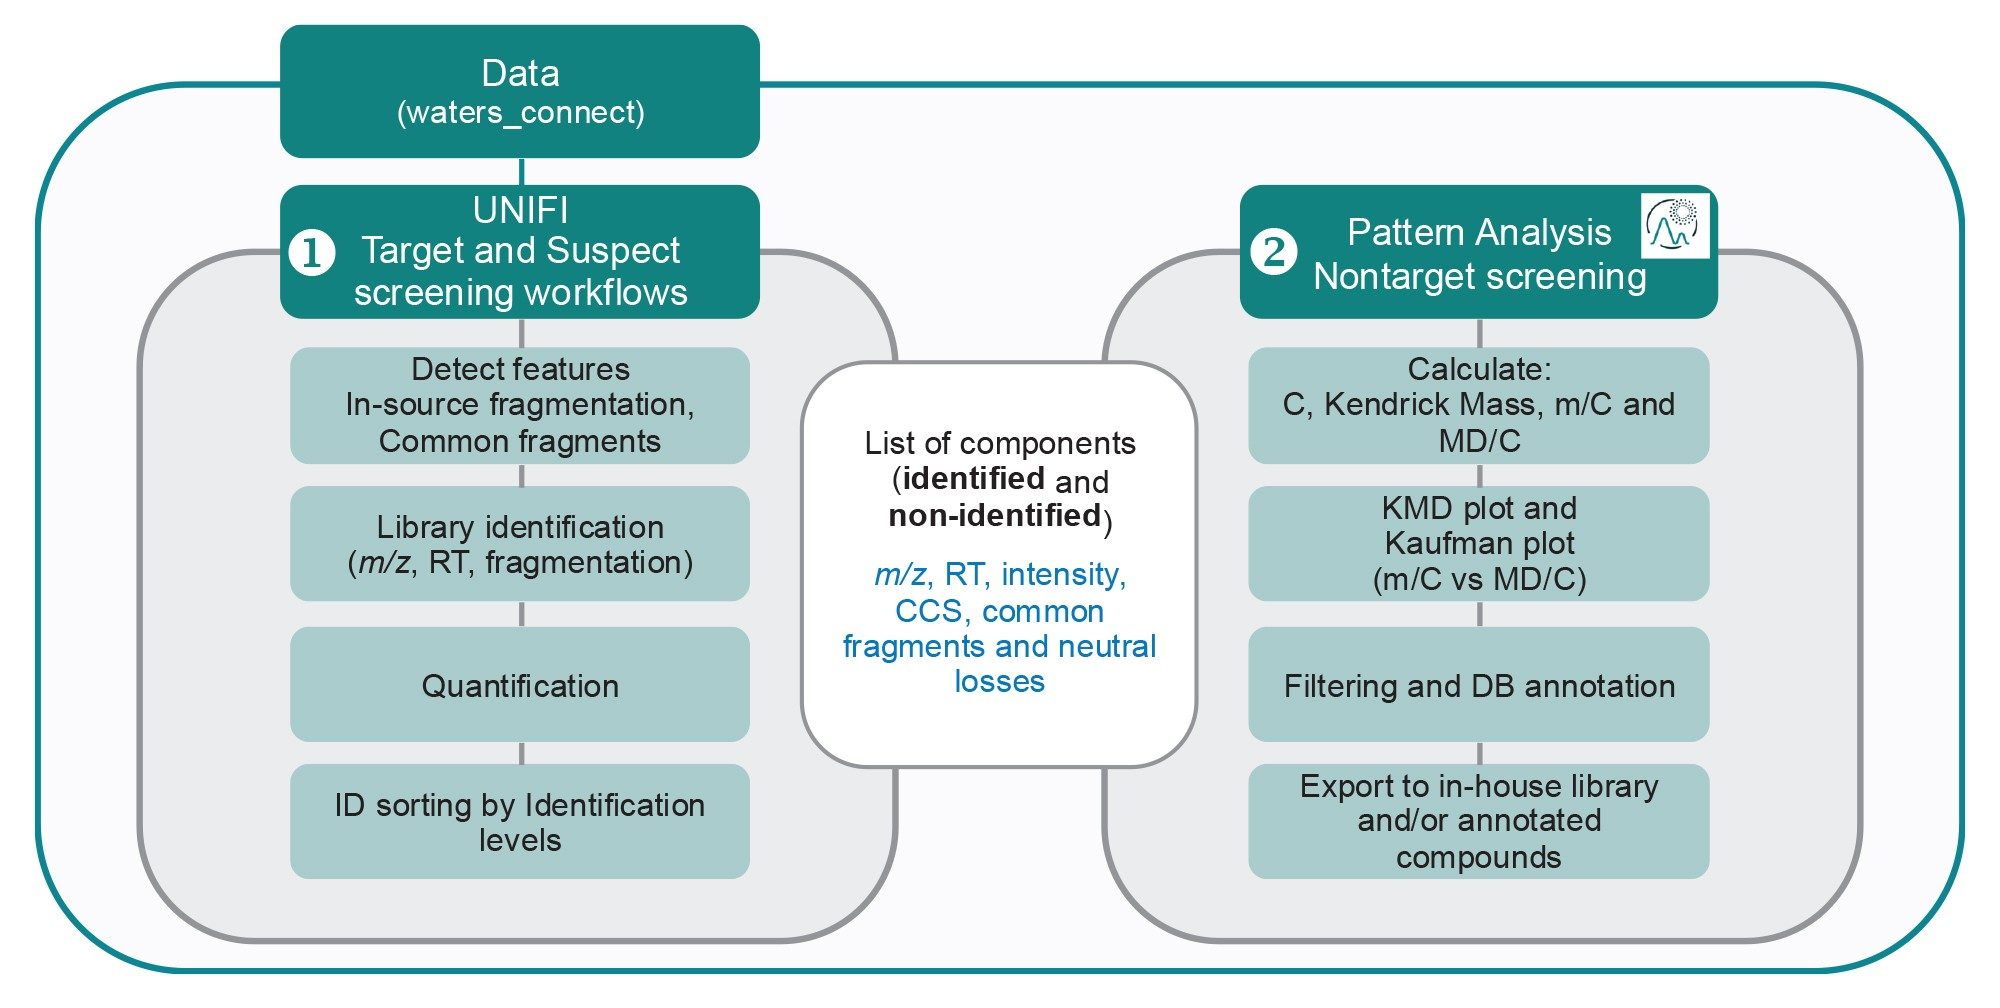
For PFAS NTS, the initial step uses the screening workflow11 in the UNIFI Application, which incorporates neutral losses (such as -CO2 for the carboxylates) and common fragments (e.g SO3-, FSO3- and CnF2n+1). When detected these diagnostic fragments provide additional information that help classify potential PFAS compounds.12 From the list of identified and non-identified components, the Pattern Analysis Application performs calculations such as Kendrick Mass (KM) and Kendrick Mass Defect (KMD), along with normalization of both mass and KMD to the number of carbon atoms. The results are visualized through various plots, including the Kendrick Mass Defect plot (normalised to CF2) and Bugsel/Kaufman plot.12,13 Compounds of interest can then be selected, annotated using open-source databases14, and exported. These steps are summarized in Figure 2.
By applying this approach on the biosolid samples and leachates, the selection and filtering options enabled clear differentiation of PFAS-like substances from other classes of compounds. Figure 3 illustrates the effect of these filtering steps on the biosolid data, where Figures 3A and 3B correspond to the Kendrick plot and the Bugsel/Kaufman plots showing about 10,000 detected components, and Figures 3A′ and 3B′ represent the corresponding plots showing only components passing the conditions for PFAS-like components. The blue circles in the figure correspond to the PFAS compounds identified in UNIFI Application in the biosolid sample. The selection criteria applied were as follows:
- Mass defect between 0.9 and 0.1 Da
- m/C ratio >30 where m corresponds to the m/z and C corresponds to the estimated number of carbon in a feature
- Common fragments and neutral losses are flagged
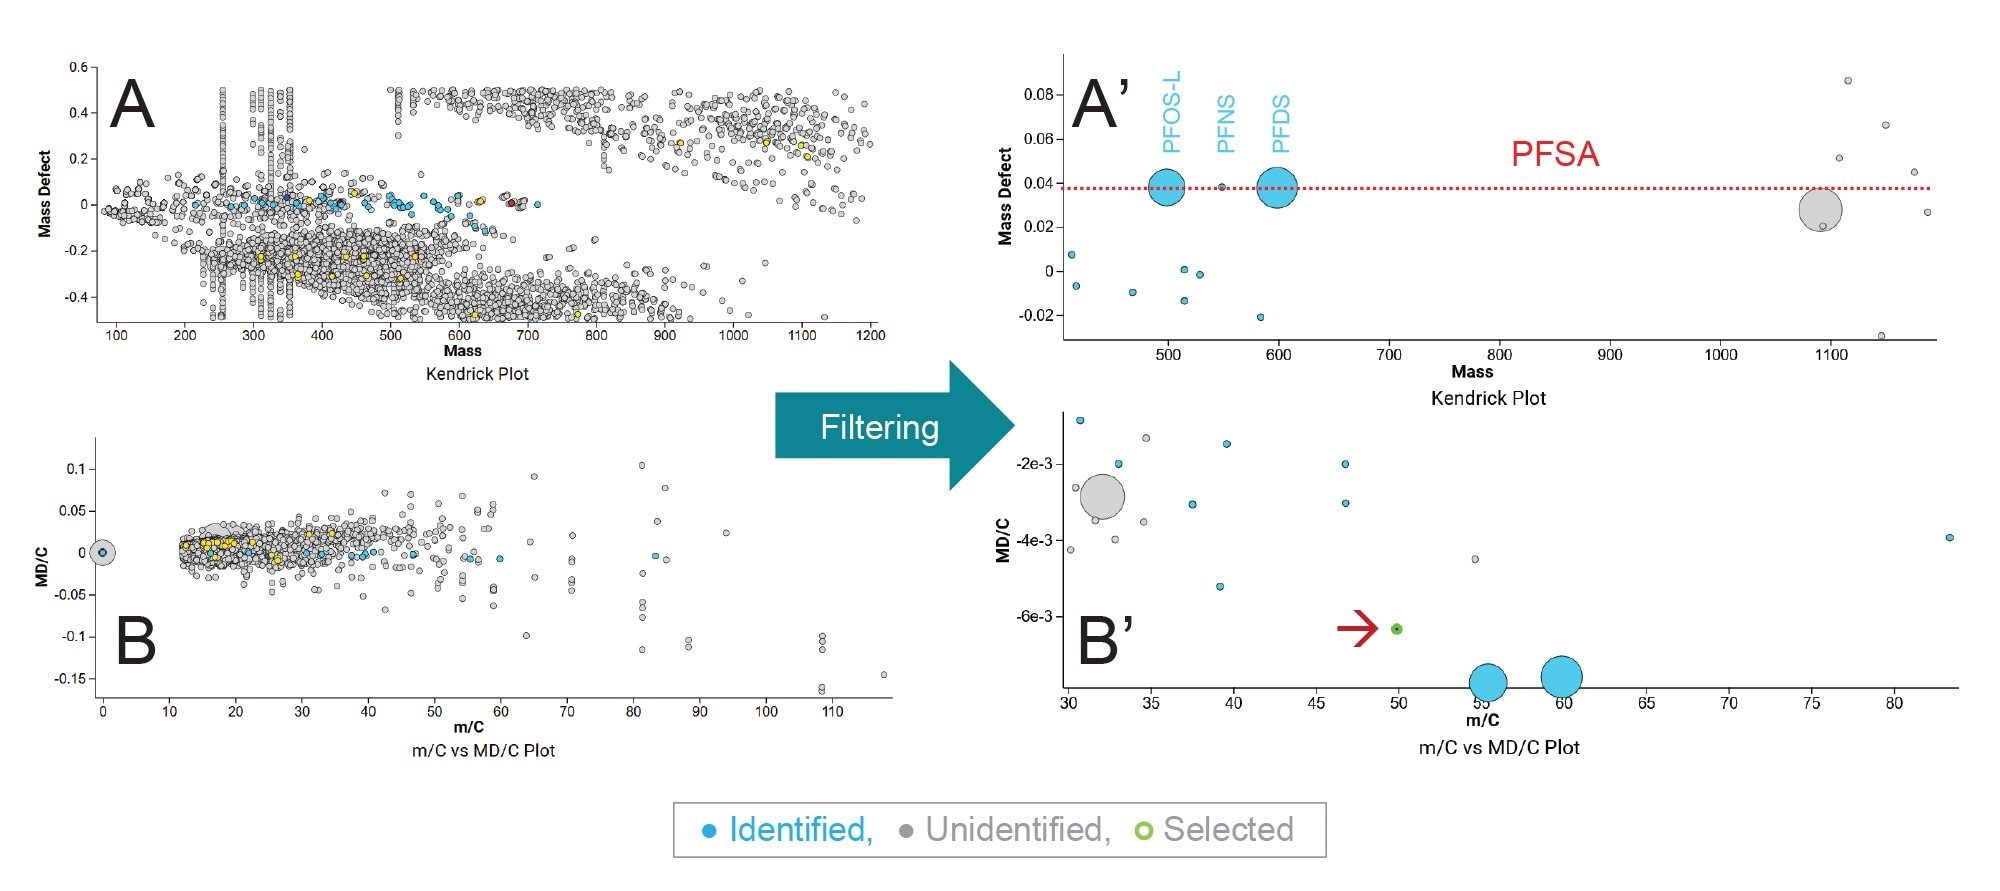
By removing most of the non-PFAS components, the Kendrick plot and the normalized version of KMD plot revealed 11 components that were not identified using the target screening approach (grey circles, Figure 3). Circle size reflects the component intensity, while the dashed line in Figure 3A’ highlights the shared mass defect (MD) of identified perfluorosulfonates in this sample (PFOS, PFNS, and PFDS). Noteworthy, there are 3 components sharing the same mass but different retention times (m/z vs retention time plot, data not shown), these are overlayed behind the largely abundant perfluorodecane sulfonic acid (PFDS).
Of these 11 components only three were tentatively identified using the NIST PFAS library v1.7.15 The NIST PFAS library includes 4,628 compounds, three components matched the molecular formula of C10HF21O3S corresponding to the linear form of PFDS with mass measurement accuracy 0, -0.11 and -0.6 ppm for components eluting at 13.88 minutes, 13.98 minutes and 14.08 minutes, respectively (Figure 4). Under the experimental conditions, and confirmed by using commercial standard, linear PFDS elutes at 14.17 minutes. Because the quantitative and screening workflow relied on mass and retention times (when standards were available), the other three isomers were not annotated.
All three components exhibit a mass defect similar to PFDS. However, only one component exhibits diagnostic sulfonate fragments. In fact, the high collision energy spectrum at 13.98 minutes contained two PFSA diagnostic fragments, m/z 79.95736 and m/z 98.95577 (SO3- and FSO3-, respectively), confirming that this component belongs to the PFSA class.16 The fragments were detected with mass measurement accuracies of 0.1 mDa and 0.0 mDa, respectively. However, this component elutes earlier than the previously identified PFDS (14.17 minutes, Figure 4 top) suggesting that it might be a branched form of PFDS. As for the components eluting at 13.88 minutes (peak 1, Figure 4 top) and 14.08 minutes (peak 3, Figure 4 insert), the lack of a diagnostic fragment implies a nonterminal sulfonate group in at least one component, suggesting a sulfonate ester rather than a PFSA structure. By comparing the abundances of all three isomers (peaks 1, 2 and 3, Figure 4), the components eluting at 13.88 minutes and 13.98 minutes have comparable abundances. However, only the component at 13.98 minutes possesses a sulfonate diagnostic fragment. This suggests that the sulfate group is not readily breakable as in PFSAs, and R-SO3-R’ ester-like structure is a possibility for peak 1 (Figure 4). The fact that diagnostic fragments were not detected for the component eluting at 14.08 minutes might be due to its very low abundance.
This data suggests that two out of the three isomers correspond to branched isoforms of PFDS eluting at 13.98 and 14.08 minutes (peaks 2 and 3, Figure 4) and a sulfonate ester-like component eluting at 13.88 minutes (peak 1, Figure 4). By expanding the search using PubChem, to this date, five compounds were listed with the same formula—one linear PFDS and four branched isomers, and one sulfonate ester like compound (Figure 4).
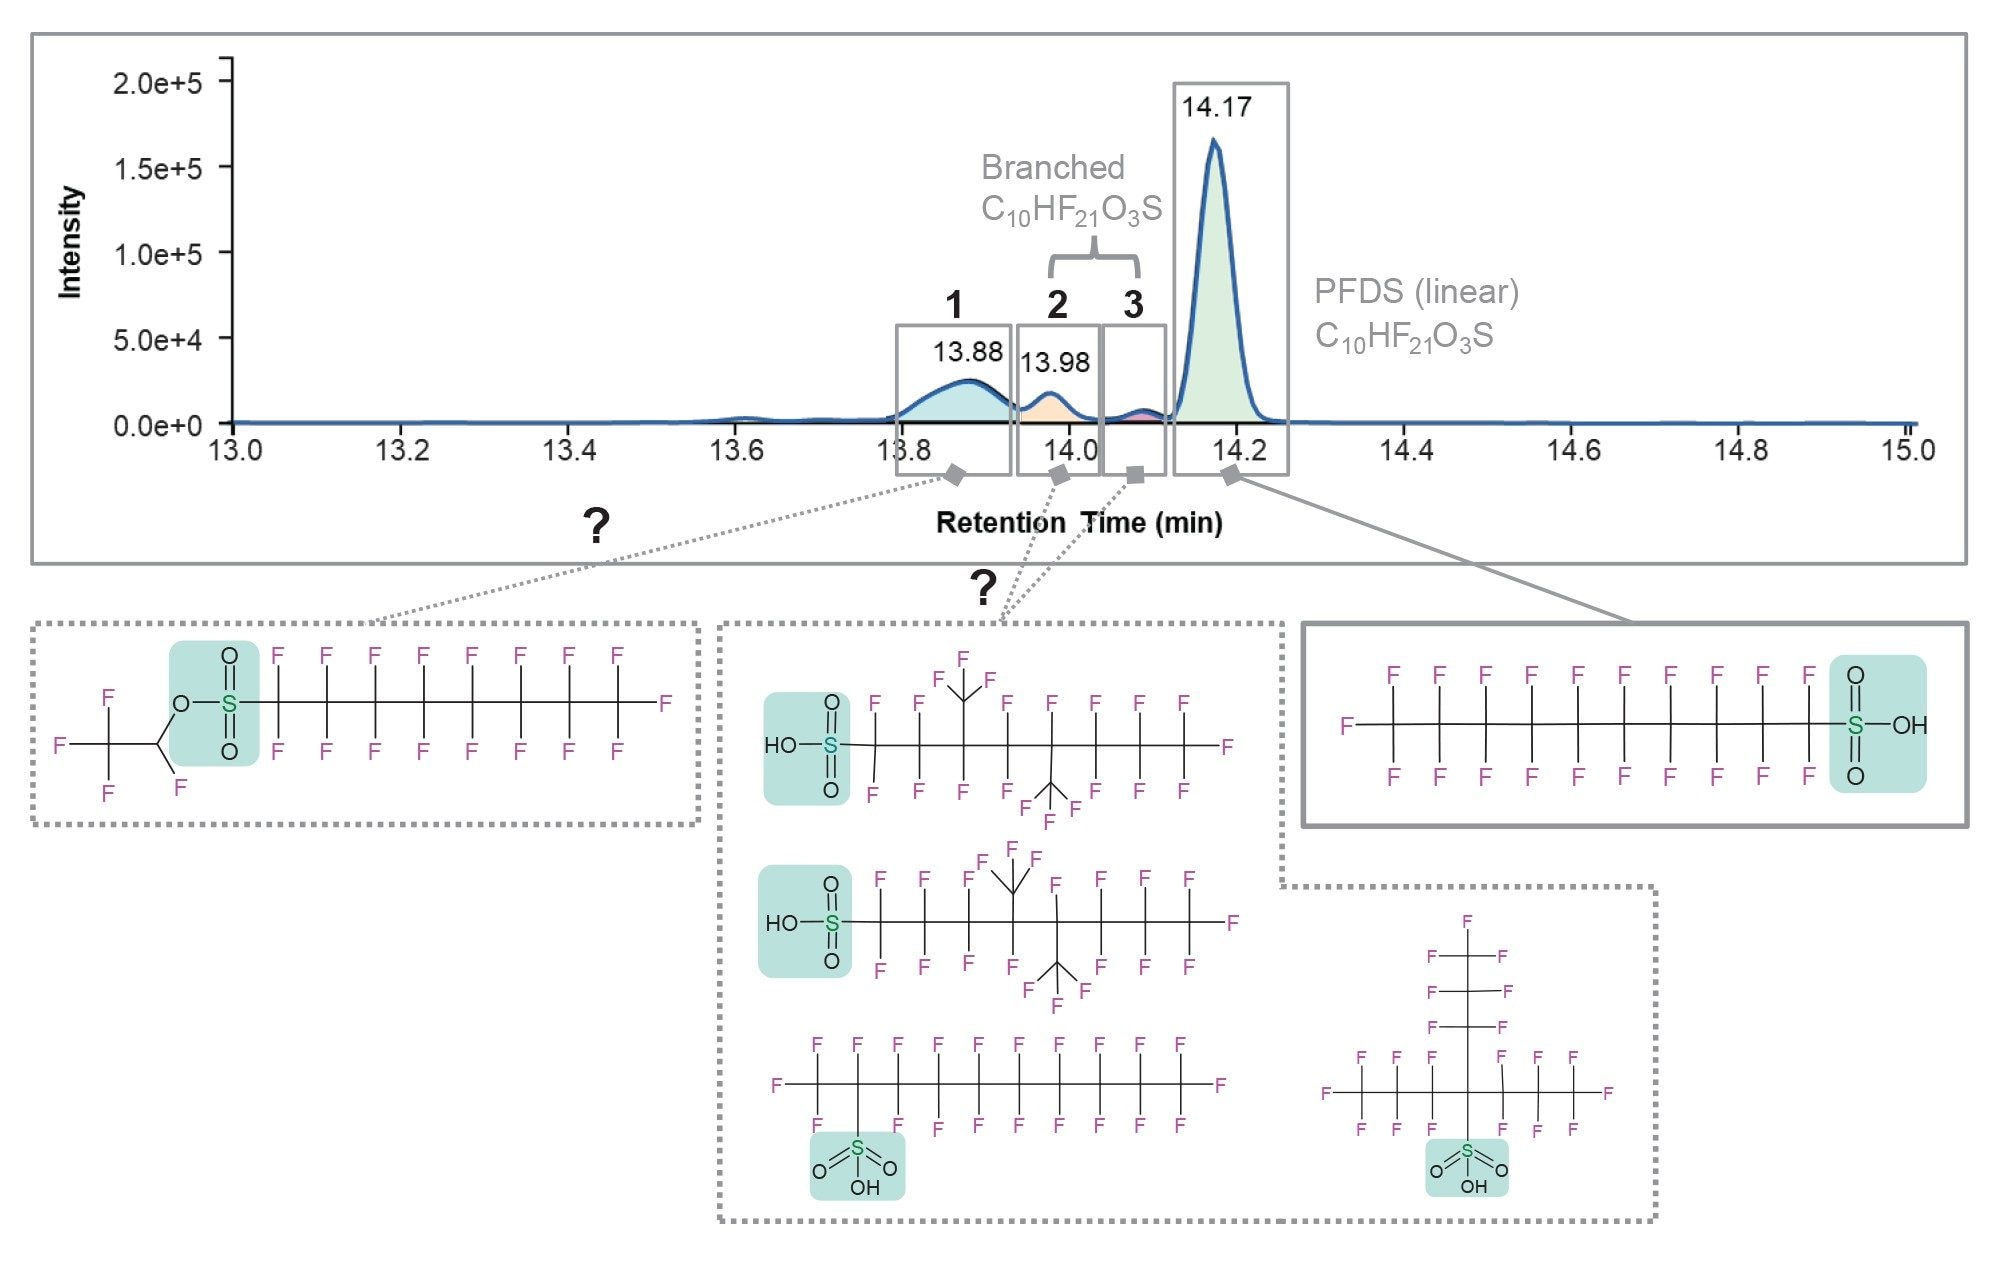
Figure 4 shows the extracted ion chromatogram of m/z 598.9238 along with proposed structures listed on PubChem for PFDS isoforms (the molecular formula C10HF21O3S was used as the search term17). To this date, the site proposes four branched isoforms of PFDS and one sulfonate ester like compound.
Based on all available evidence, the components eluting at 13.98 and 14.08 minutes, are most likely a branched PFDS isomer (confidence level 3a and 3d, respectively), whereas the component eluting at 13.88 minutes is very likely a sulfonate ester isomer (confidence level 3c). Further investigations are needed in order to confirm the identity of each of these components. Using data-dependent acquisition on all 11 PFAS-like compounds will increase the analytical information and help in the identification of the PFDS isomers and the remaining nine unidentified components. The MS/MS spectra will give an indication about the potential PFAS structure, location of branching and the functional group of these compounds.
Conclusion
This study demonstrates the robust analytical performance of the Xevo MRT Mass Spectrometer for the direct identification and quantification of PFAS in biosolids, leachate, and river water. The platform consistently delivered high mass accuracy (RMS < 0.590 ppm) and exceptional sensitivity, meeting the US EPA 1633 regulatory requirements.
Integration of the waters_connect Software Platform applications UNIFI and Pattern Analysis facilitated both targeted quantification and NTS within a unified software environment. Beyond the 40 compounds included in the EPA 1633 method, Pattern Analysis Application in the waters_connect Platform revealed 11 PFAS-like components, two of which were putatively identified as a branched form of PFDS (confidence level 3a and 3d, respectively) and one of the isomers as a sulfonate ester, confidence level 3c.
The Xevo MRT Mass Spectrometer , together with the waters_connect Software tools, deliver a solution addressing both targeted quantification and discovery-based workflows.
References
- Koelmel J. P., Paige M. K., Aristizabal-Henao J. J., Robey N. M., Nason S. L., Stelben P. J., Li Y., Kroeger N. M., Napolitano M. P., Savvaides T., Vasiliou V., Rostkowski P., Garrett T. J., Lin E., Deigl C., Jobst K., Townsend T. G., Godri Pollitt K. J., Bowden J. A. Toward Comprehensive Per- and Polyfluoroalkyl Substances Annotation Using FluoroMatch Software and Intelligent High-Resolution Tandem Mass Spectrometry Acquisition. Anal. Chem. 92: 11186–11194, 2020.
- Zweigle J., Bugsel B, Zwiener C. FindPFΔS: Non-Target Screening for PFAS─Comprehensive Data Mining for MS2 Fragment Mass Differences. Anal. Chem. 94: 10788–10796, 2022.
- Bowers B.B., Lou Z., Xu J., De Silva A.O., Xu X., Lowry, Sullivan R.C. Nontarget analysis and fluorine atom balances of transformation products from UV/sulfite degradation of perfluoroalkyl contaminants. Environ Sci Process Impacts. 25: 472–483, 2023.
- Megson D., Bruce-Vanderpuije P., Idowu I. G., Ekpe O. D., Sandau C. D. A systematic review for non-targeted analysis of per- and polyfluoroalkyl substances (PFAS). Science of The Total Environment. 960: 178240, 2025.
- Hancock P., Adams S., Gould D. Enhanced Reliability for Long-Term PFAS Analysis with the Xevo TQ Absolute XR Mass Spectrometer. Waters Application Note. 720008824. 2025.
- Organtini K., Rosnack K., Hancock P. Analysis of Per- and Polyfluoroalkyl Substances (PFAS) in Accordance With EPA 1633 Part 1: Establishing and Assessing the Method. Waters Application Note. 720008117. 2023.
- Organtini K., Rosnack K., Plummer C., Hancock P., Burt O. Analysis of Per- and Polyfluoroalkyl Substances (PFAS) in Accordance with EPA 1633 Part 2: Analysis of Aqueous Matrices. Waters Application Note. 720008143. 2023.
- Khoury-Hollins H., Stead S., Kirk J., Lock R. Analysis of Per- and Polyfluoroalkyl Substances in Groundwater by Direct Injection Using the Benchtop Multi-Reflecting Time-of-Flight Xevo™ MRT Mass Spectrometer. Waters Application Note. 720009149. 2025.
- Schymanski E. L., Singer H. P., Slobodnik J., Ipolyi I. M., Oswald P., Krauss M., Schulze T., Haglund P., Letzel T., Grosse S., Thomaidis N. S., Bletsou A., Zwiener C., Ibáñez M., Portolés T., de Boer R., Reid M. J., Onghena M., Kunkel U., Schulz W., Guillon A., Noyon N., Leroy G., Bados P., Bogialli S., Stipaničev D., Rostkowski P., Hollender J. Non-target Screening with High-Resolution Mass Spectrometry: Critical Review Using a Collaborative Trial on Water Analysis. Anal. Bioanal. Chem. 407:6237–6255, 2015.
- Charbonnet J. A., McDonough C. A., Xiao F., Schwichtenberg T., Cao D., Kaserzon S., Thomas K. V., Dewapriya P., Place B. J., Schymanski E. L., Field J. A., Helbling D. E., Higgins C. P. Communicating Confidence of Per- and Polyfluoroalkyl Substance Identification via High-Resolution Mass Spectrometry. Environ Sci Technol Lett. 9: 473–481, 2022.
- Khoury-Hollins H., Fox J., Riba I., Adams S. Nontarget Screening Workflow (NTS) for the Analysis of Per and Polyfluoroalkyl Substances (PFAS) in Animal Products Using Xevo™ G3 QTof. Waters Application Note. 720008360. 2024.
- Bugsel B., Zweigle J., Zwiener C. Nontarget screening strategies for PFAS prioritization and identification by high resolution mass spectrometry: A review. Trends in Environmental Analytical Chemistry. 40: e0016, 2023.
- Kaufmann A., Butcher P., Maden K., Walker S., Widmer M. Simplifying Nontargeted Analysis of PFAS in Complex Food Matrixes, Journal of AOAC INTERNATIONAL, 105: 1280–1287, 2022.
- U.S. Environmental Protection Agency. CompTox Chemicals Dashboard. https://comptox.epa.gov/dashboard/chemical-lists/pfasmaster accessed November 2023.
- Suspect List of Possible Per- and Polyfluoroalkyl Substances (PFAS). NIST Public data repository. https://data.nist.gov/od/id/mds2-2387 accessed November 2023.
- Wang Z., DeWitt J., Higgins C., Cousin I. A Never-Ending Story of Per- and Polyfluoroalkyl Substances (PFASs). Environ. Sci. Technol. 51: 2508–2518, 2017.
- NIH, National Centre for Biotechnology Information - PubChem PubChem Querry https://pubchem.ncbi.nlm.nih.gov/#query=C10HF21O3S.
720009276, March 2026