Application Brief
This is an Application Brief and does not contain a detailed Experimental section.
Mary Trudeau, Nikunj Tanna, Robert Plumb
Waters Corporation, United States
Published on April 27, 2026
This is an Application Brief and does not contain a detailed Experimental section.
GLP-1 receptor agonists (GLP-1 RAs) initially developed for the treatment of type II diabetes are also highly effective therapeutic agents for obesity. The long half-life and low dose levels (1–2 mg/week) of these drugs requires bioanalytical methods with sub ng/mL level sensitivity to accurately define the pharmacokinetics, which is normally performed by tandem quadrupole mass spectrometry – analytical scale LC (2.1 mm). Microflow (1.0 mm ID) columns offer the promise of increased sensitivity along with the reduction in solvent consumption. The 4 GLP-1 RAs semaglutide, tirzepatide, exenatide, and liraglutide were analyzed by reversed-phase UHPLC-MS/MS using both 2.1 and 1.0 mm ID chromatographic columns. The MaxPeak Premier Microflow Columns delivered a 2-fold increase in peak signal response with a 75% reduction in solvent consumption compared to the 2.1 mm column format. There was no reduction in chromatographic performance or increase in analytical run time associated with the 1.0 mm ID columns. Additionally, the microflow columns could be operated using a conventional ACQUITY™ Premier UPLC™ System.
Over 1.3 billion people are affected by obesity globally with subsequent knock-on impact to a wide range of chronic diseases, such as metabolic and cardiovascular disorders as well as cancer and muscular skeletal. GLP-1 RAs, initially introduced in the 2010s, function by mimicking gut hormones to suppress appetite and regulate energy metabolism. In addition to weight loss, these GLP-1 RAs have demonstrated cardiovascular benefits and have been approved for the treatment of metabolic dysfunction-associated steatohepatitis (MASH). As well as effective weight loss, tirzepatide (glucose-dependent insulinotropic polypeptide (GIP) and GLP-1 RA) has demonstrated clinical benefit in patients with obesity and heart failure or obstructive sleep apnea.1
These medicines are typically administered weekly via subcutaneous injection; the low dose levels 1–5 mg/week and long half-life (typically 160–180 h) of these medicines results in low systemic concentration 100–0.1 ng/mL.2 Therefore, a high sensitivity bioanalytical assay is required to accurately define the pharmacokinetics of these GLP-1 RAs. This is typically achieved via reversed-phase chromatography coupled with tandem quadrupole mass spectrometry operated in multiple reaction monitoring mode.3 The tendency of these peptides to interact with the transition metal surfaces in chromatography columns and the connecting tubing within chromatography system further complicates the quantification of these GLP-1s and GIP-GLP-1 RA compounds. Walter et-al4 showed that the use of an organo-hybrid surface in the chromatography system solvent tubing and column/frit surfaces mitigates unwanted analyte binding and adsorption (internal diameters of 2.1 and 4.6 mm), making these columns ideal for the low concentration analysis of GLP1-RA and GIP peptides.
Here, the use of 1 mm column with organo-hybrid surface combined with a conventional scale ACQUITY™ Premier UPLC Chromatography System and Xevo™ TQ Absolute XR Mass Spectrometer is described for the quantification of the GLP-1 RA peptides semaglutide, tirzepatide, exenatide, and liraglutide in human plasma extract.
A stock solution of semaglutide, tirzepatide, exenatide, and liraglutide was prepared in 75/25 solution of water:acetonitrile (ACN) 0.1% formic acid containing 0.1% rat plasma at 100 µg/mL. This solution was further diluted to create 10, 1, and 0.1 µg/mL working solutions. Calibration standards were prepared by spiking in the working solutions into extracted control rat plasma over the concentration range 0.2–1000 ng/mL (see Trudeau et a,l Waters application note EN 720008097 2023).
A 1 µL aliquot was loaded onto either a 2.1 x 50 1.8 µm ACQUITY Premier Peptide HSS T3 (p/n: 186010721) Chromatography Column or a 1 x 50 mm Waters BioResolve™ Peptide C18 RP Column, MaxPeak Premier Technology, 1.7 µm, 300 Å, BEH™ Chromatography Column (p/n: 186011513). The columns were maintained at 65 ˚C and eluted via a reversed-phase gradient of 20–80% B over 10 minutes where mobile phase A = 95%, water 5%, acetonitrile 0.1%, formic acid and mobile phase B = 95%, acetonitrile 5%, water 0.1% formic acid. The columns were then flushed with 100% B before returning to the initial conditions at 12.1 minutes. Flow rates of 400 and 100 µL/min were employed for the 2.1 x 50 mm & 1.0 x 50 mm columns, respectively.
The column effluent was monitored using a Waters Xevo™ TQ Absolute XR Mass Spectrometer operated in +ve ESI multiple reaction monitoring mode. The capillary and cone voltages were set to 3 kV and 32 V, respectively. The desolvation gas temperature was set to 500 ˚C; the desolvation, cone gas flows were 1000 and 150 L/h, respectively. The collision gas (argon) flow was 0.15 mL/min and the nebulizer pressure was 7 bar. The following MRM transitions were employed to monitor and quantify the GLP-1 RAs exenatide 838 à 396, liraglutide 938 → 1064, semaglutide 1029 → 1238, and tirzepatide 1204 → 396. The instrumentation was controlled using waters_connect™ Software version 4.2 and the quantification performed using waters_connect MS Quan Application 2.4.
Tandem quadrupole mass spectrometry coupled with liquid chromatography is the mainstay of quantitative bioanalysis, providing concentration data to support discovery, preclinical, and human clinical trial pharmacokinetic, safety and efficacy studies. The ability to accurately quantify pharmaceutical compounds and their metabolites at very low concentrations is essential to enable the accurate pharmacokinetic definition of compounds which are dosed at a low level, have low systemic bioavailability, exhibit a long elimination half-life, or when sample volumes are low. Nano and capillary-scale chromatography LC-MS/MS has been extensively employed in proteomics and single cell omics studies due to its exquisite high sensitivity.5 However, these systems require specialized chromatography system, dedicated nanospray MS sources, and experienced users. Microscale, 1 mm internal diameter (ID) columns offer an attractive alternative to capillary and nano-scale chromatography, providing significant reduction in solvent consumption and potential increase in sensitivity without the need for a dedicated nano-scale chromatography system and MS source.
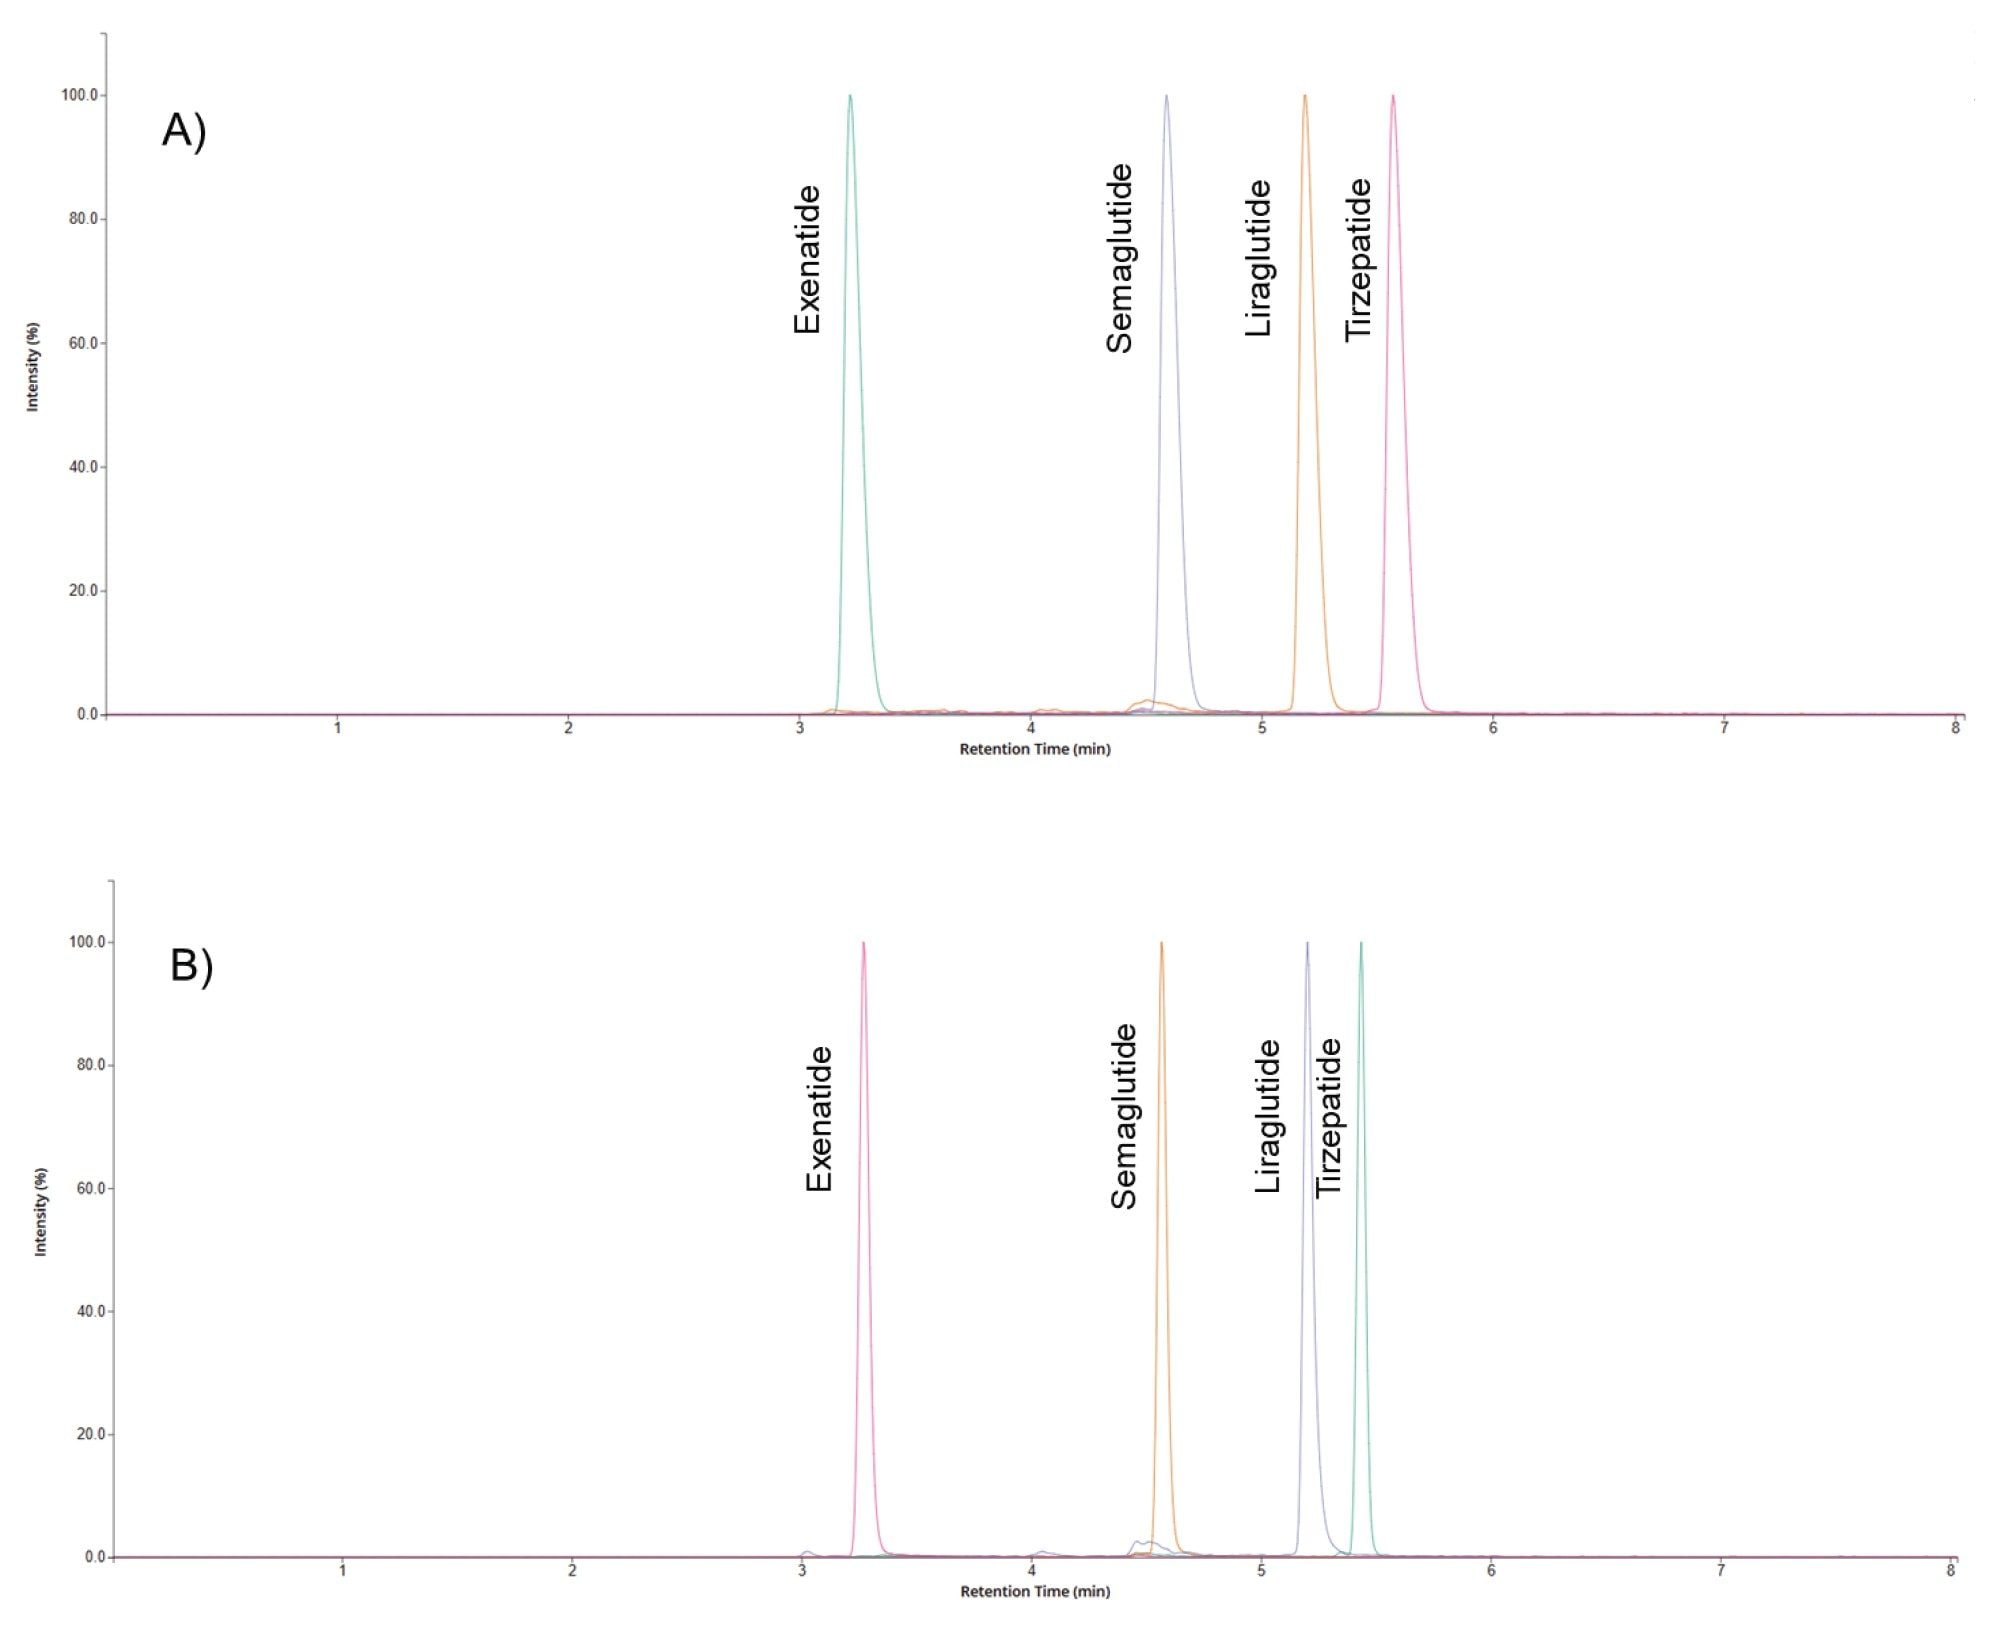
The chromatographic performance of the 1 mm ID column was compared to that obtained from a 2.1 mm ID column (both 50 mm length) for the separation of four GLP-1 RA peptides. The flow rate was geometrically scaled from the 2.1 mm flow rate of 400 µL/min to 100 µL/min; the same injection volume of 1 µL was employed for both column geometries. The data in Figures 1 A and B illustrates the data obtained for the analysis of the four GLP-1 RA peptides using the 2.1 mm and 1.0 mm ID columns, respectively. As can be seen from this data, there is no significant difference in the chromatography produced by the two systems and the retention times of the analytes is similar between the two systems and the resolution between the analyte peaks conserved.
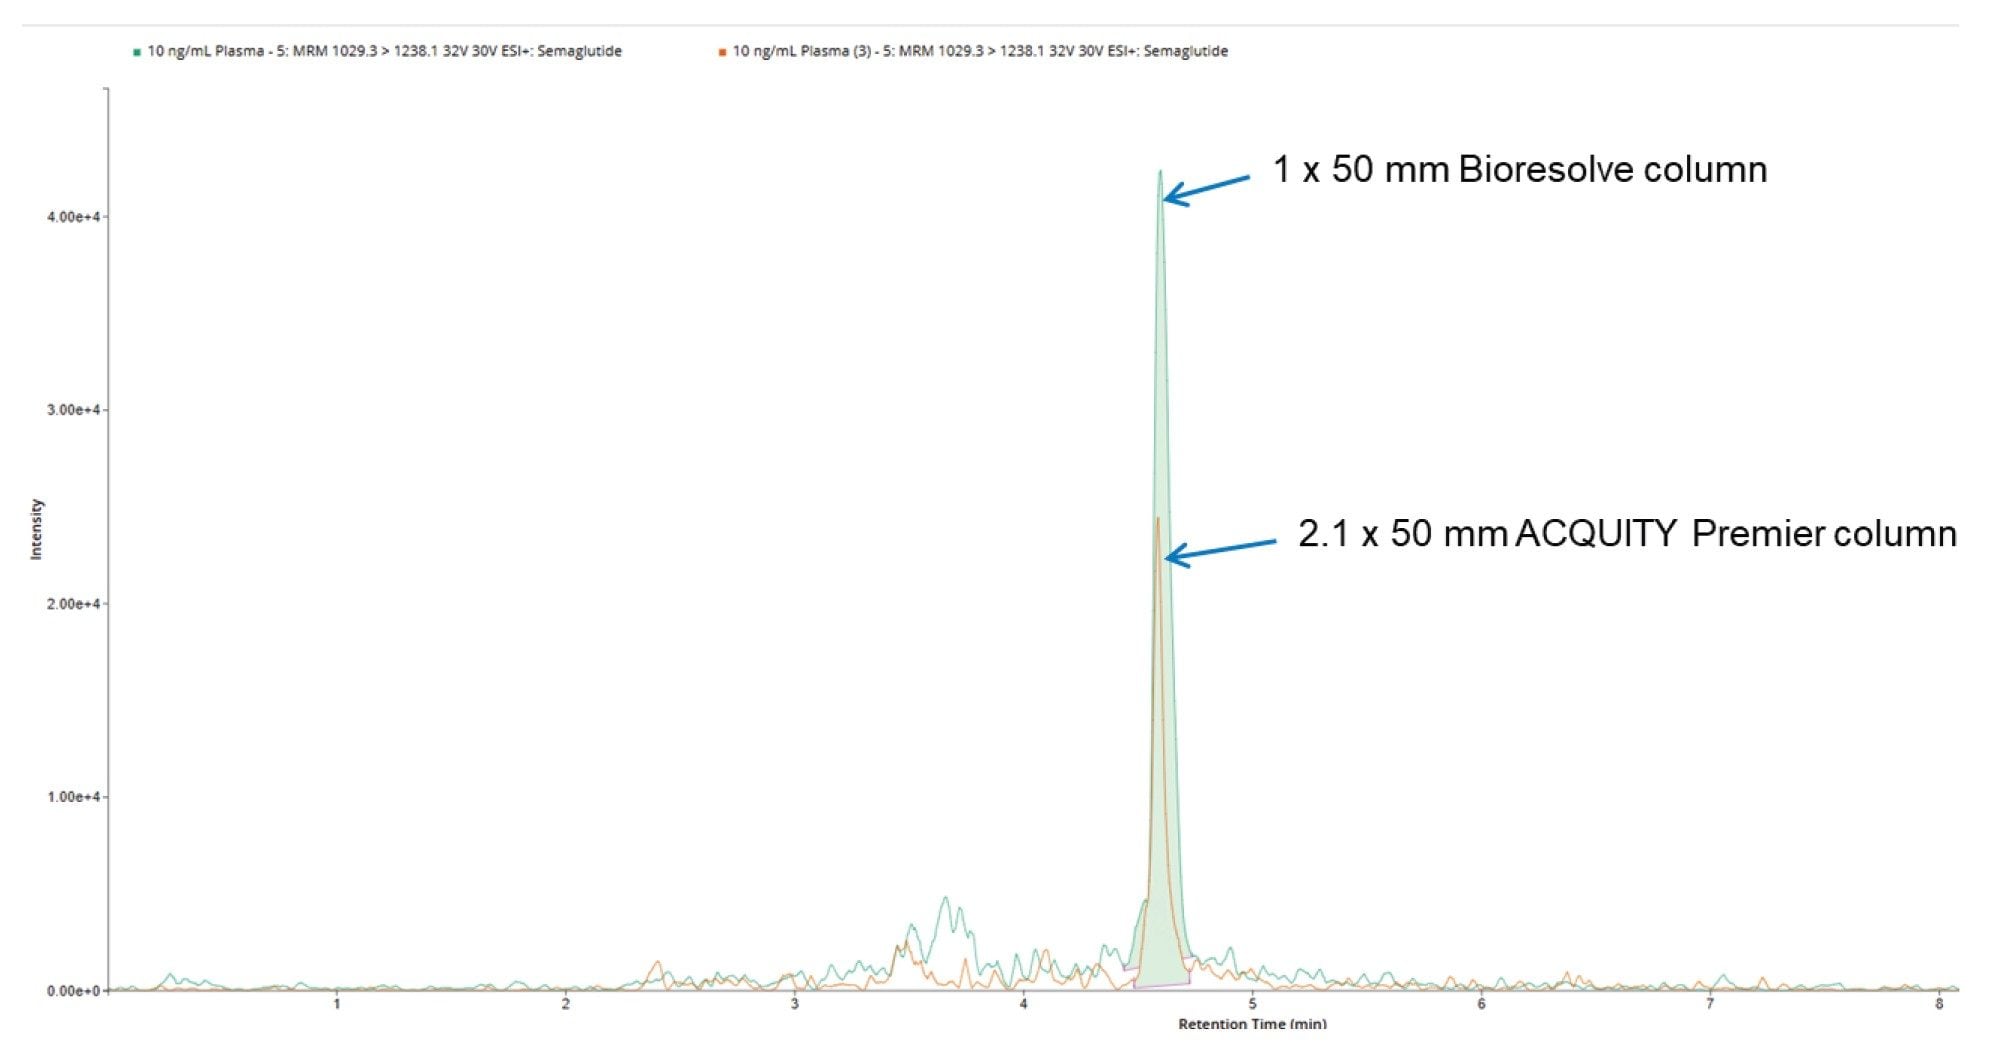
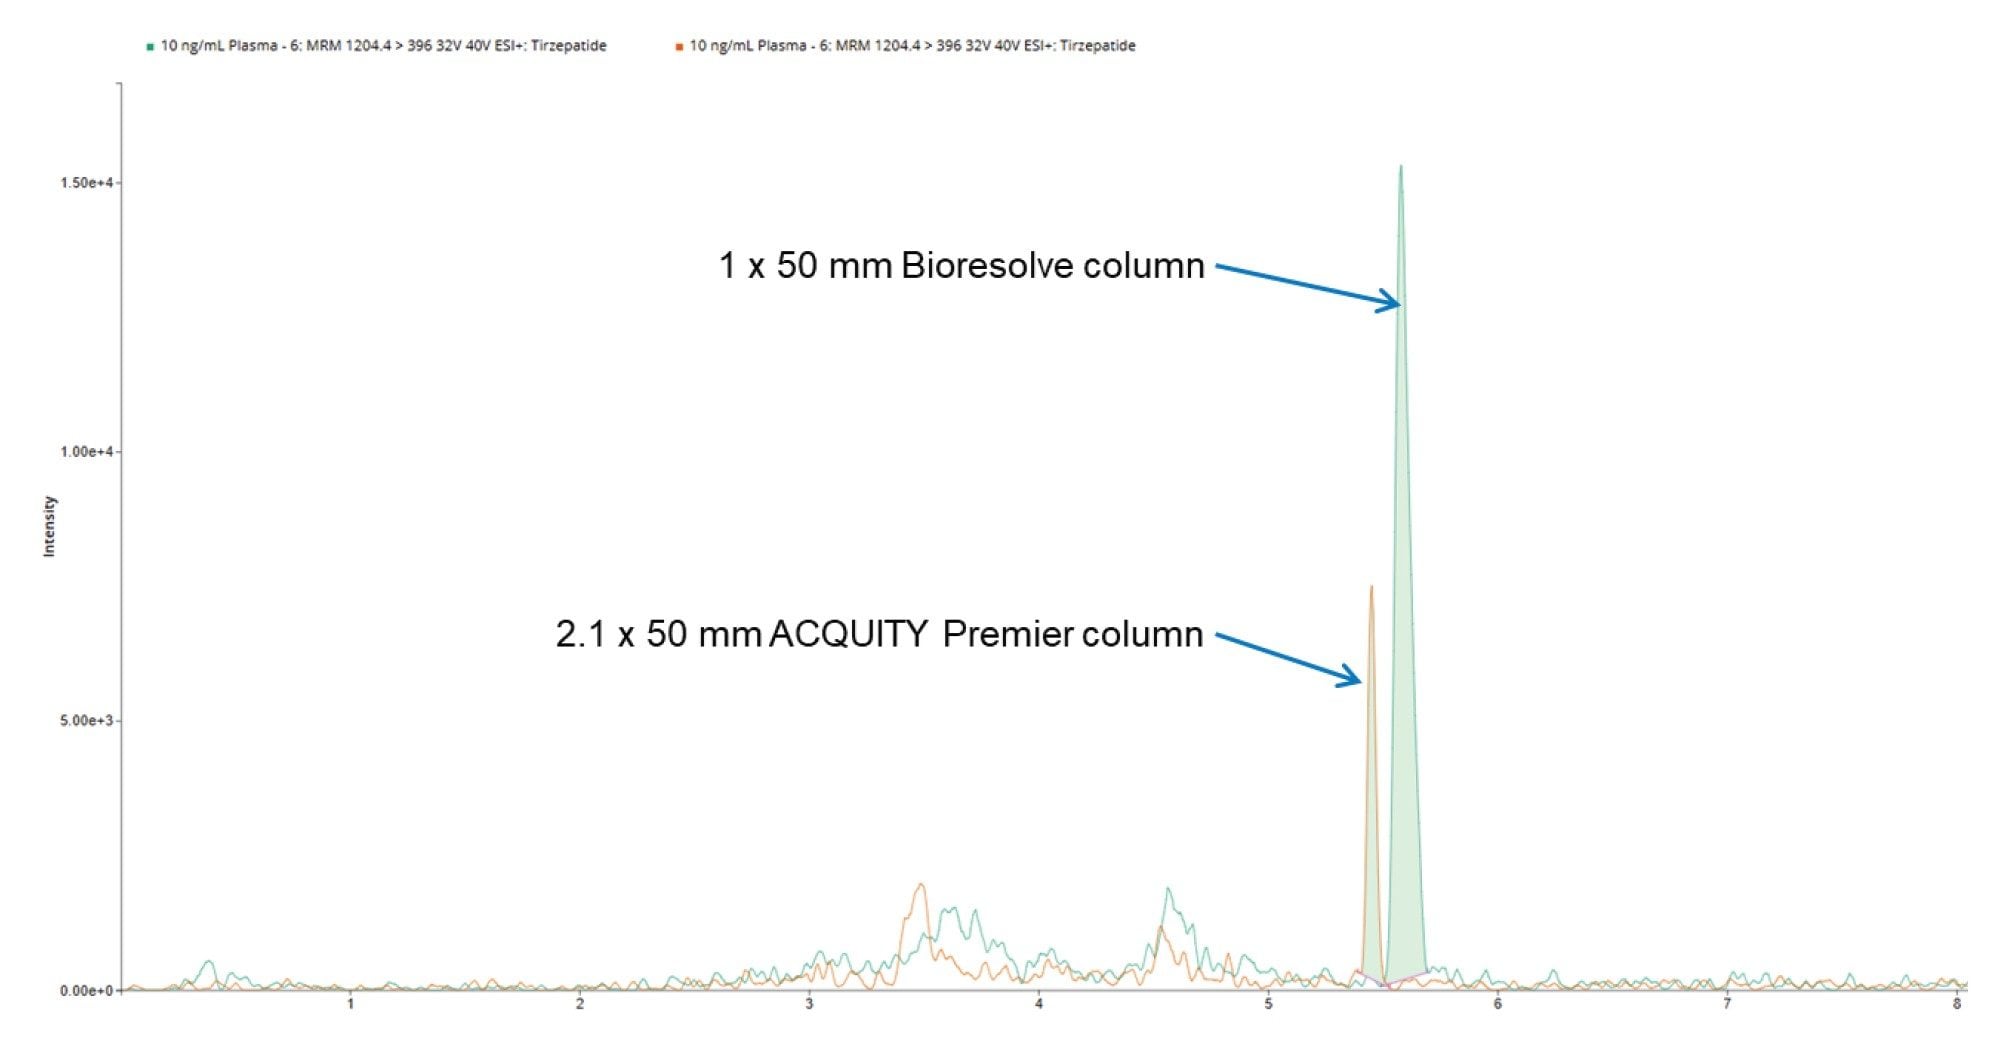
The improved peak signal response obtained from capillary LC and nano-LC scale chromatography, compared to 2.1 mm, is due to a combination of the improved ESI ionization efficiency at the low flow rates used by these columns and the increase in analyte peak concentration (for the same mass loading) obtained from narrower ID columns. While the 1 mm columns do not operate at the low µL/min flow rates of capillary systems, there is a four-fold reduction in column diameter compared to the 2.1 mm ID column. Therefore, assuming an identical mass loading and peak width, and mobile phase linear velocity, the analyte peak concentration should also increase by a factor of 4r. The data shown in Figure 2 and 3 illustrates the comparative peak response obtained for the 10 ng/mL plasma extracts of the GLP-1 RA peptides semaglutide and tirzepatide using 2.1 and 1 mm ID columns. The chromatography was performed on the same chromatography system and mass spectrometer with no changes in the tubing configuration of column connections. The peak response for semaglutide and tirzepatide showed an approximate two-fold increase with the 1 mm column compared to the 2.1 mm column. This improves peak integration accuracy and reduces the need for data review and reanalysis.
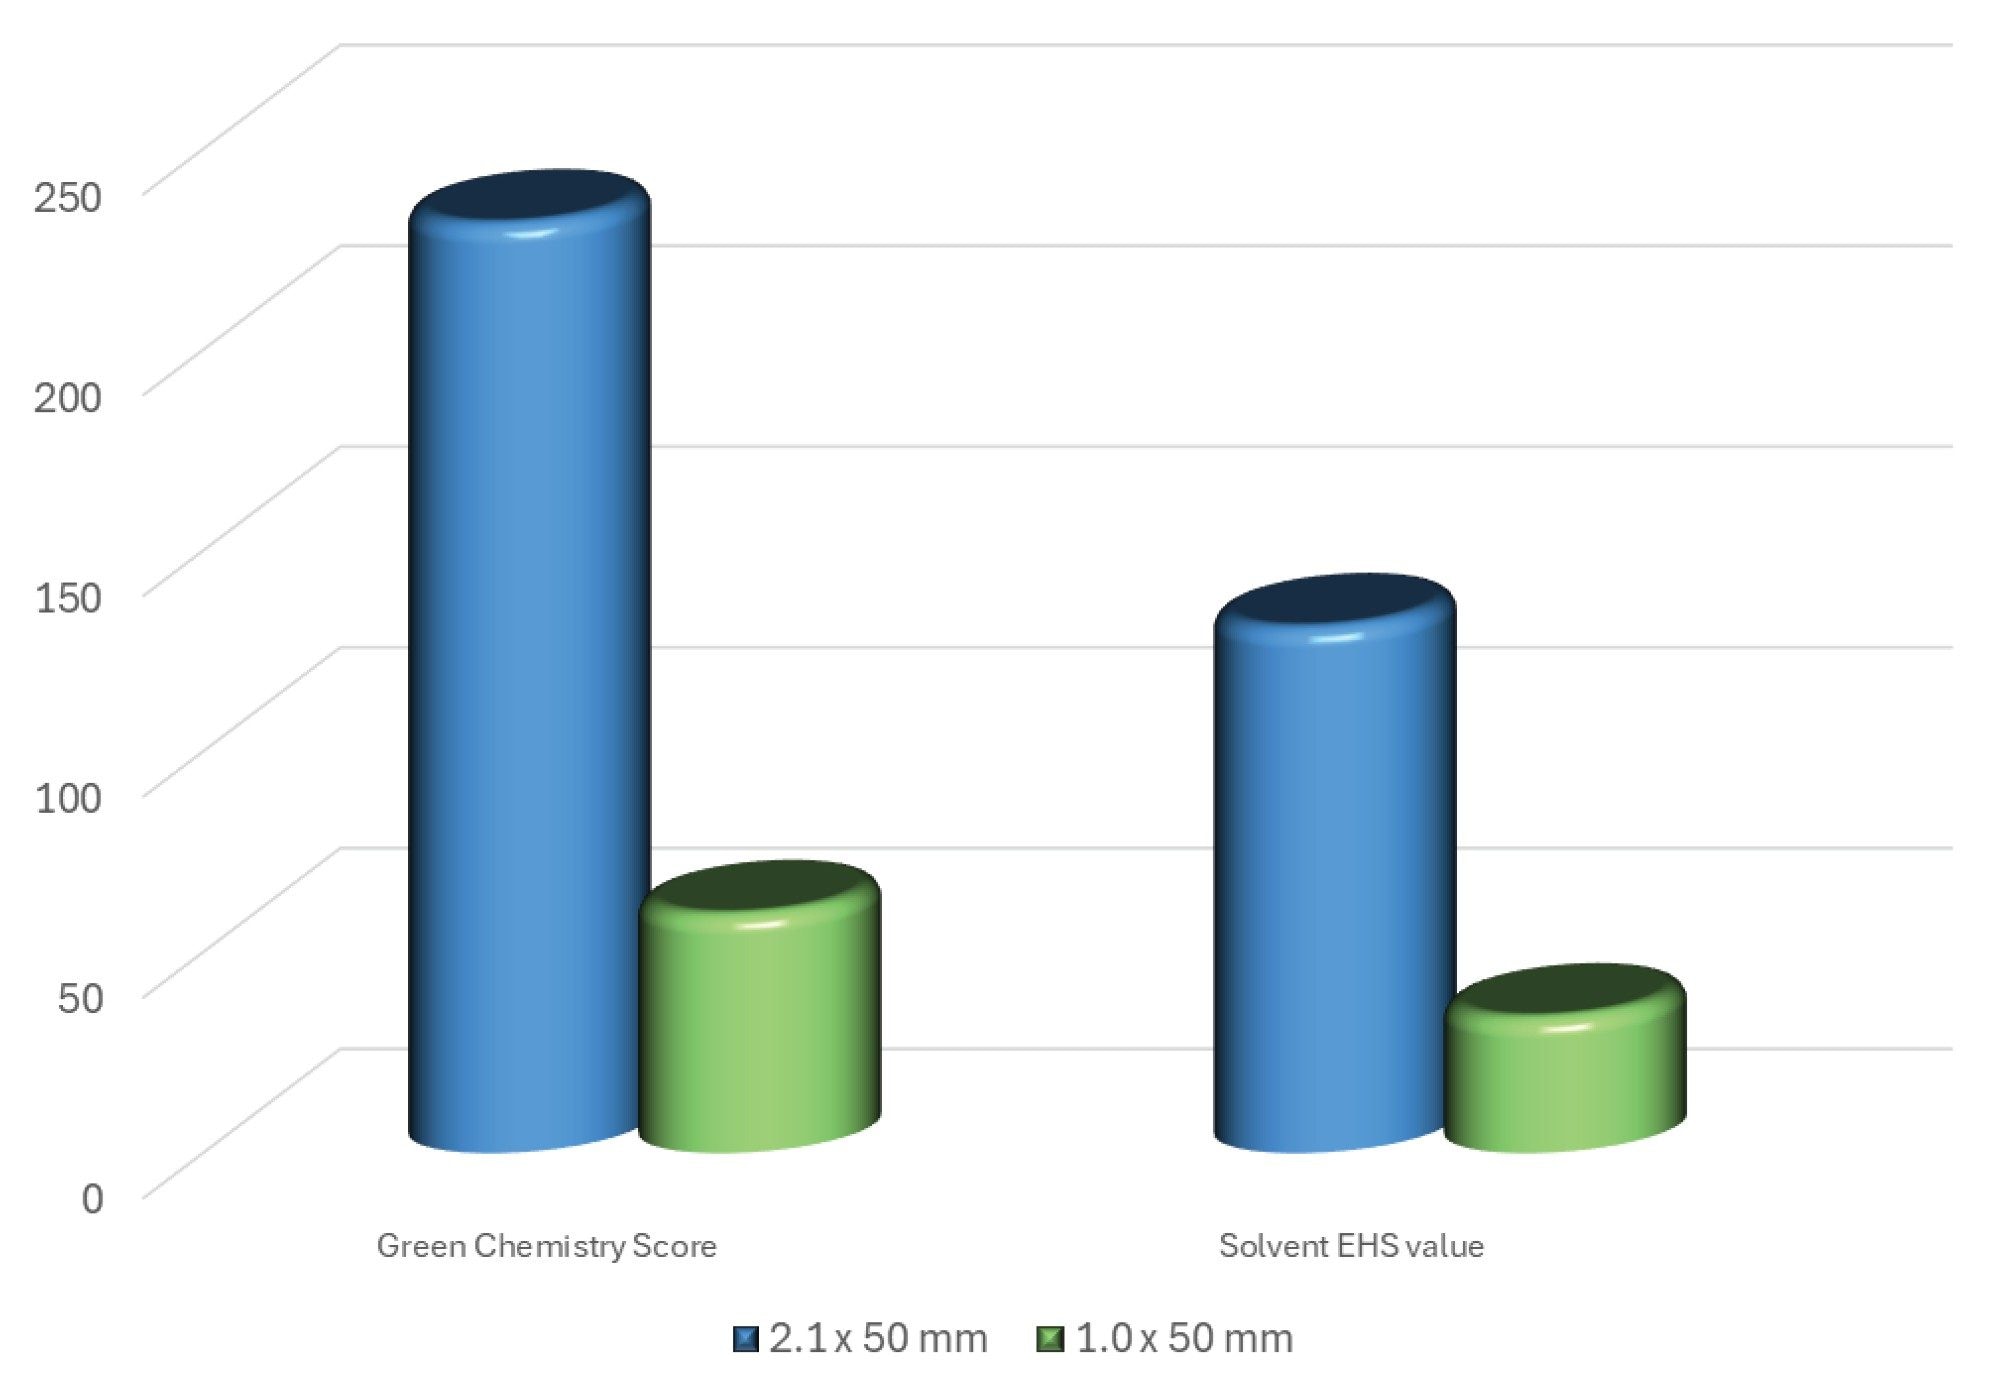
In addition to the two-fold increase in peak response, the 1 mm ID column delivered a 75% reduction in solvent consumption, which translated to a saving of 432 mL of solvent per day, assuming a 24 hour day operation, and 2.1 L per week. Furthermore, 1 mm scale chromatography is easily deployed on the ACQUITY Premier UPLC System with no need for any changes to the column tubing or connections. Additionally, there is no need for a dedicated low flow probe as the Xevo TQ Absolute XR Mass Spectrometer conventional ESI probe can be employed without deleterious effect on the observed chromatography. The ACS green chemistry score showed that the solvent energy score reduced from 231.5 for the 2.1 mm column to 59.46 for the 1 mm column. Similarly the solvent EHS value reduced from 130.9 to 33.74 (https://acsgcipr.org/amgs/). This data shows that there is a significant environmental benefit from using the 1.0 mm ID columns (Figure 4).
Bioanalysis plays a critical role in drug discovery, preclinical development, and human clinical evaluation. The sensitivity, throughput, and specificity of UHPLC-MS/MS have resulted in it being extensively employed for quantitative bioanalysis, with 2.1 mm ID UHPLC being the most popular chromatographic scale. Microflow 1 mm ID scale chromatography offers the potential of reduced solvent consumption and increased peak response. MaxPeak Premier Columns have been specifically designed to mitigate the adsorption of analytes such as GLP-1 RAs to chromatography system metal surfaces which result in poor LC peak shapes and reduced assay sensitivity. MaxPeak Premier Microflow Chromatography Columns facilitate the direct transfer of 2.1 mm ID scale methodologies to 1 mm scale with no loss in chromatographic performance using the analytical scale ACQUITY Premier UPLC System without modification to the connection tubing. The use of 1 mm columns resulted in a 75% reduction in solvent consumption which corresponds to 2.1 L saving in solvent per week for a 24 hour/five-day per week operation.
720009313, April 2026