
Automating and Tailoring SEC-MALS Analysis for QC Environments Using Custom Fields in Waters Empower Software
Collin Britten, Neil Lander, Colette Quinn, Udayabagya Halim
Waters Corporation, United States
Published on September 24, 2026

Abstract
Multi-angle light scattering (MALS) provides measurement of molecular weight and aggregation – critical quality attributes (CQAs) for many biotherapeutics – without the need for column calibration. This work outlines a practical framework for implementing SEC MALS analysis within Waters Empower™ Chromatography Data System (CDS), using custom fields to further automate and tailor these calculations. Four application case studies are shared: (1) UV extinction coefficient calculation, (2) oligomer assignment, (3) dn/dc determination via mass recovery, and (4) reporting for user-defined thresholds within the molecular weight distribution. These workflows reduce analyst variability, eliminate external calculations, and support data integrity in regulated QC environments.
Benefits
- Custom fields in Empower CDS streamline data management by eliminating manual spreadsheet workflows, reducing risk through native implementation, increasing efficiency and improved product quality
- Absolute molar mass allows assignment of average oligomeric state, independent of molecular conformation or column calibration
- Equations for empirical extinction coefficient and dn/dc determination support accurate quantitation for complex modalities such as ADCs using custom fields
- Reporting user-defined windows within the molecular weight distribution reveals heterogeneity invisible to UV peak area alone
Introduction
As biopharmaceuticals increase in complexity, QC analytics must ensure accurate measurement of product quality, safety, and efficacy.1 Traditional SEC UV relies on calibration standards and assumes comparable analyte conformation, introducing systematic error when this assumption fails.
MALS overcomes this limitation by directly measuring molar mass from light scattering, independent of retention time, column calibration, or molecular shape.2 When coupled with UV and differential refractive index (dRI) detection and implemented in Empower CDS, it provides orthogonal, calibration free characterization within a compliant environment.4
Starting with Empower 3.10.0 and expanding in Empower 3.10.1 Software, native SEC MALS analysis is integrated into the CDS using the DAWN MALS Photometer. Custom fields extend this capability by embedding product specific calculations—such as extinction coefficients, dn/dc, mass distributions, and oligomeric state, directly into the workflow. This eliminates the use of external spreadsheets and reduces transcription risk.
Experimental
A representative - but non-exhaustive – instrumental configuration presented in this document is summarized below:
LC Conditions
|
LC system: |
Arc™ Premier HPLC System, ACQUITY™ Premier UPLC System, Alliance™ iS or Alliance iS Bio System |
|
Detector 1: |
2489 TUV Detector or 2998 PDA Detector |
|
Detector 2: |
Optilab™ Refractometer |
|
Gradient: |
Isocratic |
Table 1. Instrumentation configuration for SEC-MALS analysis.
MALS Conditions
|
MALS system: |
DAWN™ MALS Photometer |
|
Angles: |
18-angle |
Data Management
|
Informatics: |
Empower Chromatography Data System v. 3.10.1 with Advanced Detector License |
Results and Discussion
Empower CDS Custom Fields Workflow
Custom fields enable calculations at the project level using native results, removing manual analysis steps. The following four implementations provide expanded analysis options for SEC‑MALS workflows.
Application 1: UV Extinction Coefficient from dRI
Relevant modalities: monoclonal antibodies (mABs); peptides; bispecific antibodies; fusion proteins; complex or modified protein structures.
The UV extinction coefficient (ε) is critical for concentration determination of protein therapeutics. While sequence-based estimates are reliable for mABs and proteins, complex modalities (e.g., bispecifics or other modified structures) often deviate from the predicted values due to contribution of a conjugated payload or mispaired chains.
Because the refractive index increment of proteins (dn/dc) is largely sequence-independent, dRI provides an absolute concentration measurement.8 Combining data from UV and dRI signals thus enables empirical ε determination:
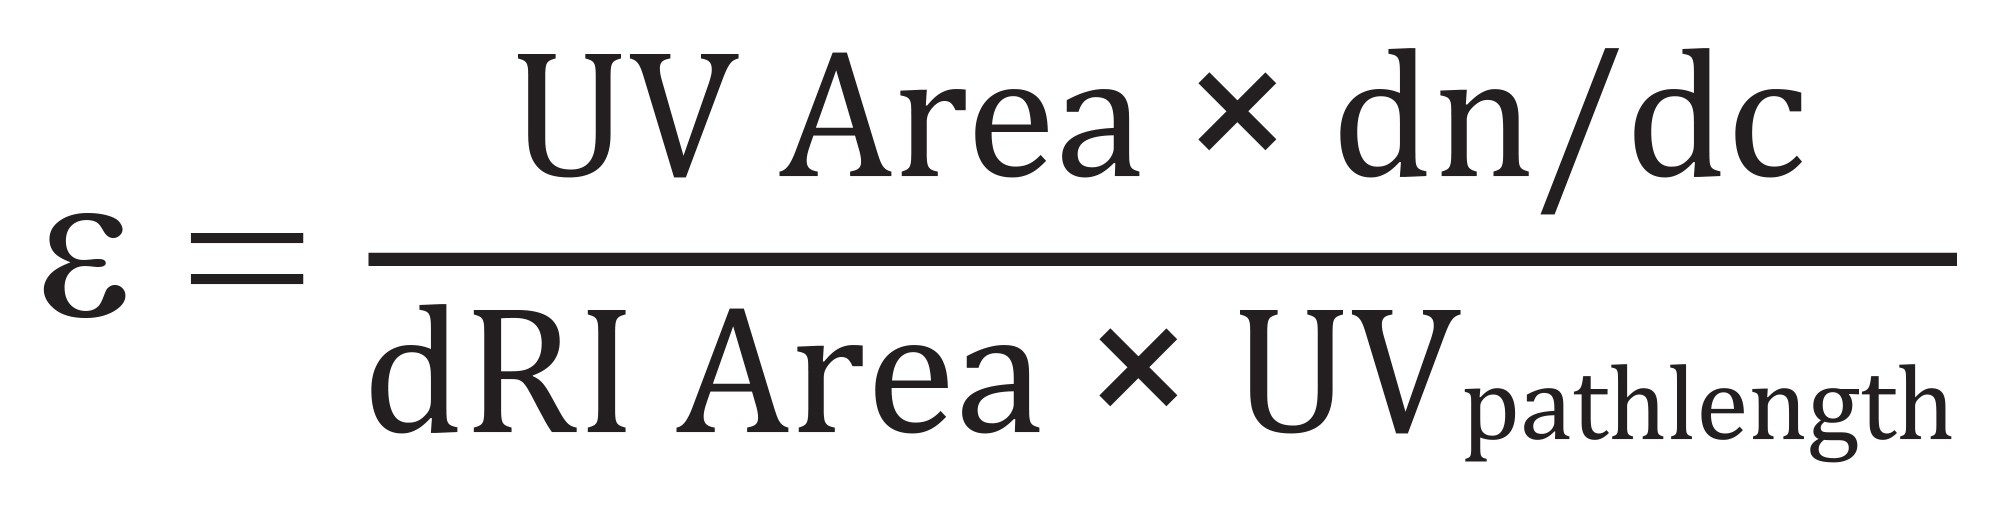
Equation 1. Empirical UV extinction coefficient from simultaneous UV and dRI peak areas.
This equation can be implemented for each peak in a chromatogram, or as a sum across all peaks identified in a single injection. The value may be used in subsequent downstream analyzes, or as an orthogonal confirmation of product identity. Using the observed extinction coefficient, in conjunction with the absolute molar mass measured by MALS, provides greater confidence in product identity than the information provided by SEC-UV alone.
The Empower Software can then report the average and standard deviation across replicate injections to monitor this CQA and track across production batches.
Application 2: Oligomeric State Assignment
Relevant modalities: mABs; peptides; bispecific antibodies; fusion proteins; complex or modified protein structures.
Absolute molar mass can be converted into an oligomeric state to report results directly in terms of relevant biophysical properties. Especially for protein and peptide therapeutics, this gives clearer connection to the underlying CQA and simplifies interpretation of the results for QC implementation without reliance on external calculations.
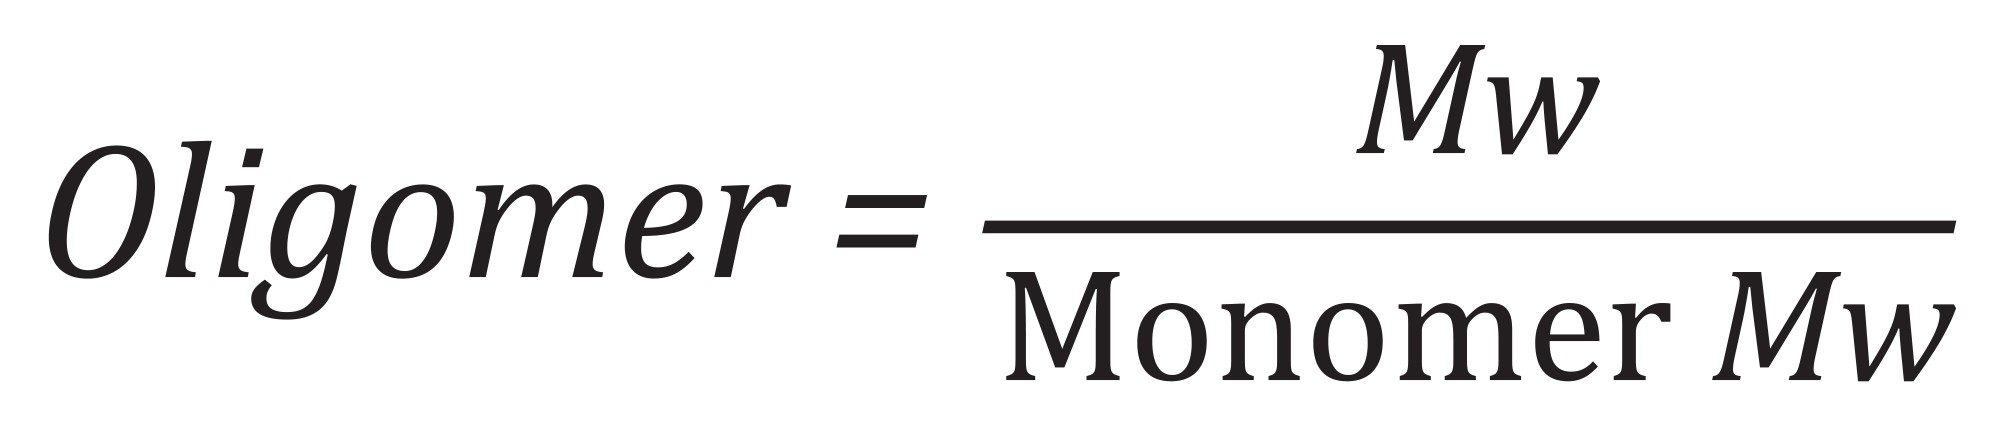
Equation 2. Oligomeric state assignment from MALS-derived absolute molar mass and user-defined monomer molar mass.
The monomer molecular weight may be defined in the processing method, automating the calculation without need for analyst input or intervention. This automated assignment supports regulatory expectations for protein and peptide therapeutics, where oligomer distribution impacts safety and efficacy.3,5
Application 3: dn/dc from 100% Mass Recovery
Relevant modalities: polysaccharides; synthetic polymers; polymeric excipients; PEGylated biologics.
The incremental refractive index (dn/dc) is a necessary parameter to be specified for any SEC-MALS experiment. This value is used directly in the light scattering analysis, so any error in dn/dc will result in a systematic error in the measured molecular weight.
These values are generally described in literature for many materials.8-11 For polymers and conjugates lacking literature dn/dc values, empirical determination can be performed using injected mass and dRI signal, by assuming 100% mass recovery during the SEC separation10 :
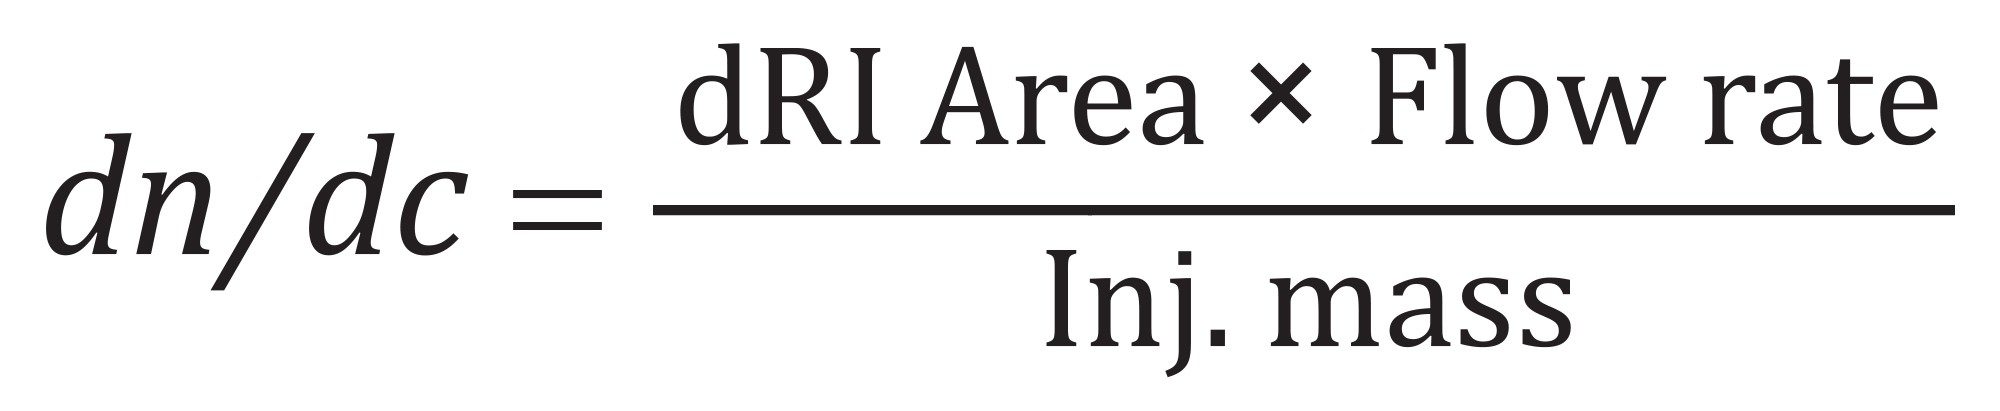
Equation 3. Empirical dn/dc determination from 100% mass recovery using the dRI peak area and known injected mass.
This method provides an alternative, orthogonal approach to the more labor-intensive batch dn/dc methods. This approach offers a meaningful way to validate the identity of novel materials that lack supporting literature.
Application 4: Molar Mass Distribution Analysis
Relevant modalities: polysaccharides; synthetic polymers; polymeric excipients; PEGylated biologics.
Many developers of polymer-based products, including PEGylated biologics, polysaccharide excipients, and synthetic polymer drug delivery systems regularly specify the quantitative limits of subpopulations within the molecular weight distribution (MWD). For example, some regulatory bodies place strict limits on low molecular weight species in synthetic polymers to enforce the characterization of residual monomers. Polysaccharides and other biopolymers may require monitoring the content of different high molecular weight species to assess process stability and product safety or efficacy.
While peak integration provides an average result across the entire distribution, custom fields allow users to report molar mass and mass fraction for targeted populations of interest within the sample:
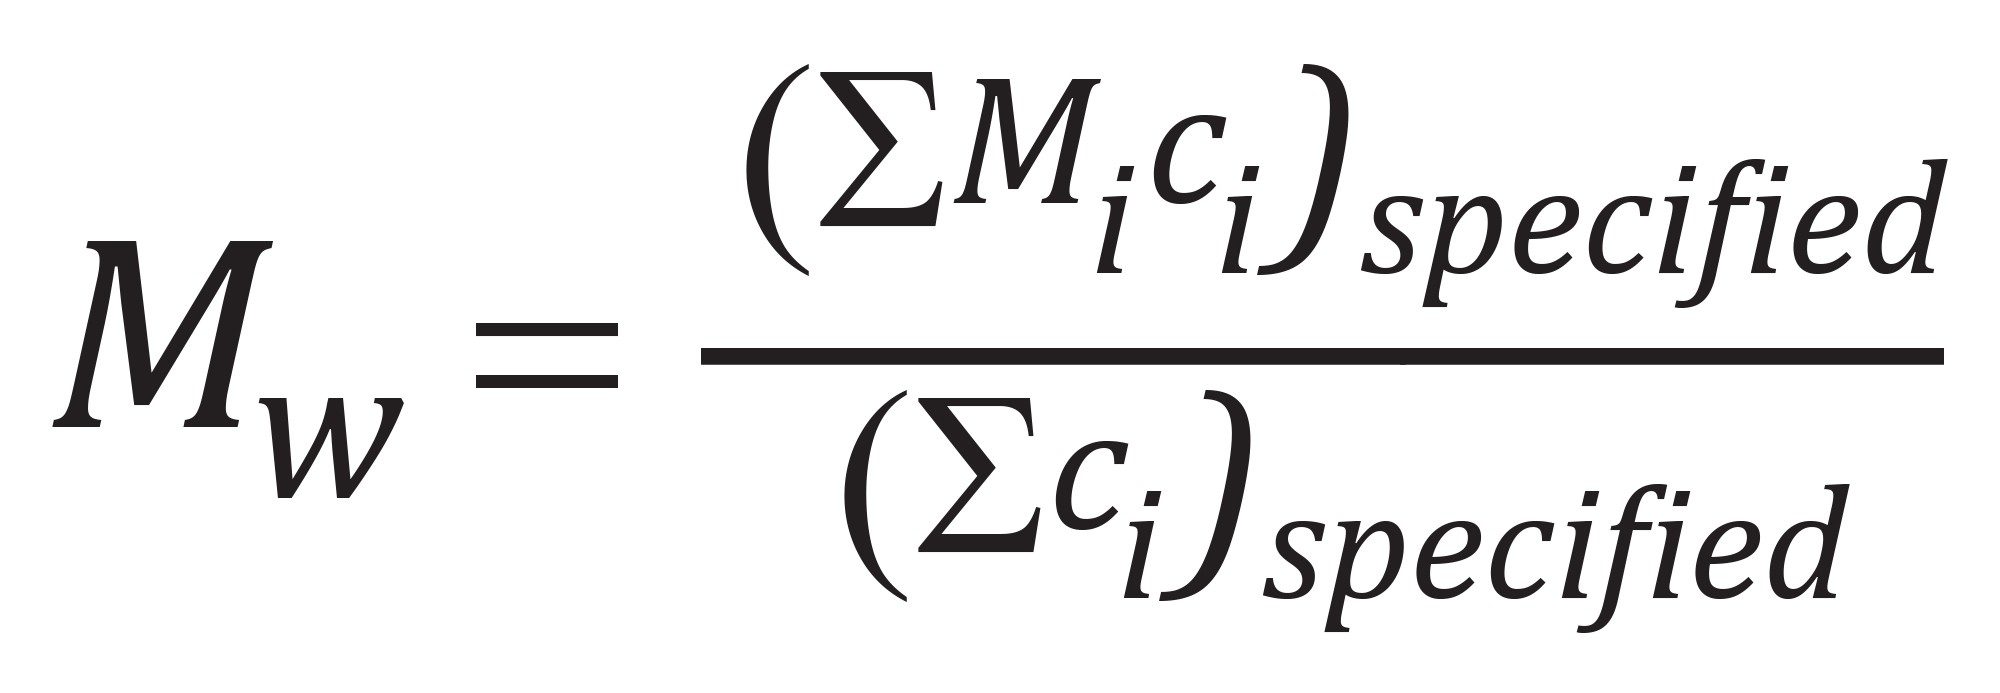
Equation 4. Weight-average molar mass within a user-defined molecular weight window, calculated from the slice molecular weight and slice concentration (Mi and ci , respectively).
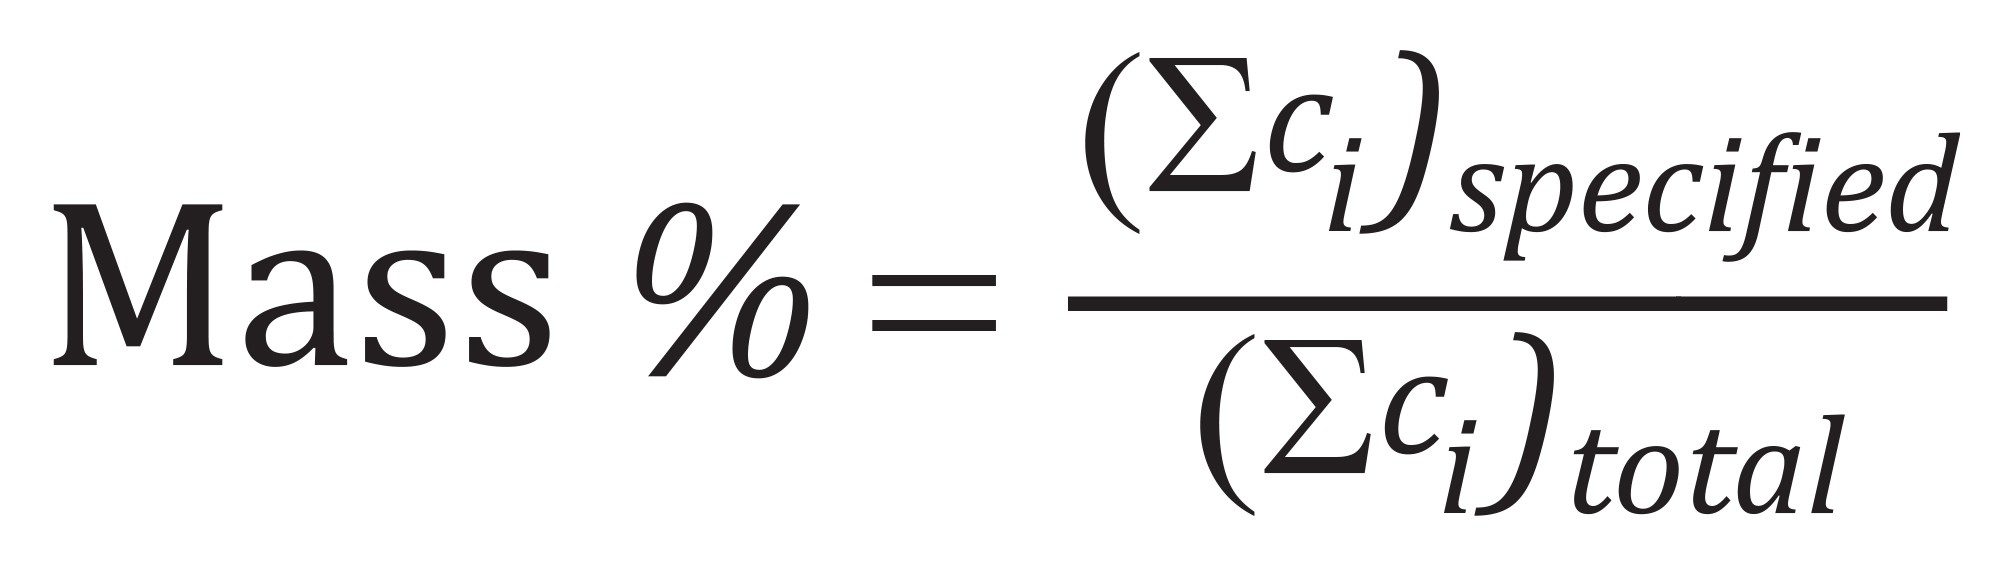
Equation 5. Mass fraction within a user-defined molecular weight window, calculated from the slice concentration (ci).
These equations provide a means to add product-specific thresholds to give deeper insight into the molecular weight distribution. These calculations may be adjusted to specify specific mass fractions of the distribution (e.g., to report the molecular weight between 10% and 90% of the total mass fraction), as well as specific molecular weight ranges (e.g., report the mass fraction between 10 kDa and 100 kDa). In addition, these limits may be specified within the processing method to automatically apply the correct limits with minimal user intervention.
Using SEC-MALS with the above calculations in the Empower Software allows for more detailed interpretation of molecular weight distributions to directly support lot-release decisions.
Conclusion
SEC-MALS provides molecular weight, aggregation, and heterogeneity of biotherapeutics and polymer-based drug products in all CQAs directly linked to safety and efficacy. When DAWN MALS detection is implemented within the Waters Empower CDS, analysts gain calibration-free, absolute molar mass measurement in a fully compliant chromatography data system.
The four custom field workflows demonstrated here: UV extinction coefficient determination, oligomeric state assignment, dn/dc calculation, and molar mass distribution analysis are all extensions of the analysis built into Empower CDS through custom fields. Custom fields eliminate external spreadsheet processing and enable users to embed product-specific calculations into the processing method. The result is reduced analyst variability, strengthened audit-trail integrity, and accelerated method deployment across complex modalities including mABs, complex proteins, peptides, and synthetic polymers.
References
- Wen, J.; Arakawa, T.; Philo, J.S. Anal Biochem. 1996;240(2):155-166.
- ICH Q6B. 1999.
- FDA ANDA Guidance for Highly Purified Synthetic Peptide Drug Products. 2021.
- USP <1430.1> Analytical Methodologies Based on Scattering Phenomena / Static Light Scattering.
- FDA Biosimilarity Guidance.
- Waters Corporation. Empower 3.10.0/3.10.1 Release Notes. 2025–2026.
- Waters Corporation. DAWN MALS Detector Technical Note.
- Waters Corporation TN4002: The Refractive Index Increment of Proteins
- Waters Corporation AN9009: Determination of dn/dc with an Optilab
- Waters Corporation TN4001: Online dn/dc Determination
- Waters Corporation. Database of dn/dc values.
Acknowledgements
All data used in the analysis was collected by Waters Corporation, in facilities in Santa Barbara, CA and Milford, MA.
720009595, September 2026


