Assessing Glutamine Synthetase Selection and Antibody Productivity in CHO Cells Using the Waters BioResolve™ Protein A Affinity Column
Topher Pirnera, Julie Wushenskyb, Derek Consulaa, Chandler Przybylskib, Mark Blennera, Rui Chenb
aChemical & Biomolecular Engineering, University of Delaware
bWaters Corporation, Immerse™ Lab Delaware, United States
Published on March 11, 2026
Abstract
Accurate titer quantification remains a major analytical challenge during early cell-line development, where transfected pools typically display heterogeneous and low-level expression. Using the enhanced sensitivity of the Waters BioResolve Protein A Affinity Column, this application note shows that intermediate placement of the glutamine synthetase (GS) cassette between the antibody light- and heavy-chain promoters produces the highest transgene copy number and qP, while internal ribosome entry site (IRES) linked GS configurations result in substantially diminished productivity.
Benefits
- Improved sensitivity for Protein A titer analysis, with a detection limit as low as 0.05 µg of antibody using the BioResolve Protein A Column.
- Enables accurate quantitation of low-titer monoclonal antibodies (mAbs) during early cell line development, when expression is heterogeneous and often near assay detection limits.
Introduction
mAbs constitute one of the most dominant classes of biotherapeutics, accounting for nearly 80% of biopharmaceutical sales as of 2015.1 Mammalian expression systems, particularly Chinese hamster ovary (CHO) cells, are the preferred production platform due to their ability to perform human-like post-translational modifications, their scalability from shake flasks to bioreactors, and their capacity to achieve gram-per-liter titers.2,3
Stringent GS selection is essential for generating robust, high-producing CHO cell lines.4 Various methods have been used to increase GS selection stringency, such as attenuated promoters, mutant GS enzymes, or small-molecule inhibitors such as methionine sulfoximine (MSX).4,5 Additionally, the arrangement of antibody light- and heavy-chain genes within an expression construct can influence antibody titer and product quality.6,7 However, to current knowledge, intentional positional attenuation of GS expression via systematic variation of GS cassette placement relative to antibody genes to fine-tune selection stringency and enrich high-producing cells has not yet been systematically examined in CHO systems.4,5,8
Following payload integration and GS-based selection, accurate quantification of product titer during early cell-line development remains a persistent analytical challenge.9-11 Expression across transfected pools is often heterogeneous and substantially lower than in production-ready lines.10 Limited sample volumes and matrix interference from host cell proteins, DNA, and media components can further reduce analytical sensitivity and reproducibility.12-14
Commonly used titer measurement techniques include enzyme-linked immunosorbent assay (ELISA), bio-layer interferometry (BLI), and Protein A affinity chromatography.12-14 ELISA offers high sensitivity but is labor-intensive and low-throughput.12 BLI provides rapid, label-free quantification and is amenable to high-throughput screening formats, but can be affected by matrix components and assay conditions.13 Protein A affinity chromatography offers excellent specificity and linear quantification across a wide dynamic range using affinity columns such as the Waters BioResolve Protein A System, although the requirement for sample clarification can limit throughput.11,14
In this application note, strategic modulation of GS expression is demonstrated through its relative positioning within an expression plasmid, which can improve mAb productivity in CHO cells. By varying GS placement relative to antibody genes, it shows how assessing vector design affects selection pressure, copy number, and specific productivity (qP). Because this early cell line development was performed under non-optimized conditions, the resulting qP values are low, reflecting early-stage expression performance. The Waters BioResolve Protein A Affinity Column enabled sensitive and reproducible quantification, supporting reliable assessment of early productivity.14
Experimental
Plasmid Construction and Cell Line Generation
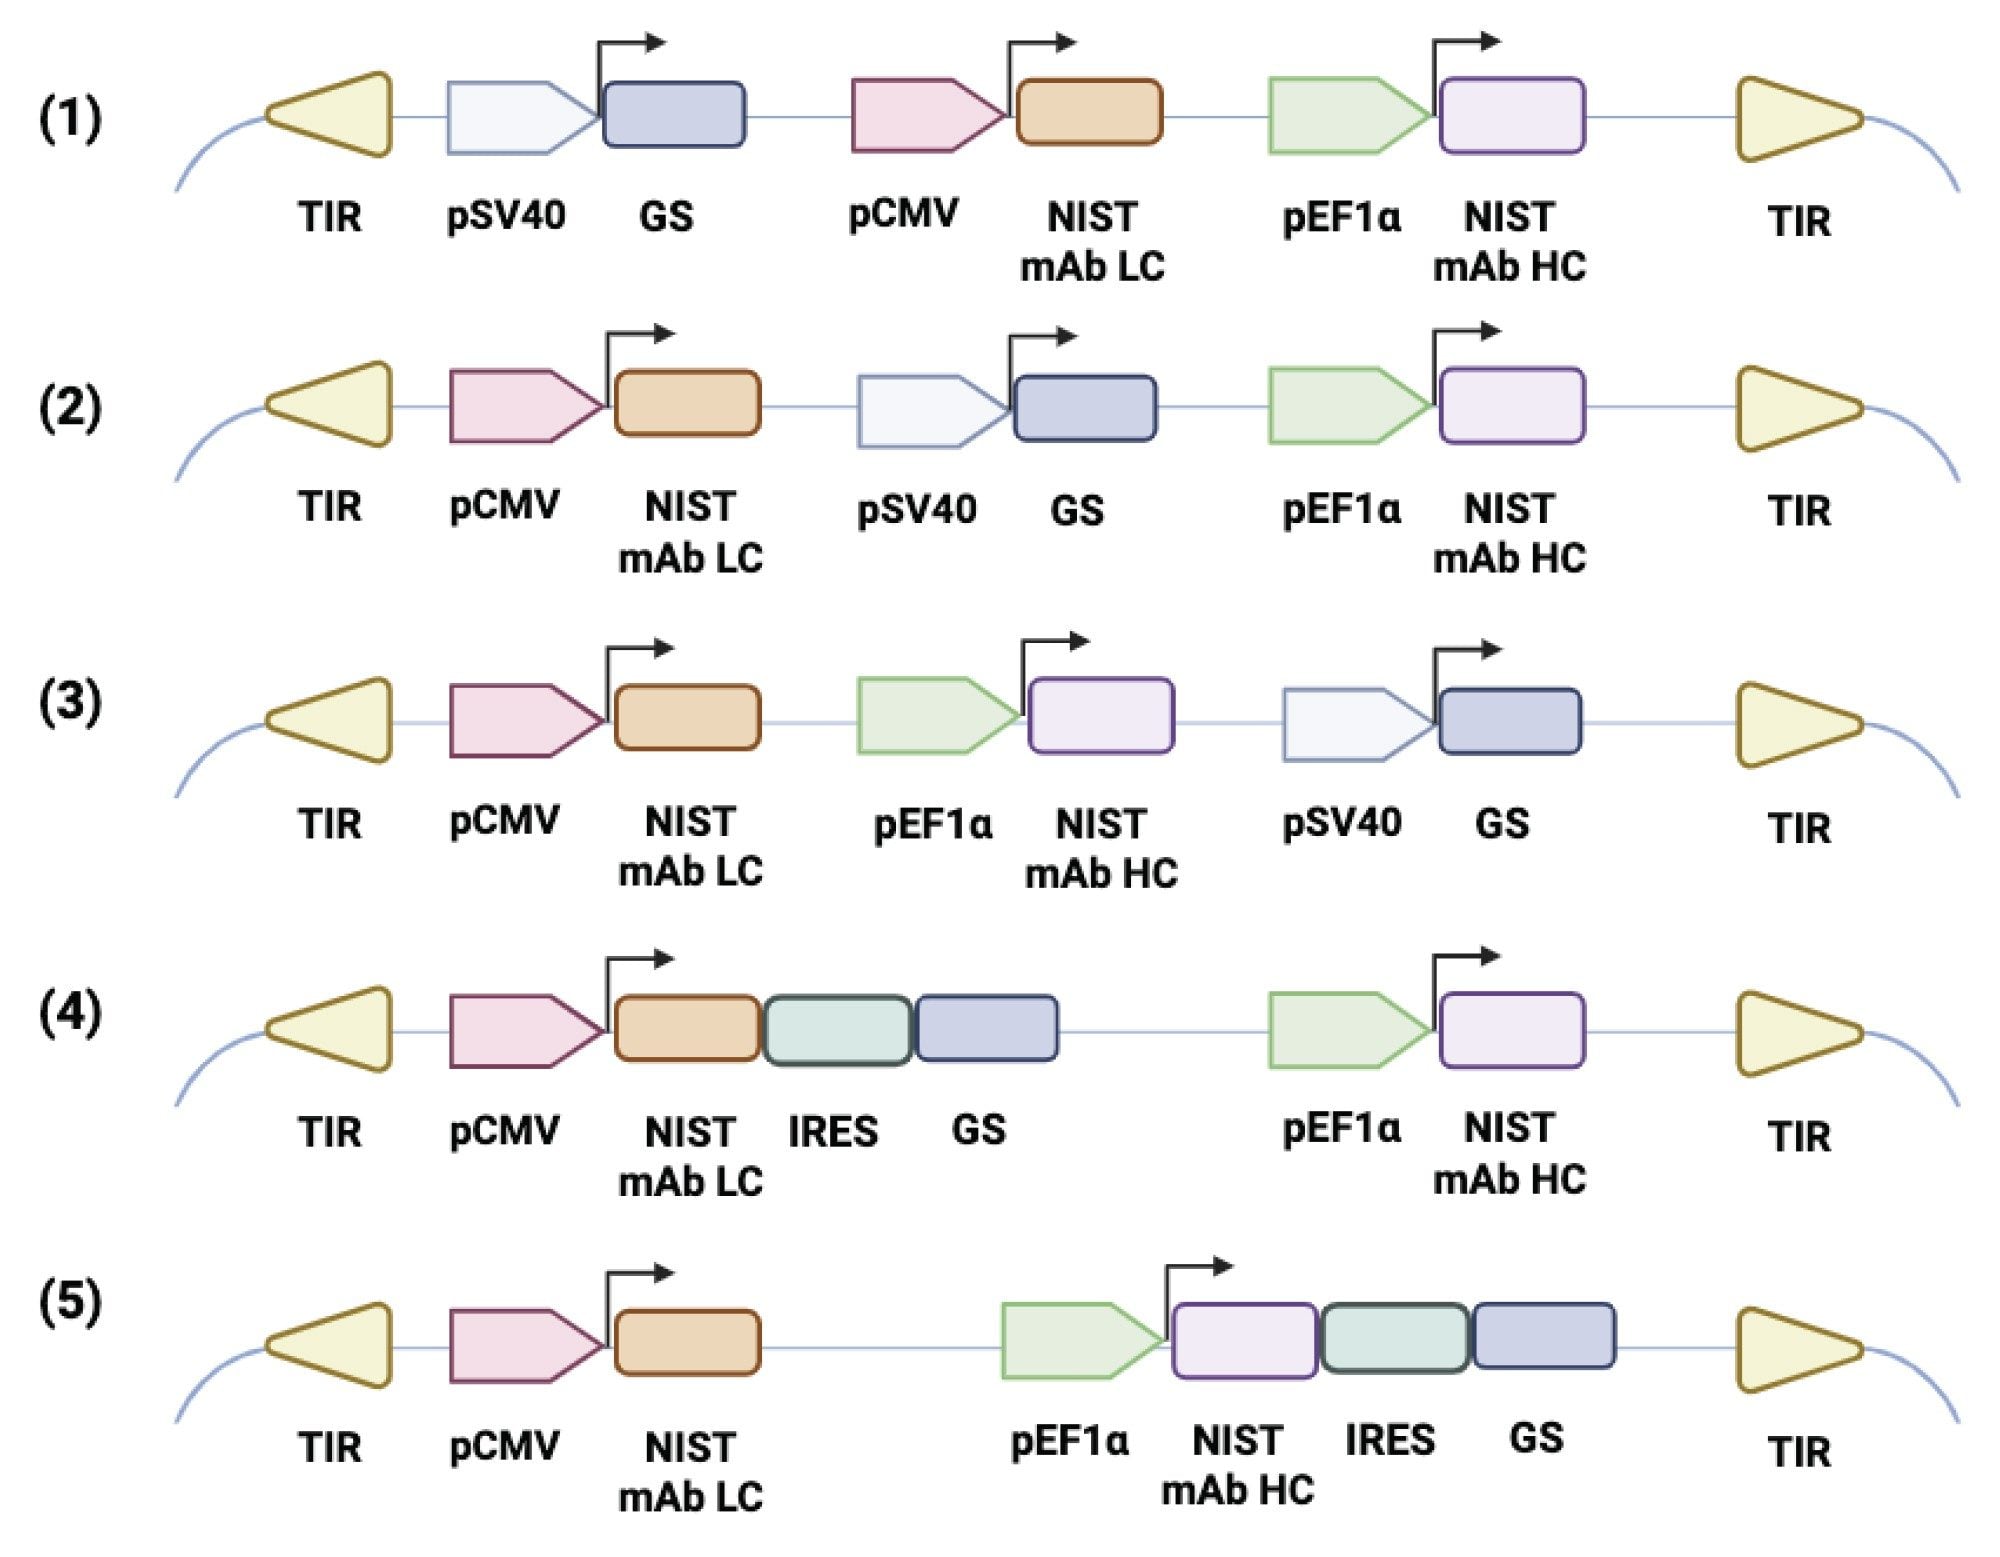
The NISTmAb light- and heavy-chain genes, as reported by Dahodwala et al.,15 were cloned into expression plasmids driven by CMV and EF1α promoters, respectively. To examine the effect of GS positioning and expression mode on antibody productivity, a series of constructs were generated with the GS cassette expressed either from an SV40 promoter or via an internal ribosome entry site (IRES) downstream of the light or heavy chain. Each plasmid contained the antibody and GS expression modules flanked by terminal inverted repeats (TIRs) to support transposase-mediated genomic integration, consistent with standard dual-vector transposon systems in mammalian cells.16 Plasmids were assembled by Gibson assembly and propagated in E. coli. A schematic of all designs is shown in Figure 1.
CHOZN® ZFN-modified GS⁻/⁻ CHO cells (Merck KGaA, Darmstadt, Germany) were cultured in EX-CELL® CD CHO Fusion medium (Sigma-Aldrich) in Bio-Reaction Tubes (CELLTREAT) at 37 °C, 5% CO₂, 80% relative humidity, and 200 rpm. Cultures were maintained with 6 mM L-glutamine supplementation and passaged every 3–4 days at a seeding density of 0.5 × 10⁶ cells/mL.
For transfection, 1 × 10⁷ cells were electroporated with 35 µg of donor plasmid (designs 1–5; Figure 1) and 15 µg of a proprietary NLS-tagged transposase plasmid in 500 µL of medium containing 6 mM L-glutamine. Electroporation was performed in 4 mm cuvettes (Lee Plastic Company) at 300 V and 950 µF using an exponential decay pulse on a BTX Gemini Twin Wave Electroporator (Fisher Scientific). Transfected cells were recovered in 10 mL of supplemented medium and incubated under standard conditions. After 24 hours, cells were centrifuged at 500 × g for 5 minutes and maintained under GS selection. Cultures were passaged twice weekly at 1 × 10⁶ cells/mL until viability exceeded 90%.
Fed-Batch Culture, Copy Number, Titer, and Specific Productivity
Stable pools were seeded at 1 × 10⁷ cells in 30 mL EX-CELL® Advanced CHO Fed-Batch Medium (Sigma-Aldrich) and cultured in Bio-Reaction Tubes. Cell density and viability were monitored daily by trypan blue exclusion using a CellDrop FL automated cell counter (DeNovix). Beginning on day 3, cultures were fed every other day with 5% (v/v) EX-CELL® Advanced CHO Feed 1 (without glucose). From day 5, glucose was supplemented as needed to maintain concentrations ≥ 4 g/L throughout the fed-batch process.3,9
Genomic DNA (gDNA) was isolated from 5 × 10⁶ pelleted cells using the Monarch® Genomic DNA Purification Kit (New England Biolabs). Quantitative PCR (qPCR) was performed on a CFX96 Optics Module Thermocycler (Bio-Rad) using the qScript™ One-Step SYBRÒ Green qRT-PCR Kit (QuantaBio). GS copy number was quantified by generating a standard curve of Cq values from a serial dilution of plasmid Design 3 DNA of known mass. Copy numbers for genomic DNA samples were interpolated from this plasmid DNA standard curve.
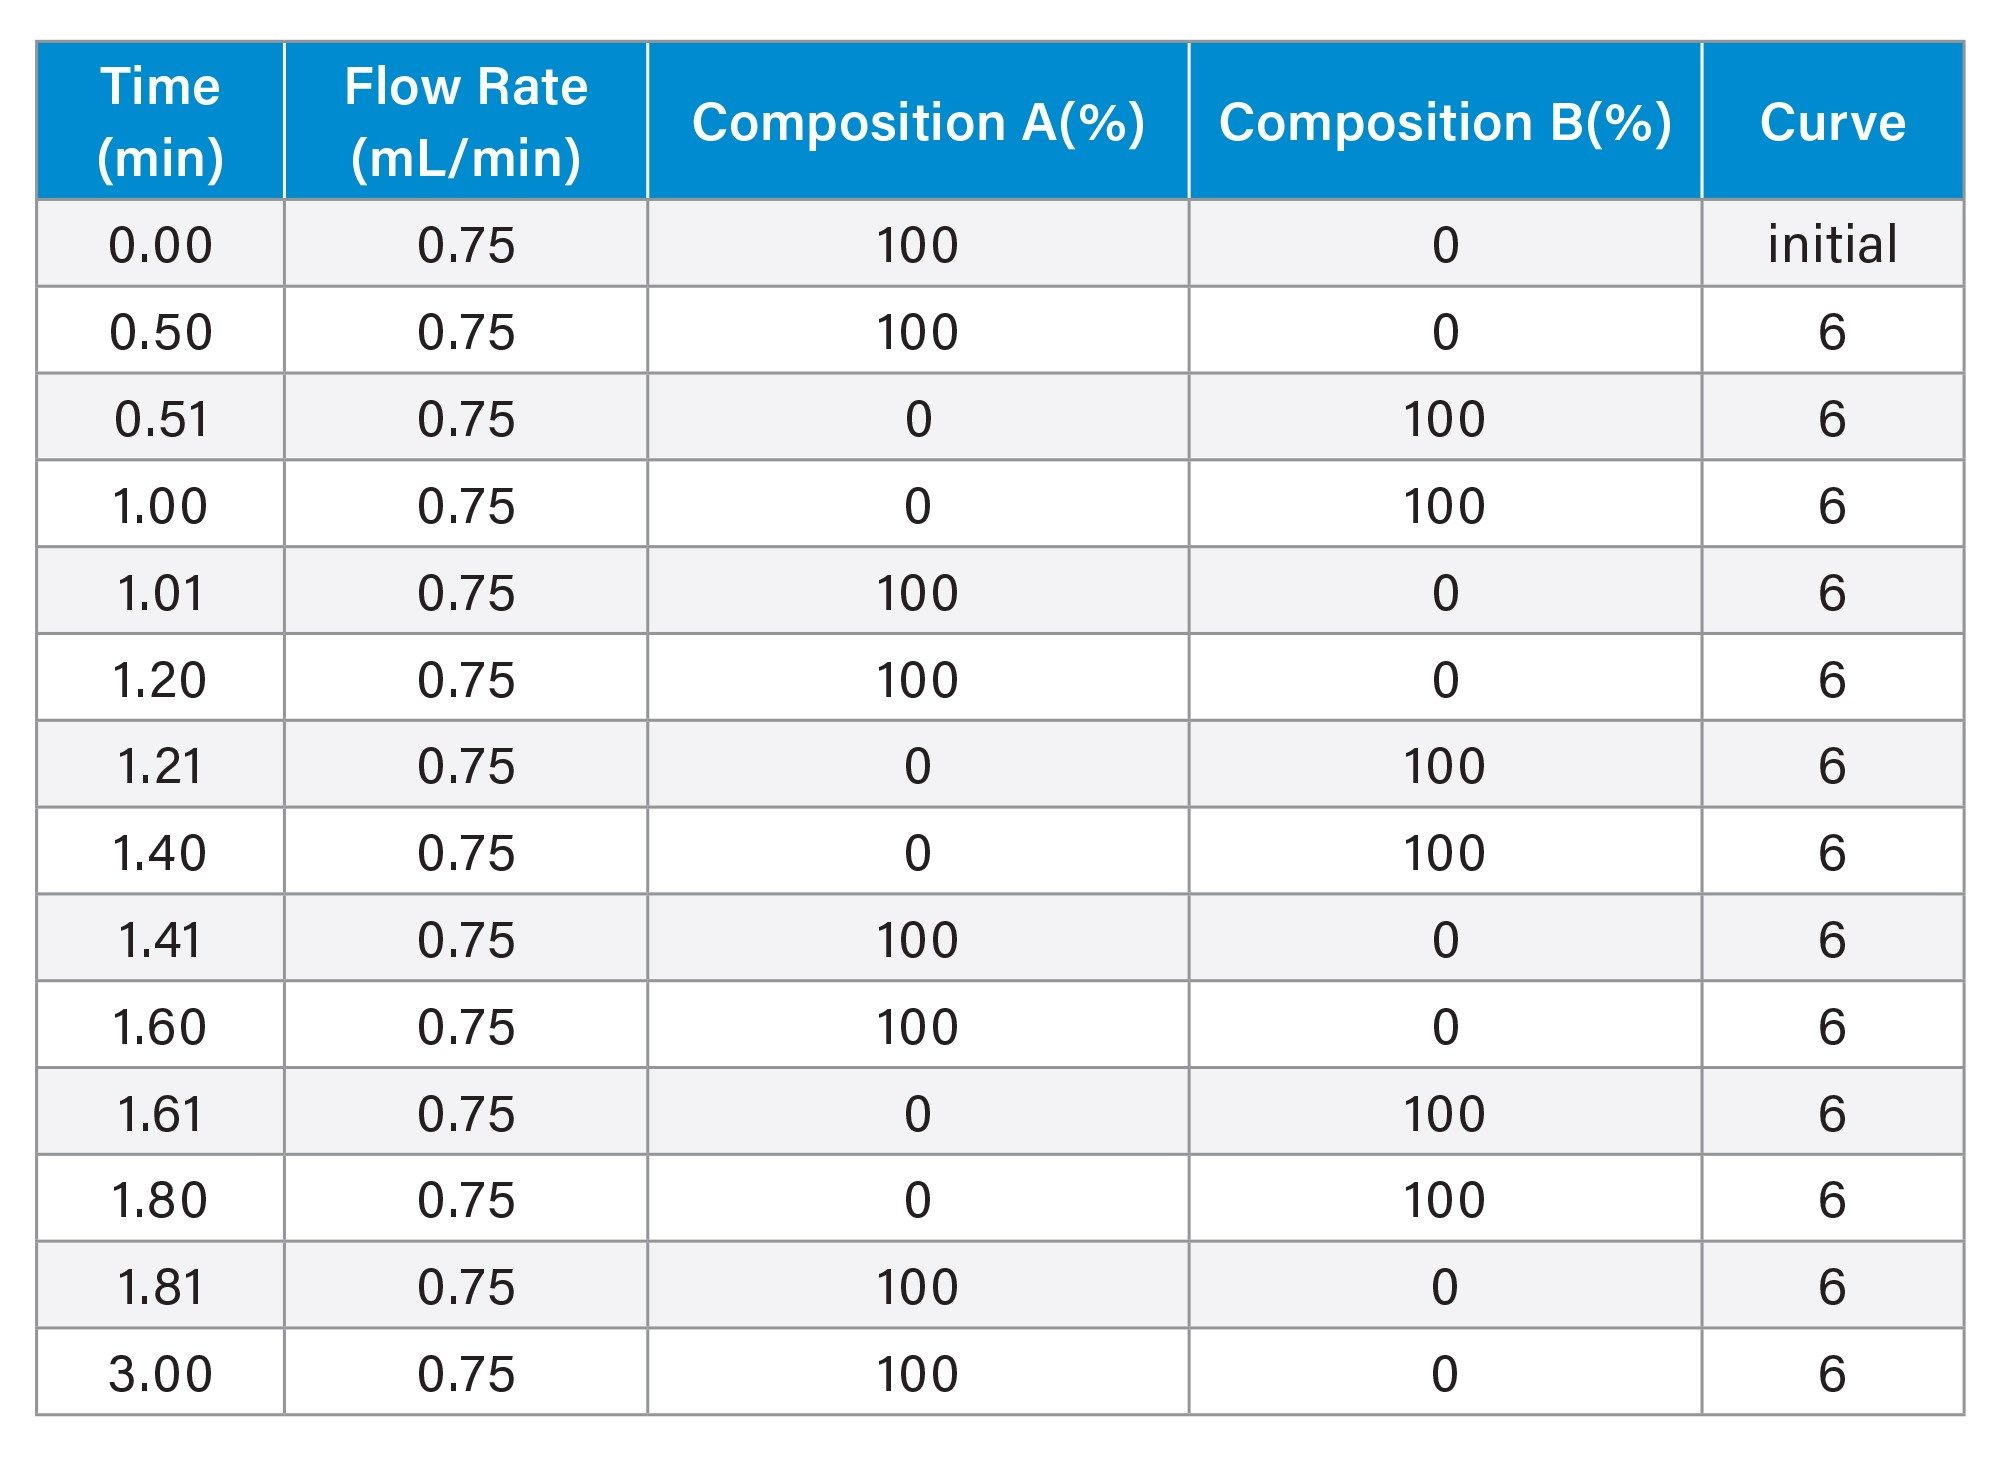
Viable cell density (VCD) was measured using a BioProfile® FLEX2 (Nova Biomedical) via automated trypan blue exclusion. Antibody titer measurements were performed on an ACQUITY™ Premier BSM LC-UV System using a Waters BioResolve Protein A Affinity Column (MaxPeak™ Premier, 2.1 × 20 mm). Key chromatographic parameters are summarized in Table 1, and the gradient profile is listed in Table 2. Clarified cell culture supernatants were obtained by centrifugation at 500 × g for 5 minutes and filtration through 0.2 µm membranes prior to analysis. Each sample was analyzed in triplicate. The use of small-particle Protein A media and MaxPeak Premier High Performance Surfaces (HPS) Technology has been shown to improve sensitivity and reproducibility for low-titer mAb measurements.14
Specific productivity (qP) was calculated using the formula:
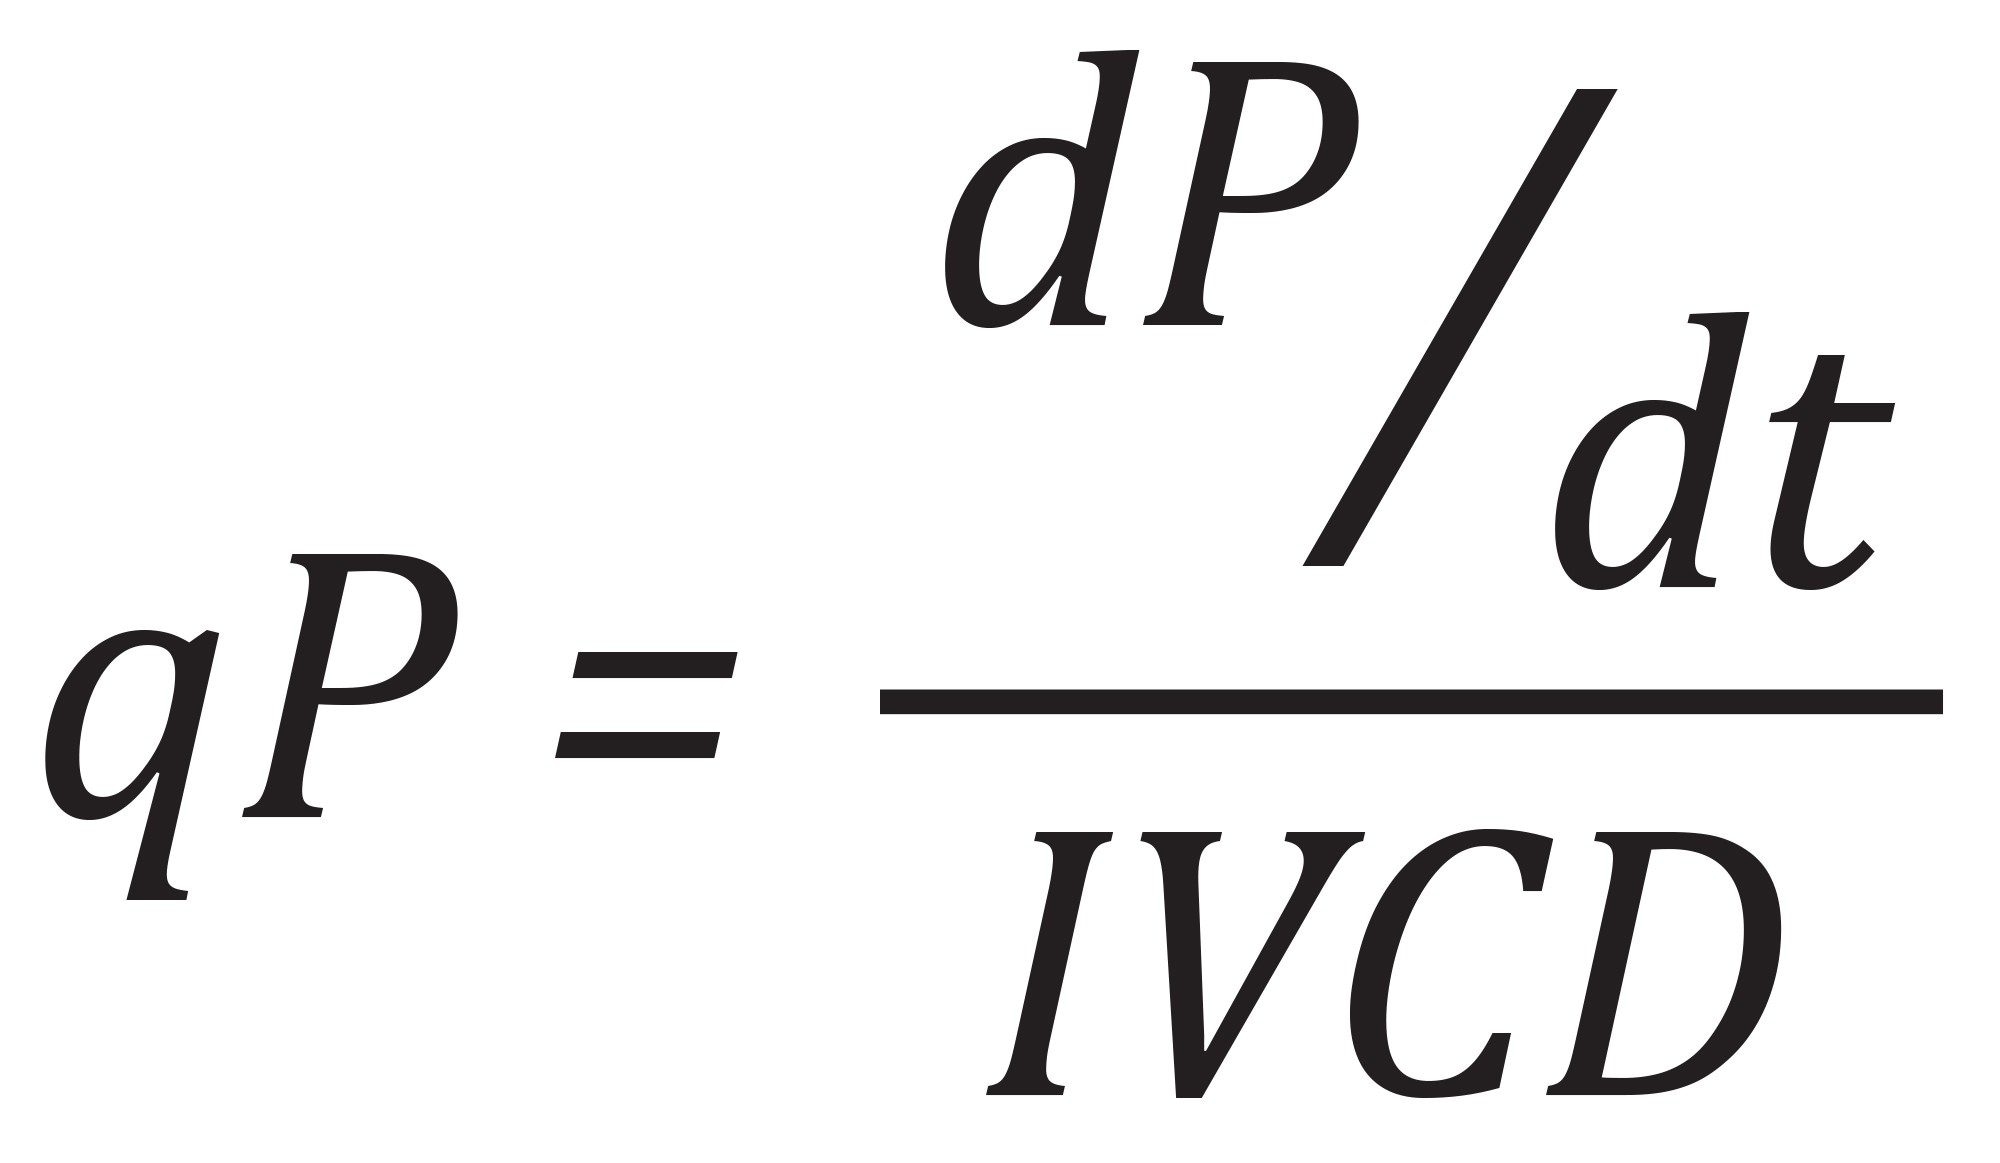
where dP/dt is the change in titer over the culture interval and the integrated viable cell density (IVCD) is calculated using the formula:
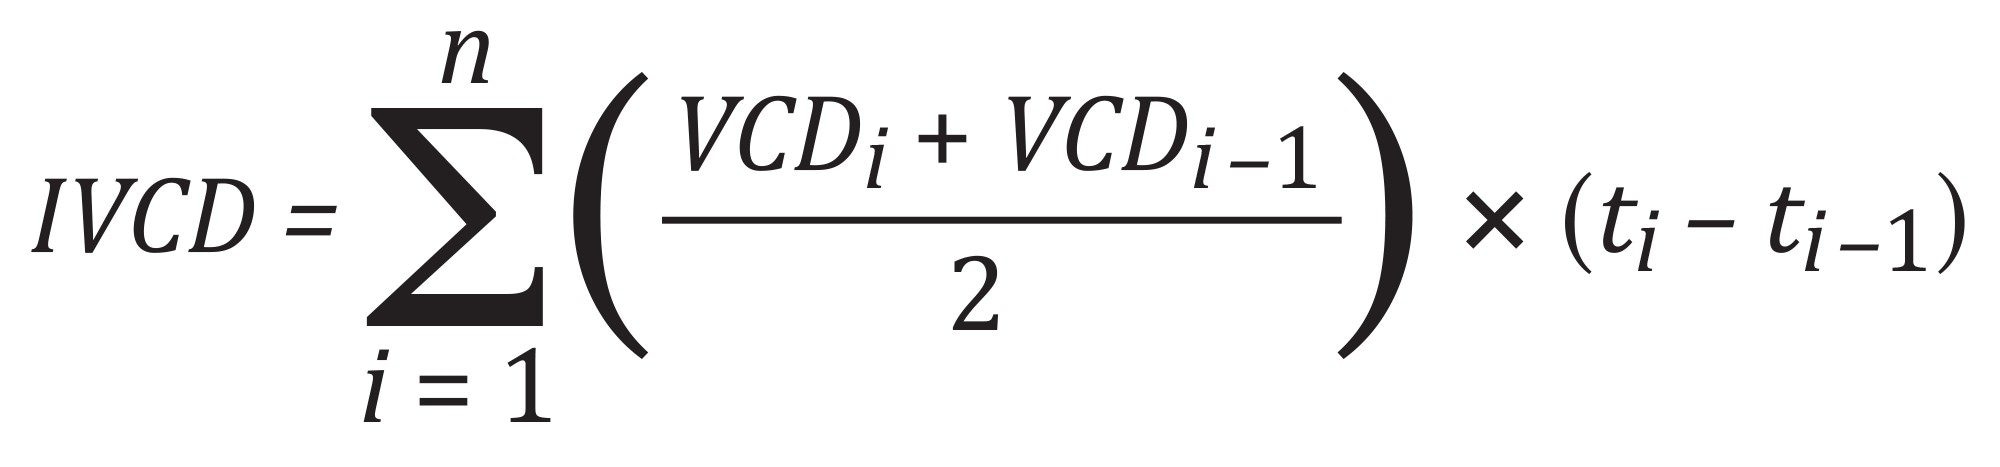
in which t denotes the day when VCD was measured.
Table 1. UPLC™ Method Conditions
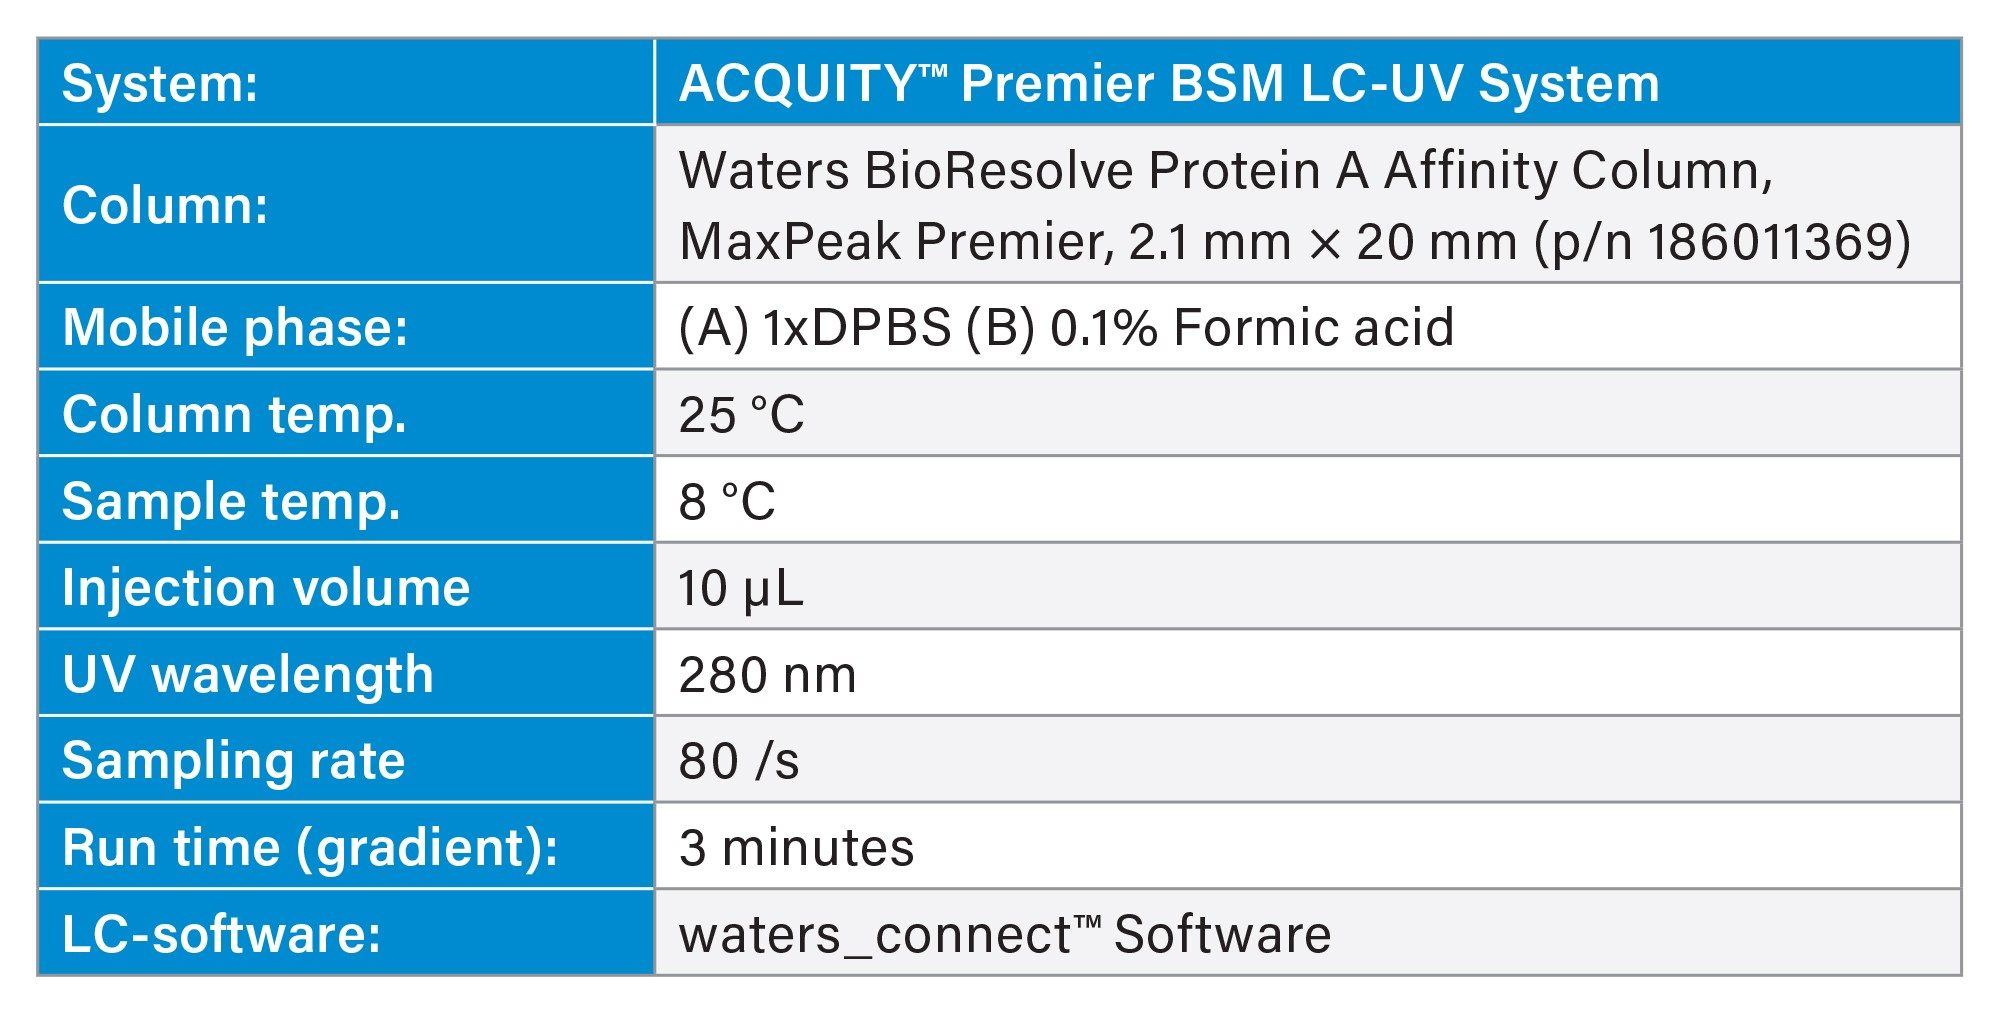
Table 2. Gradient table
Results and Discussion
Promoter Competition Drives Elevated Copy Number
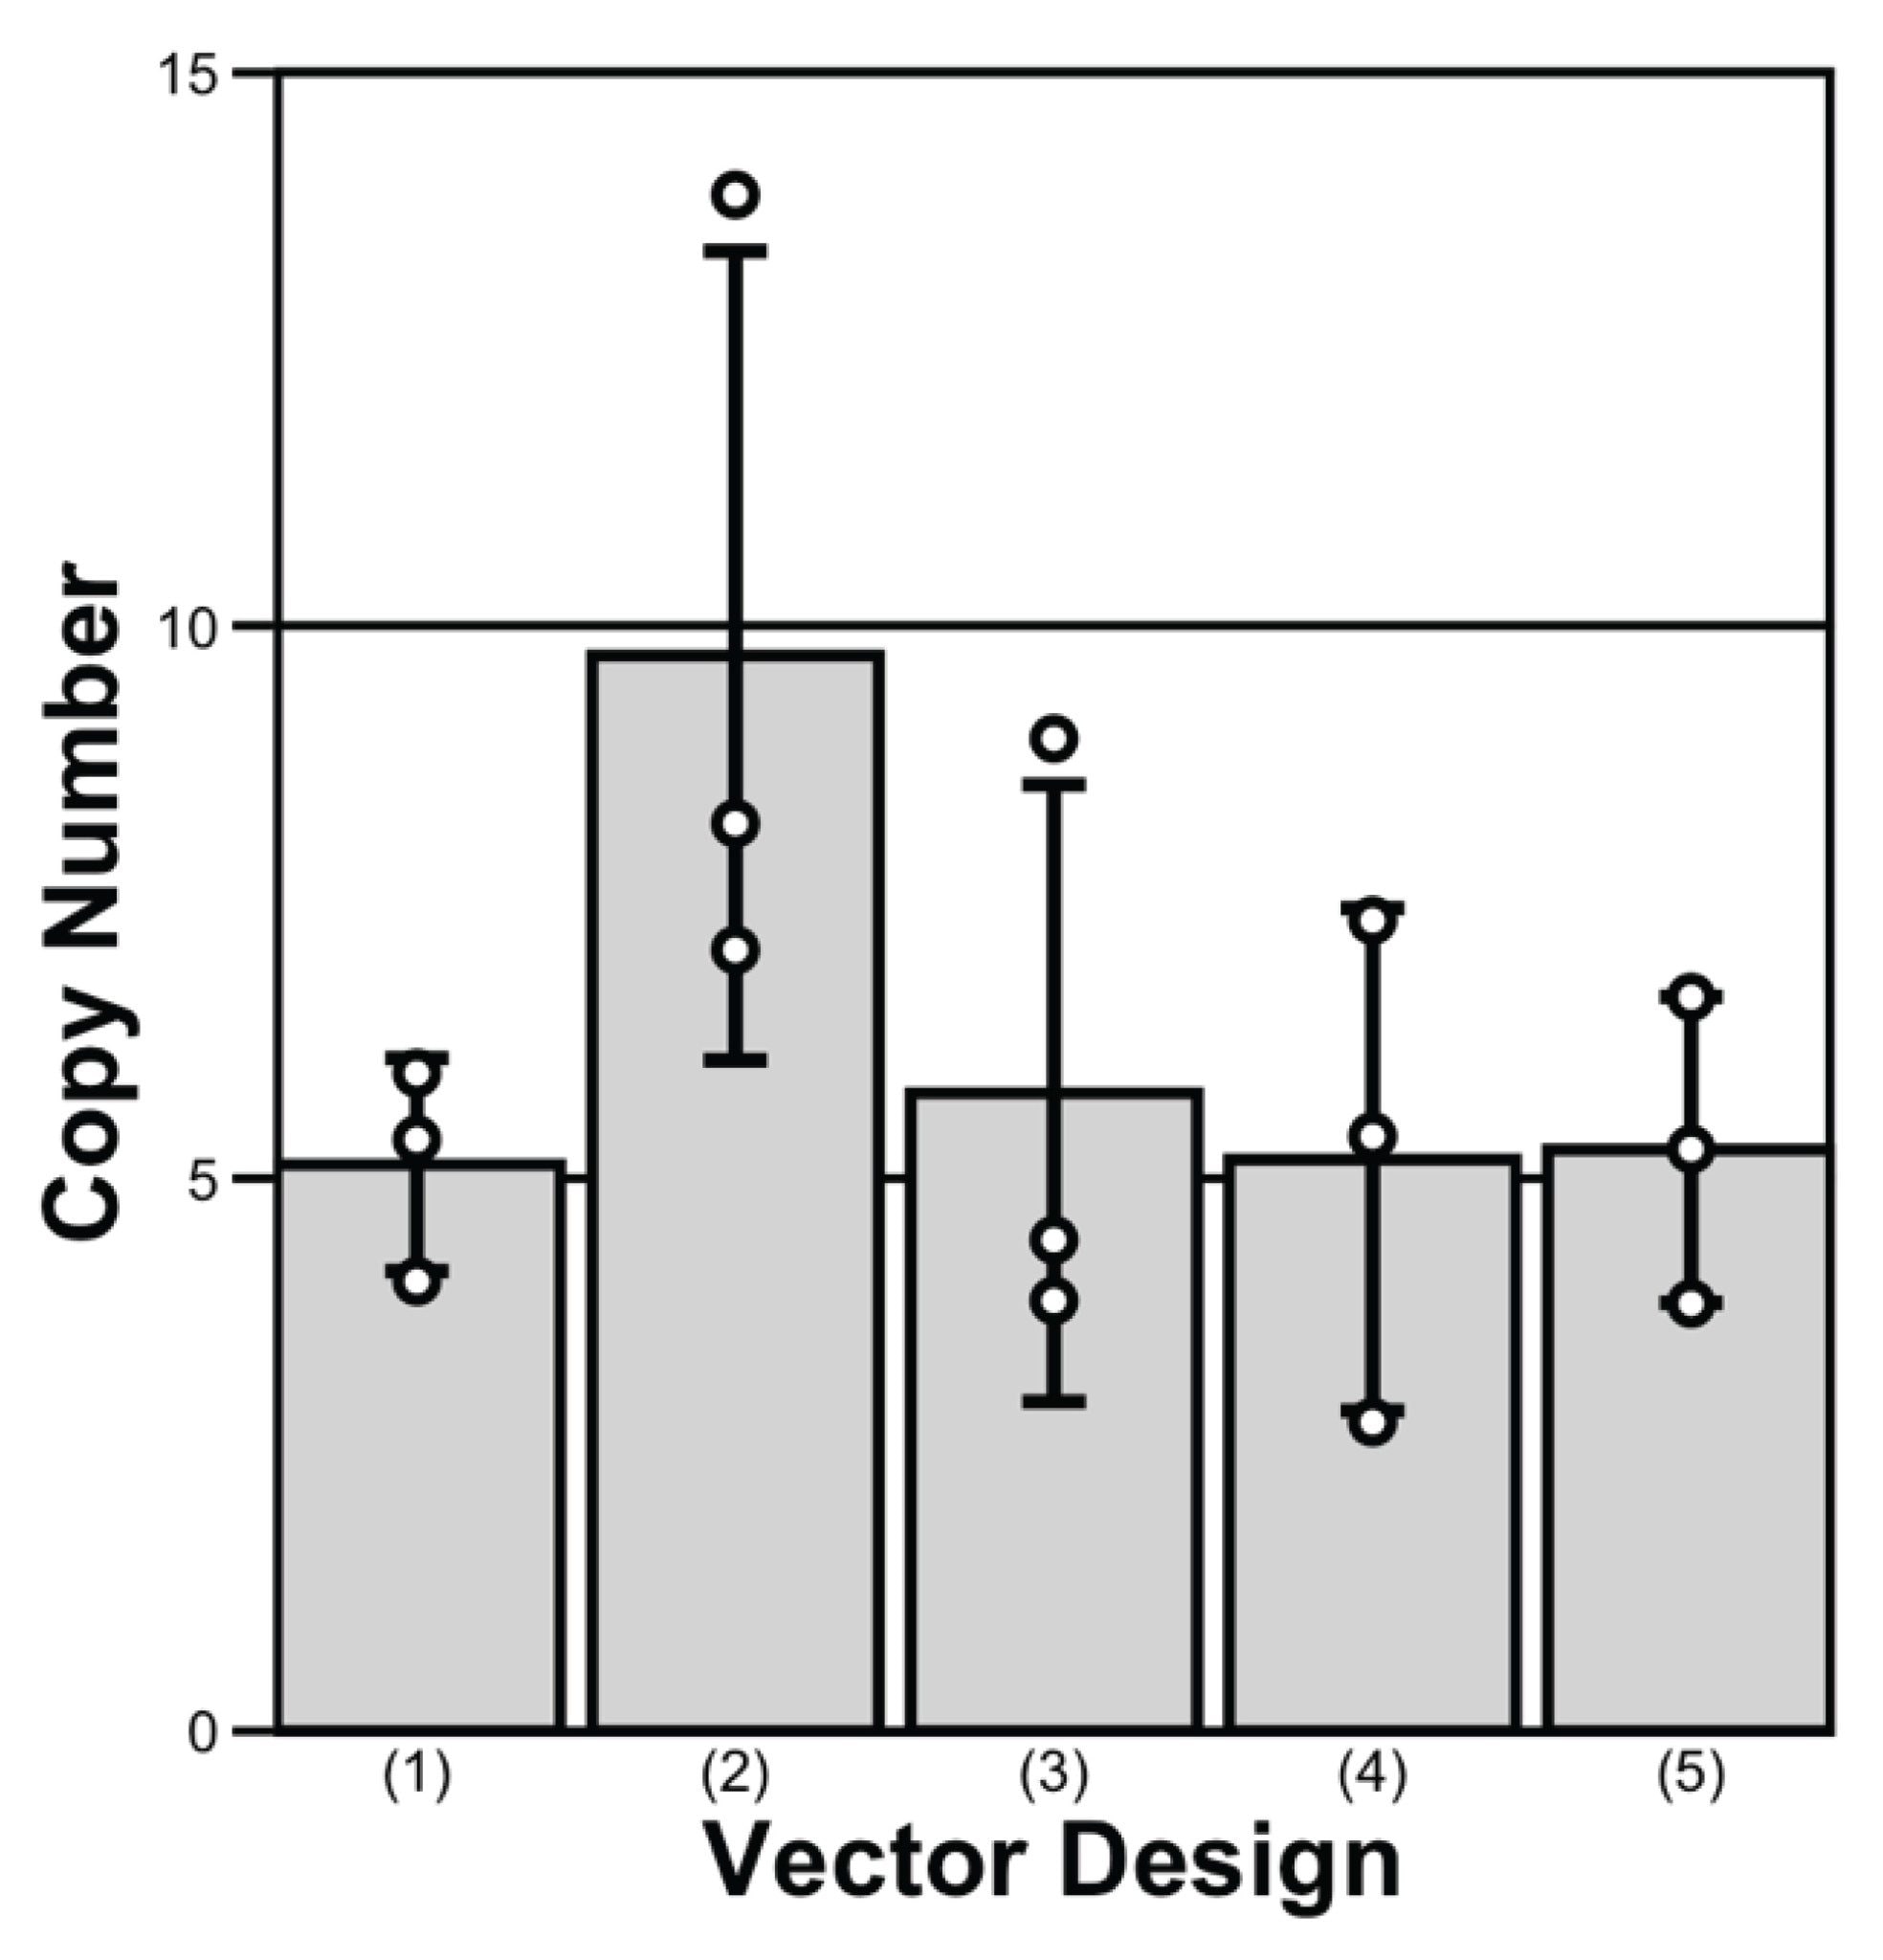
In terms of transgene copy number, the five plasmid designs followed the trend 2 > 3 > 4 ≈ 1 ≈ 5 (Figure 2). Design 2 produced cell pools with nearly twice as many copies as the other constructs. Although its GS cassette was not located at the most downstream position, the proximity of two strong promoters likely attenuated transcription of GS driven by the weaker SV40 promoter. As a result, reduced GS expression increased effective selection stringency and led to greater amplification of the NISTmAb transposon during selection. These findings are consistent with previous reports showing that controlled GS attenuation can increase selection pressure and favor high-producing CHO cells without compromising viability.4,5,16
Vector Architecture and GS Regulation Determine Antibody Titers
Figures 3A and 3B show the overlaid Protein A TUV chromatograms of cNISTmAb from day 3 and day 9 culture samples, respectively, derived from the five plasmid constructs. Titers were quantified using an external calibration curve (Figure 3C) generated with NISTmAb reference standards spanning 0.005–1 mg/mL, demonstrating excellent linearity (R² = 0.9897) and a detection limit of approximately 0.005 mg/mL. The antibody concentrations are on the order of ~10 µg/mL for day 3 samples, reflecting the low expression typically observed during early cell line development when media, feeding, and expression stability are not yet optimized.10 As a result, high analytical sensitivity is essential for accurate quantification. The Waters BioResolve Protein A Affinity Column, incorporating small-particle and MaxPeak Premier Technology, provided improved peak profiles and signal-to-noise performance, enabling reproducible low-titer quantification and consistent detection under early-stage development conditions.14
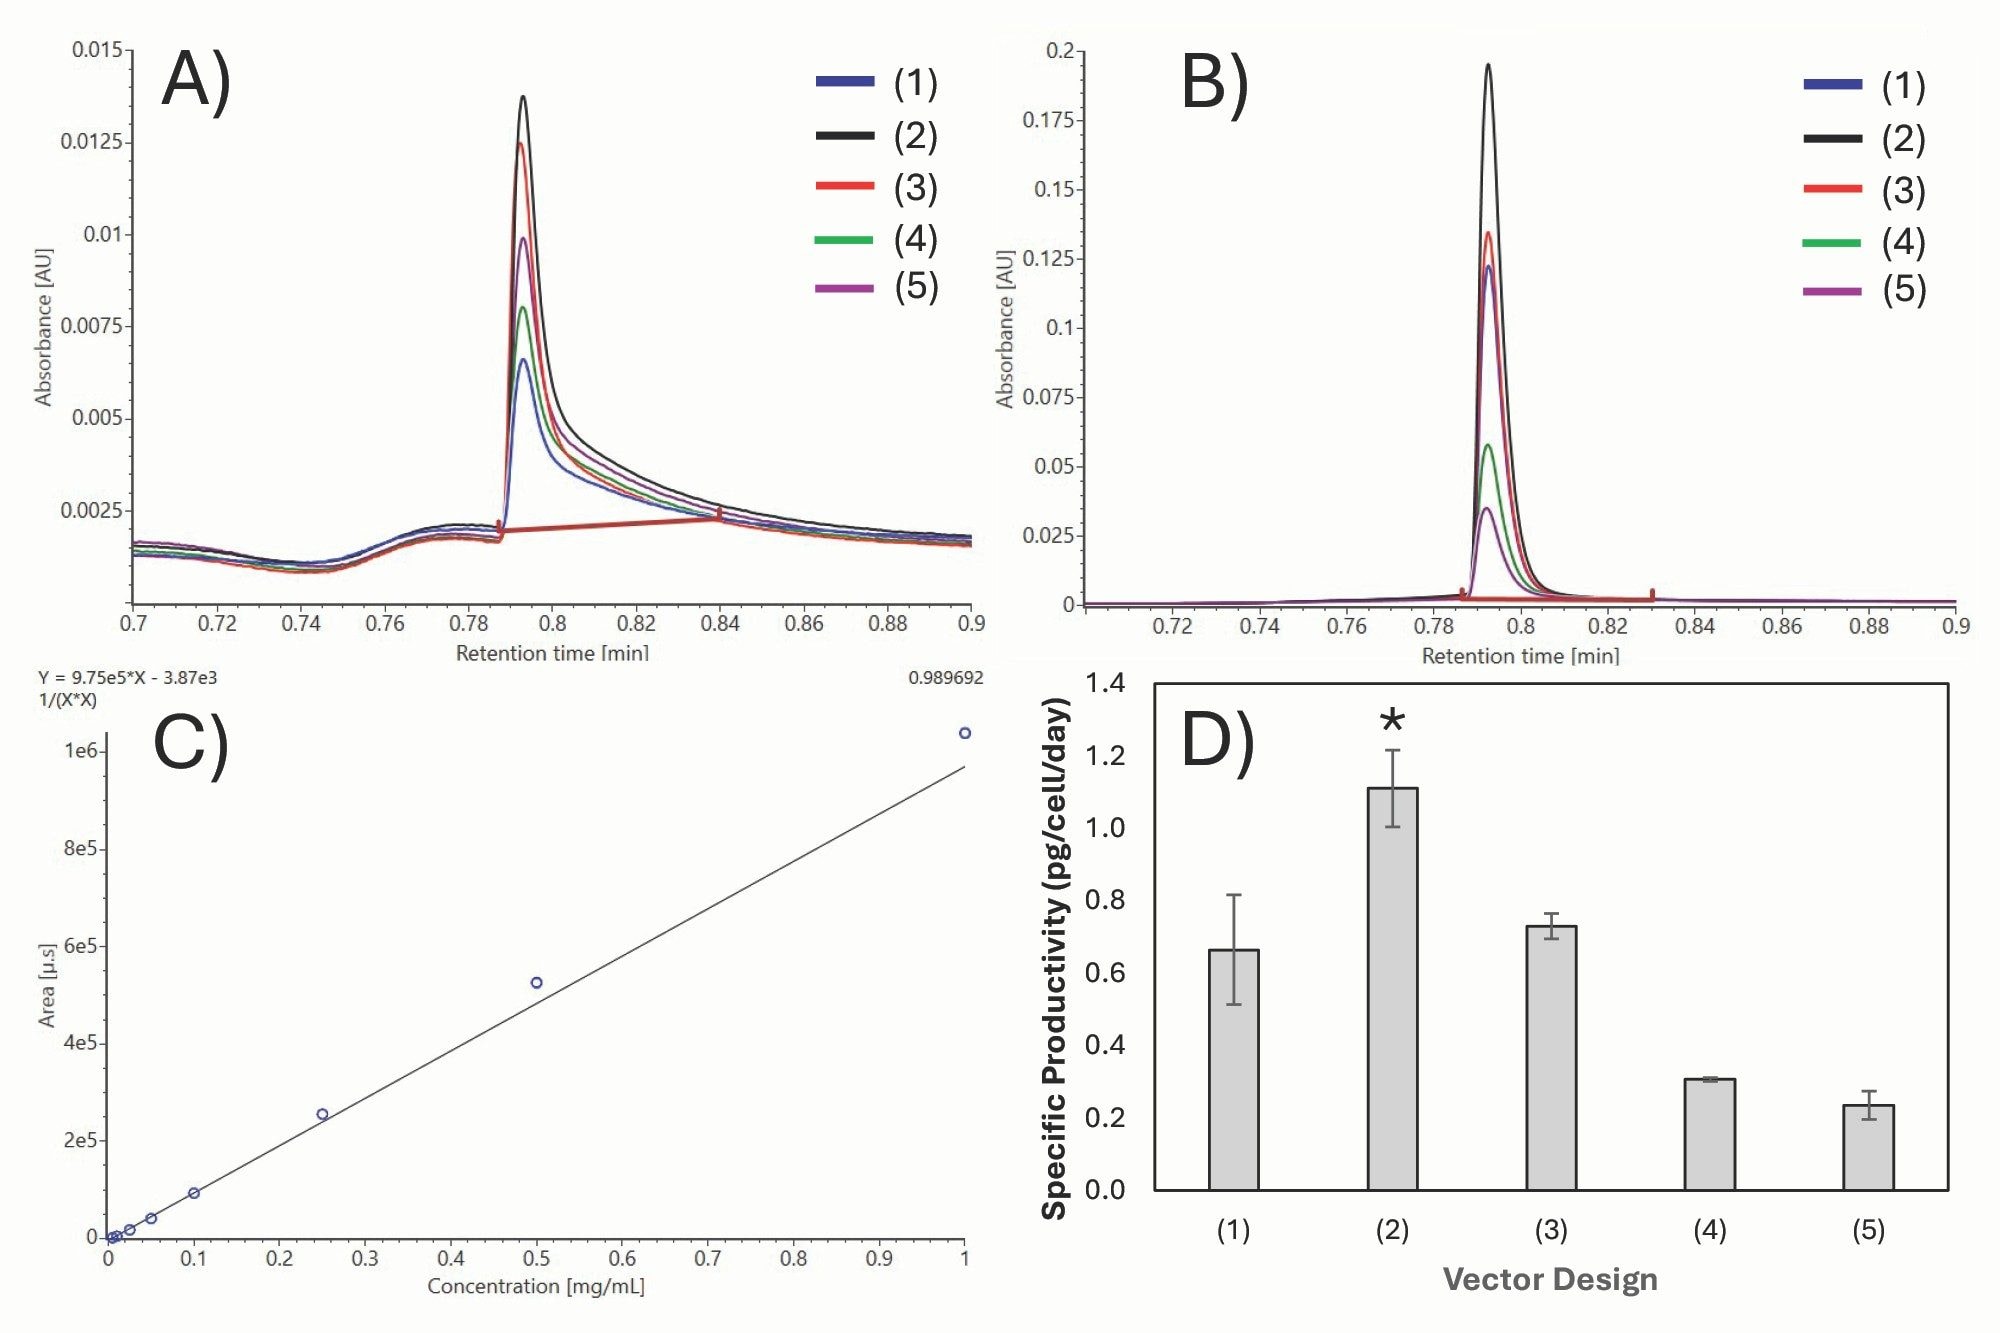
Figure 3D shows the qP values on the final culture day for samples derived from the five plasmid constructs. Antibody expression followed the trend 2 > 3 > 1 > 4 > 5, underscoring the concerted impact of promoter arrangement and GS regulation on productivity. Design 2, with an SV40-driven GS cassette positioned between the antibody genes, achieved the highest qP by balancing selection strength and viability. Among plasmid designs where GS was expressed from an SV40 promoter, the consistent qP observed in Design 2 pools suggests that moderate GS attenuation increases gene amplification and qP. These findings are consistent with previous reports showing that attenuation of the GS selection marker increases selection stringency and enriches for high-producing, stable CHO cell lines under GS selection.4,5,8
In contrast to Design 2, Design 3, with GS placed downstream, showed modest positional attenuation, resulting in slightly lower copy number and qP. Design 1, with GS upstream, likely maintained higher GS activity that weakened selection, resulting in less transgene amplification and lower qP. Designs 4 and 5, which used an IRES for GS translation, had similar NISTmAb transposon copy numbers compared to Designs 1 and 3 but exhibited the lowest qP. The reduced qP likely reflects attenuated expression of the linked light or heavy chain due to increased transcript length and/or competition for translational machinery, effects that have been reported for bicistronic IRES-based expression systems.17,18 As a result, pools transfected with plasmids 4 and 5 may experience less stable transcripts and/or inefficient translation of one antibody chain. Additional studies will be required to confirm the specific mechanisms by which IRES elements impact expression in this context. The overall trend is consistent with prior observations that GS selection strength and expression format are critical determinants of cell line performance.4,5,8
Overall, these results demonstrate that moderate GS attenuation, achieved through deliberate control of cassette positioning and mode of GS expression, provides an optimal balance between productivity, selection pressure, and expression consistency. The systematic evaluation of promoter competition, gene order, and translation strategy illustrates how rational vector design can enhance cell line development efforts. Together, these findings establish a framework for accelerating the development of stable, high-titer CHO cell lines for biotherapeutic manufacturing.3,4,5,8,10
Conclusion
This study demonstrates that controlled attenuation of GS expression through promoter positioning can markedly enhance monoclonal antibody productivity in CHO cells. The optimized plasmid construct (Design 2), comprising a weak SV40-driven GS cassette positioned between two strong antibody promoters, achieved the highest copy number and qP by balancing selection pressure and cell viability. Moderate GS attenuation promoted efficient and consistent expression, whereas use of an IRES to facilitate GS-linked selection resulted in less productive CHO pools.4,5,8 CHO cell productivity can be further improved by appropriately tuning GS selection stringency, including the use of attenuated promoters and small-molecule inhibitors such as MSX.⁴˒⁵ Supported by the enhanced detection sensitivity of the Waters BioResolve Protein A Affinity Column14, this approach provides a practical framework for accelerating the development of stable, high-titer CHO cell lines for biotherapeutic production.
References
- Walsh, G.; Walsh, E. Biopharmaceutical Benchmarks 2022. Nat. Biotechnol. 2022, 40 (12), 1722–1760.
- Biopharma-reporter.com. Bioprocessing Survey Report: Is the CHO CHO Train Slowing Down? https://www.biopharma-reporter.com/Article/2017/11/03/Bioprocessing-survey-report-Is-the-CHO-CHO-train-slowing-down (accessed 2023-11-28).
- Huang, Y.-M.; Hu, W.; Rustandi, E.; Chang, K.; Yusuf-Makagiansar, H.; Ryll, T. Maximizing Productivity of CHO Cell–Based Fed-Batch Culture Using Chemically Defined Media Conditions and Typical Manufacturing Equipment. Biotechnol. Prog. 2010, 26 (5), 1400–1410.
- Sacco, S. A.; Tuckowski, A. M.; Trenary, I.; Kraft, L.; Betenbaugh, M. J.; Young, J. D.; Smith, K. D. Attenuation of Glutamine Synthetase Selection Marker Improves Product Titer and Reduces Glutamine Overflow in Chinese Hamster Ovary Cells. Biotechnol. Bioeng. 2022, 119 (7), 1712–1727.
- Lin, P.-C.; Chan, K. F.; Kiess, I. A.; Tan, J.; Shahreel, W.; Wong, S.-Y.; Song, Z. Attenuated Glutamine Synthetase as a Selection Marker in CHO Cells to Efficiently Isolate Highly Productive Stable Cells for the Production of Antibodies and Other Biologics. mAbs 2019, 11 (5), 965–976.
- Szkodny, A. C.; Lee, K. H. Evaluation of “Difficult-to-Express” Monoclonal Antibodies in a CHO-Based Hybrid Site-Specific Integration System Under Industrially Relevant Conditions. Biotechnol. J. 2025, 20 (8), e70102.
- Hilliard, W.; Lee, K. H. A Compendium of Stable Hotspots in the CHO Genome. Biotechnol. Bioeng. 2023, 120 (8), 2133–2143.
- Browne, S. M.; Al-Rubeai, M. Selection Methods for High-Producing Mammalian Cell Lines. Trends Biotechnol. 2007, 25 (9), 425–432.
- Kelley, B. Industrialization of mAb Production Technology: The Bioprocessing Industry at a Crossroads. mAbs 2020, 12 (1), 1703533.
- Kunert, R.; Reinhart, D. Advances in Recombinant Antibody Manufacturing. Appl. Microbiol. Biotechnol. 2016, 100 (8), 3451–3461.
- Zydney, A. L. Continuous Downstream Processing for High-Value Biological Products: A Review. Biotechnol. Bioeng. 2016, 113 (3), 465–475.
- Crowther, J. R. The ELISA Guidebook; Humana Press: Totowa, NJ, 2001.
- Sun, T.; He, J.; Wang, Y.; Zhang, L.; Wang, H.; Zhao, L. High-Throughput Detection of Antibody Self-Interaction by Bio-Layer Interferometry. mAbs 2013, 5 (6), 802–813.
- Koza, S.M., Shiner, S., and Lauber, M.A. Lowering Quantitation Limits for mAb Titer Measurements Using Small-Volume 3.5 µm Particle-Size Protein A Affinity Columns. Waters Application Note. 720008775. Waters Corporation. May 2025.
- Dahodwala, H.; Hodzic, I.; Slesarev, A.; et al. Development and Characterization of the NISTCHO Reference Cell Line. Biotechnol. J. 2025, 20 (5), e70012.
- Wei, M.; Wu, W.; Han, X.; et al. Progress of Transposon Vector Systems for Production of Recombinant Proteins in Mammalian Cells. Front. Bioeng. Biotechnol. 2022, 10, 879222.
- Mizuguchi, H.; Xu, Z.; Ishii-Watabe, A.; Uchida, E.; Hayakawa, T. IRES-Dependent Second Gene Expression Is Significantly Lower than Cap-Dependent First Gene Expression in a Bicistronic Vector. Mol. Ther. 2000, 1 (4), 376–382.
- Payne, A. J.; Lee, H.; Jenkins, A. P.; Zhao, J.; Cook, J. R.; Bhattacharya, S.; Bhattacharya, S. Gene Expression in Bicistronic IRES Vectors. Int. J. Biochem. Mol. Biol. 2013, 4 (4), 201–208.
Featured Products
720009240, March 2026