A Highly Stable Biphenyl HPLC Stationary Phase Based on Ethylene-Bridged Hybrid Particles
Gabrielle Zabala, Bonnie Alden, Cheryl Boissel, Thomas H. Walter, Weiqiang Gu, Daniel P. Walsh, Jim Cook
Waters Corporation, United States
Published on April 06, 2026
Abstract
While C18 bonded phases remain the most widely used stationary phases for reversed-phase (RP) high performance liquid chromatography (HPLC), materials offering alternative selectivities are needed for some separations. Of the different retention mechanisms involved in RP separations, one that is not provided by alkyl bonded phases is π–π interaction between the stationary phase and analytes possessing π electrons. Biphenyl stationary phases are designed to provide this interaction. However, one limitation of biphenyl stationary phases is that bonded phase hydrolysis products eluted from the column strongly absorb ultraviolet (UV) light, which can result in distorted baselines when using UV detection. Consequently, it is important that biphenyl stationary phases have excellent hydrolytic stability. A new highly stable trifunctional biphenyl stationary phase based on ethylene-bridged hybrid organic/inorganic particles has been developed. This application note describes the characterization of the pH stability, chromatographic selectivity and batch-to-batch reproducibility of this new stationary phase and compare the results to those for existing C18, phenyl and biphenyl materials.
Benefits
- Alternative selectivity compared to C18 and Phenyl Columns
- Stable over a pH range of 1.5 to 10
- Lower UV-detected column bleed in comparison to biphenyl columns from other vendors
- Excellent batch-to-batch reproducibility
Introduction
In HPLC, C18 stationary phases are the predominant choice for reversed-phase methods due to their broad applicability and robust performance in diverse separation methods.1 However, C18 stationary phases may not always deliver optimal separations across all applications. Biphenyl stationary phases offer an alternative selectivity profile, leveraging π–π interactions between the analyte and the biphenyl groups to facilitate the separation of compounds possessing π electrons.1 This distinct interaction mechanism makes biphenyl stationary phases particularly effective for challenging applications involving aromatic pharmaceuticals, steroids, phenolic compounds, and polycyclic aromatic hydrocarbons (PAHs).2,3
Despite their useful selectivity, commercially available biphenyl columns present notable limitations that can hinder their utility in some analytical methods. A primary drawback when using ultraviolet (UV) detection within the 230–270 nm range with gradient separations is the observation of baseline distortion which is caused by the elution of hydrolysis products containing biphenyl groups (“column bleed”). This poses challenges for method development when using gradient methods with UV detection.
Current commercially available biphenyl columns generally lack stability under strongly acidic (< pH 2) and basic (> pH 8) conditions. To overcome these issues, a new biphenyl stationary phase based on ethylene-bridged hybrid (BEH™) particles that has low UV-detected column bleed, good stability from pH 1.5–10, and excellent batch-to-batch reproducibility has been developed. The columns packed with this stationary phase are the Waters™ Acquity™ Biphenyl and Waters XBridge™ Biphenyl RP Columns with MaxPeak™ Premier Technology. The column hardware uses MaxPeak Premier Technology to mitigate interactions of analytes with metal surfaces.4
Experimental
Accelerated Base Stability Study
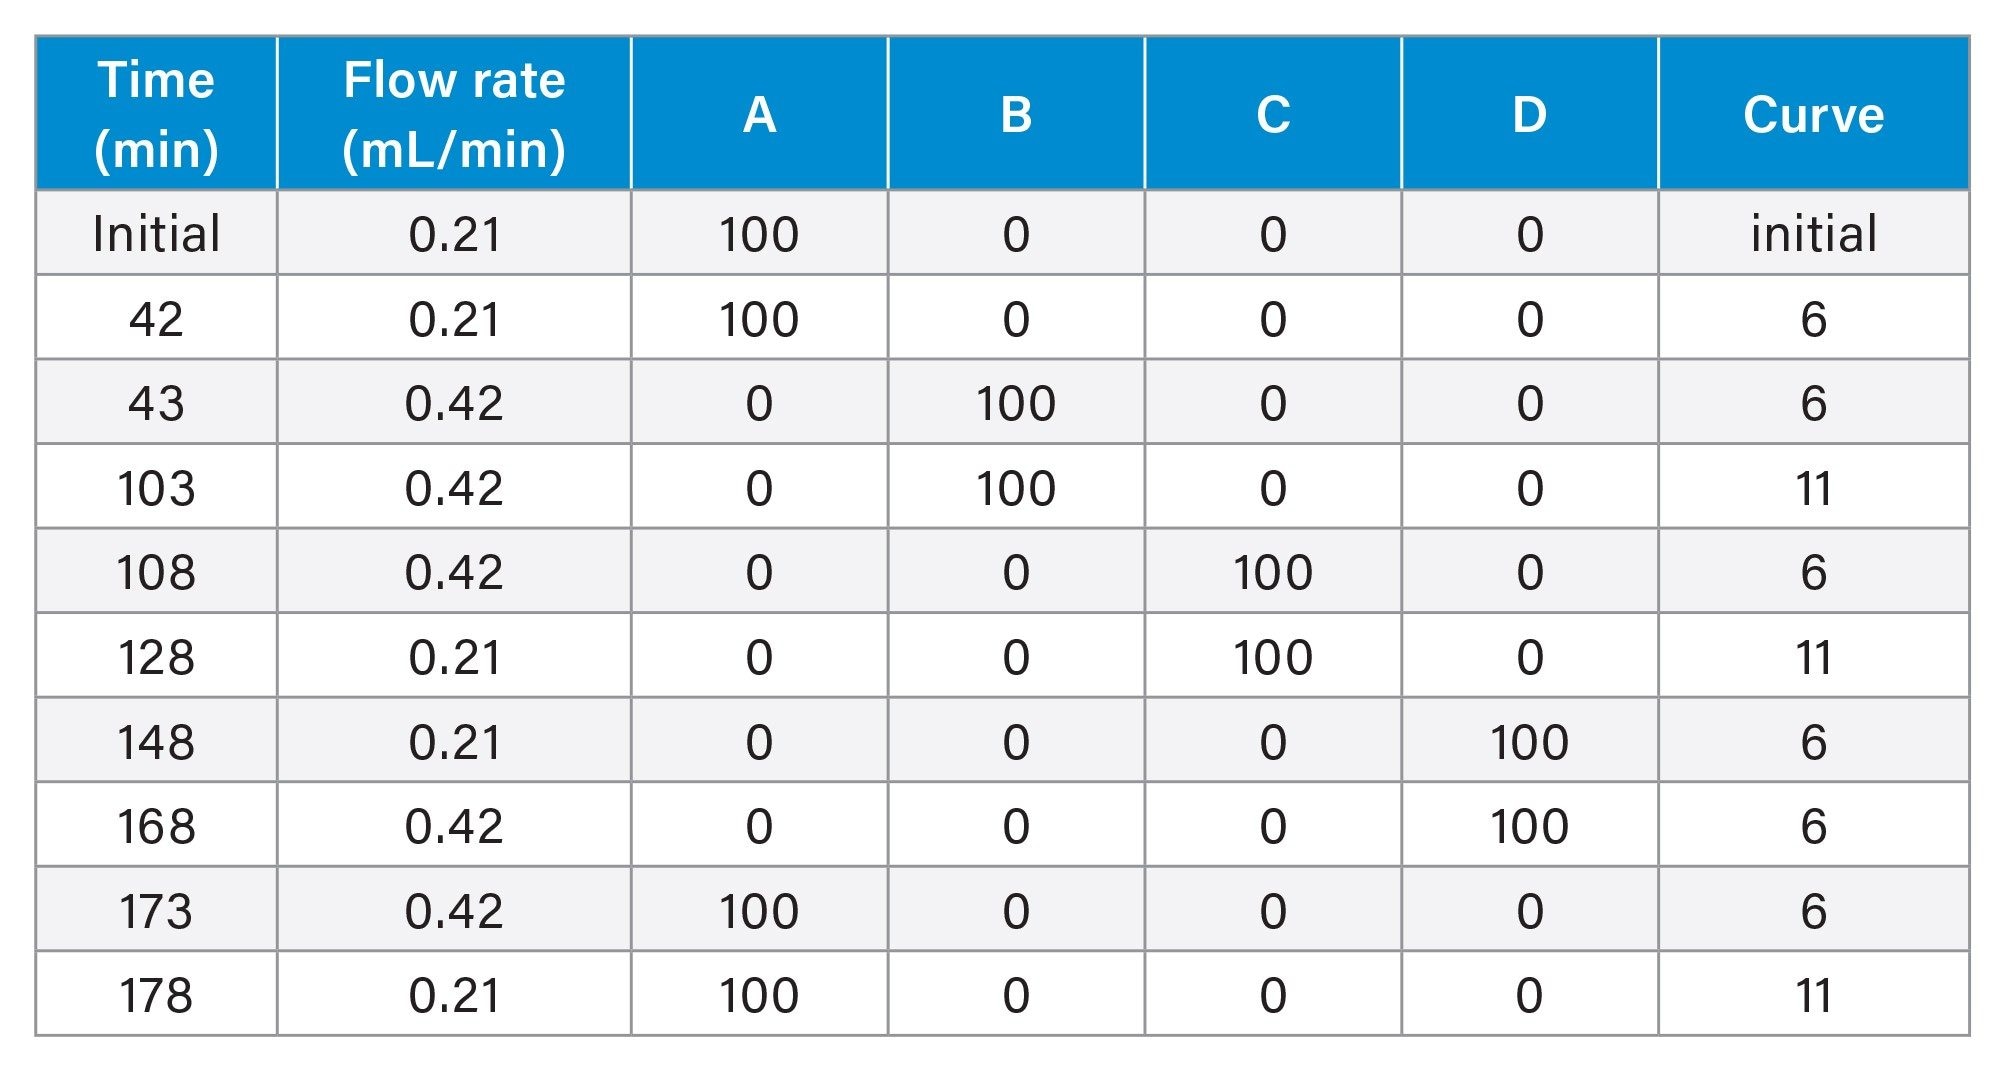
Two sample mixtures were used for this evaluation. The first sample contained 3 µg/mL of uracil, and the second sample contained 3 µg/mL of uracil and 50 µg/mL of butylparaben. The sample diluent used for these mixtures was 30/70 v/v methanol/water. The column was initially equilibrated in 0.1% formic acid in 30/70 v/v methanol/water for 30 minutes. Following equilibration, 2 injections of the first sample and 1 injection of the second sample were performed. The column was then subjected to repeated exposures of 50 mM triethylamine (TEA) buffer at pH 10 with each exposure occurring for 1 hour. After each TEA exposure, the column was washed with 10/90 v/v methanol/water and methanol before repeating the sequence.
|
Instrument: |
ACQUITY UPLC™ H-Class System consisting of a Quaternary Solvent Manager (QSM) with a 100 μL mixer, Sample Manager with Flow-Through Needle (SM-FTN) and a 15 µL needle, a single-channel ACQUITY Column Heater (CH-A) with an Active Preheater (APH), and an ACQUITY UPLC Tunable UV (TUV) Detector installed with a 500 nL analytical flow cell |
|
Data management: |
Empower™ 3.9 Chromatography Data System |
LC Method Conditions
|
Column size: |
2.1 x 50 mm |
|
Column temperature: |
50 °C |
|
Injection volume: |
2.0 µL |
|
Mobile phase: |
Line A – 0.1% formic acid in 30/70 v/v methanol/ water Line B – 50 mM TEA (aq), pH 10 Line C – 10/90 v/v methanol/ water Line D – 100% methanol |
|
UV detection: |
254 nm |
Gradient Table
pH 9 Base Stability Study
The Waters neutrals quality control reference material (QCRM, 186006360, Lot # W01022415) was used as the sample mixture for this study. The sample mixture contains 10 µL/mL of acetone used as V0 marker, 250 µg/mL of naphthalene, and 400 µg/mL of acenaphthene. The sample diluent used was 50/50 v/v acetonitrile/water. The column was equilibrated in 50/50 v/v acetonitrile/20 mM ammonium bicarbonate, pH 9.0 for 25 minutes. Changes in efficiency, retention time and pressure were monitored over the course of 2000 consecutive injections. The run time was 2.00 minutes per injection.
|
Instrument: |
ACQUITY UPLC H-Class System consisting of a QSM with a 100 μL mixer, a SM-FTN with a 15 μL needle, an ACQUITY CM-A and an Auxiliary Column Manager (CM-Aux), and an ACQUITY UPLC PDA Detector installed with a 500 nL analytical flow cell |
|
Data management: |
Empower™ 3.9 Chromatography Data System |
LC Method Conditions
|
Column size: |
2.1 x 50 mm |
|
Column temperature: |
35 °C |
|
Injection volume: |
1.0 µL |
|
Flow rate: |
0.50 mL |
|
Mobile phase: |
50/50 v/v acetonitrile/ 20 mM ammonium bicarbonate (aq) pH 9.0 |
|
UV detection: |
254 nm |
Accelerated Acid Stability Study
A sample containing 25 µg/mL of thiourea, 525 µg/mL of aniline, 50 µg/mL of methylparaben and 300 µg/mL of phenol was used for this study. The sample diluent used was 100% water. A total of 130 injections of the sample were performed using an acetonitrile gradient with an aqueous mobile phase containing 0.5% trifluoroacetic acid (TFA). The column was then equilibrated under initial conditions for 30 minutes. Two additional injections of the test mixture were carried out, resulting in a total of 132 injections.
|
Instrument: |
ACQUITY UPLC™ Classic System consisting of a Binary Solvent Manager (BSM) with a 50 μL mixer, Sample Manager with a 2 µL Fixed-Loop needle (SM-FL) with a 30 µL needle, an ACQUITY High Temperature Column Heater and an ACQUITY UPLC TUV Detector installed with a 500 nL analytical flow cell |
|
Data management: |
Empower 3 Chromatography Data System |
LC Method Conditions
|
Column size: |
2.1 x 50 mm |
|
Column temperature: |
60 °C |
|
Injection volume: |
1.0 µL |
|
Mobile phase: |
Line A – 0.5% TFA in 100% water Line B – 100% acetonitrile |
|
UV detection: |
254 nm |
Gradient Table
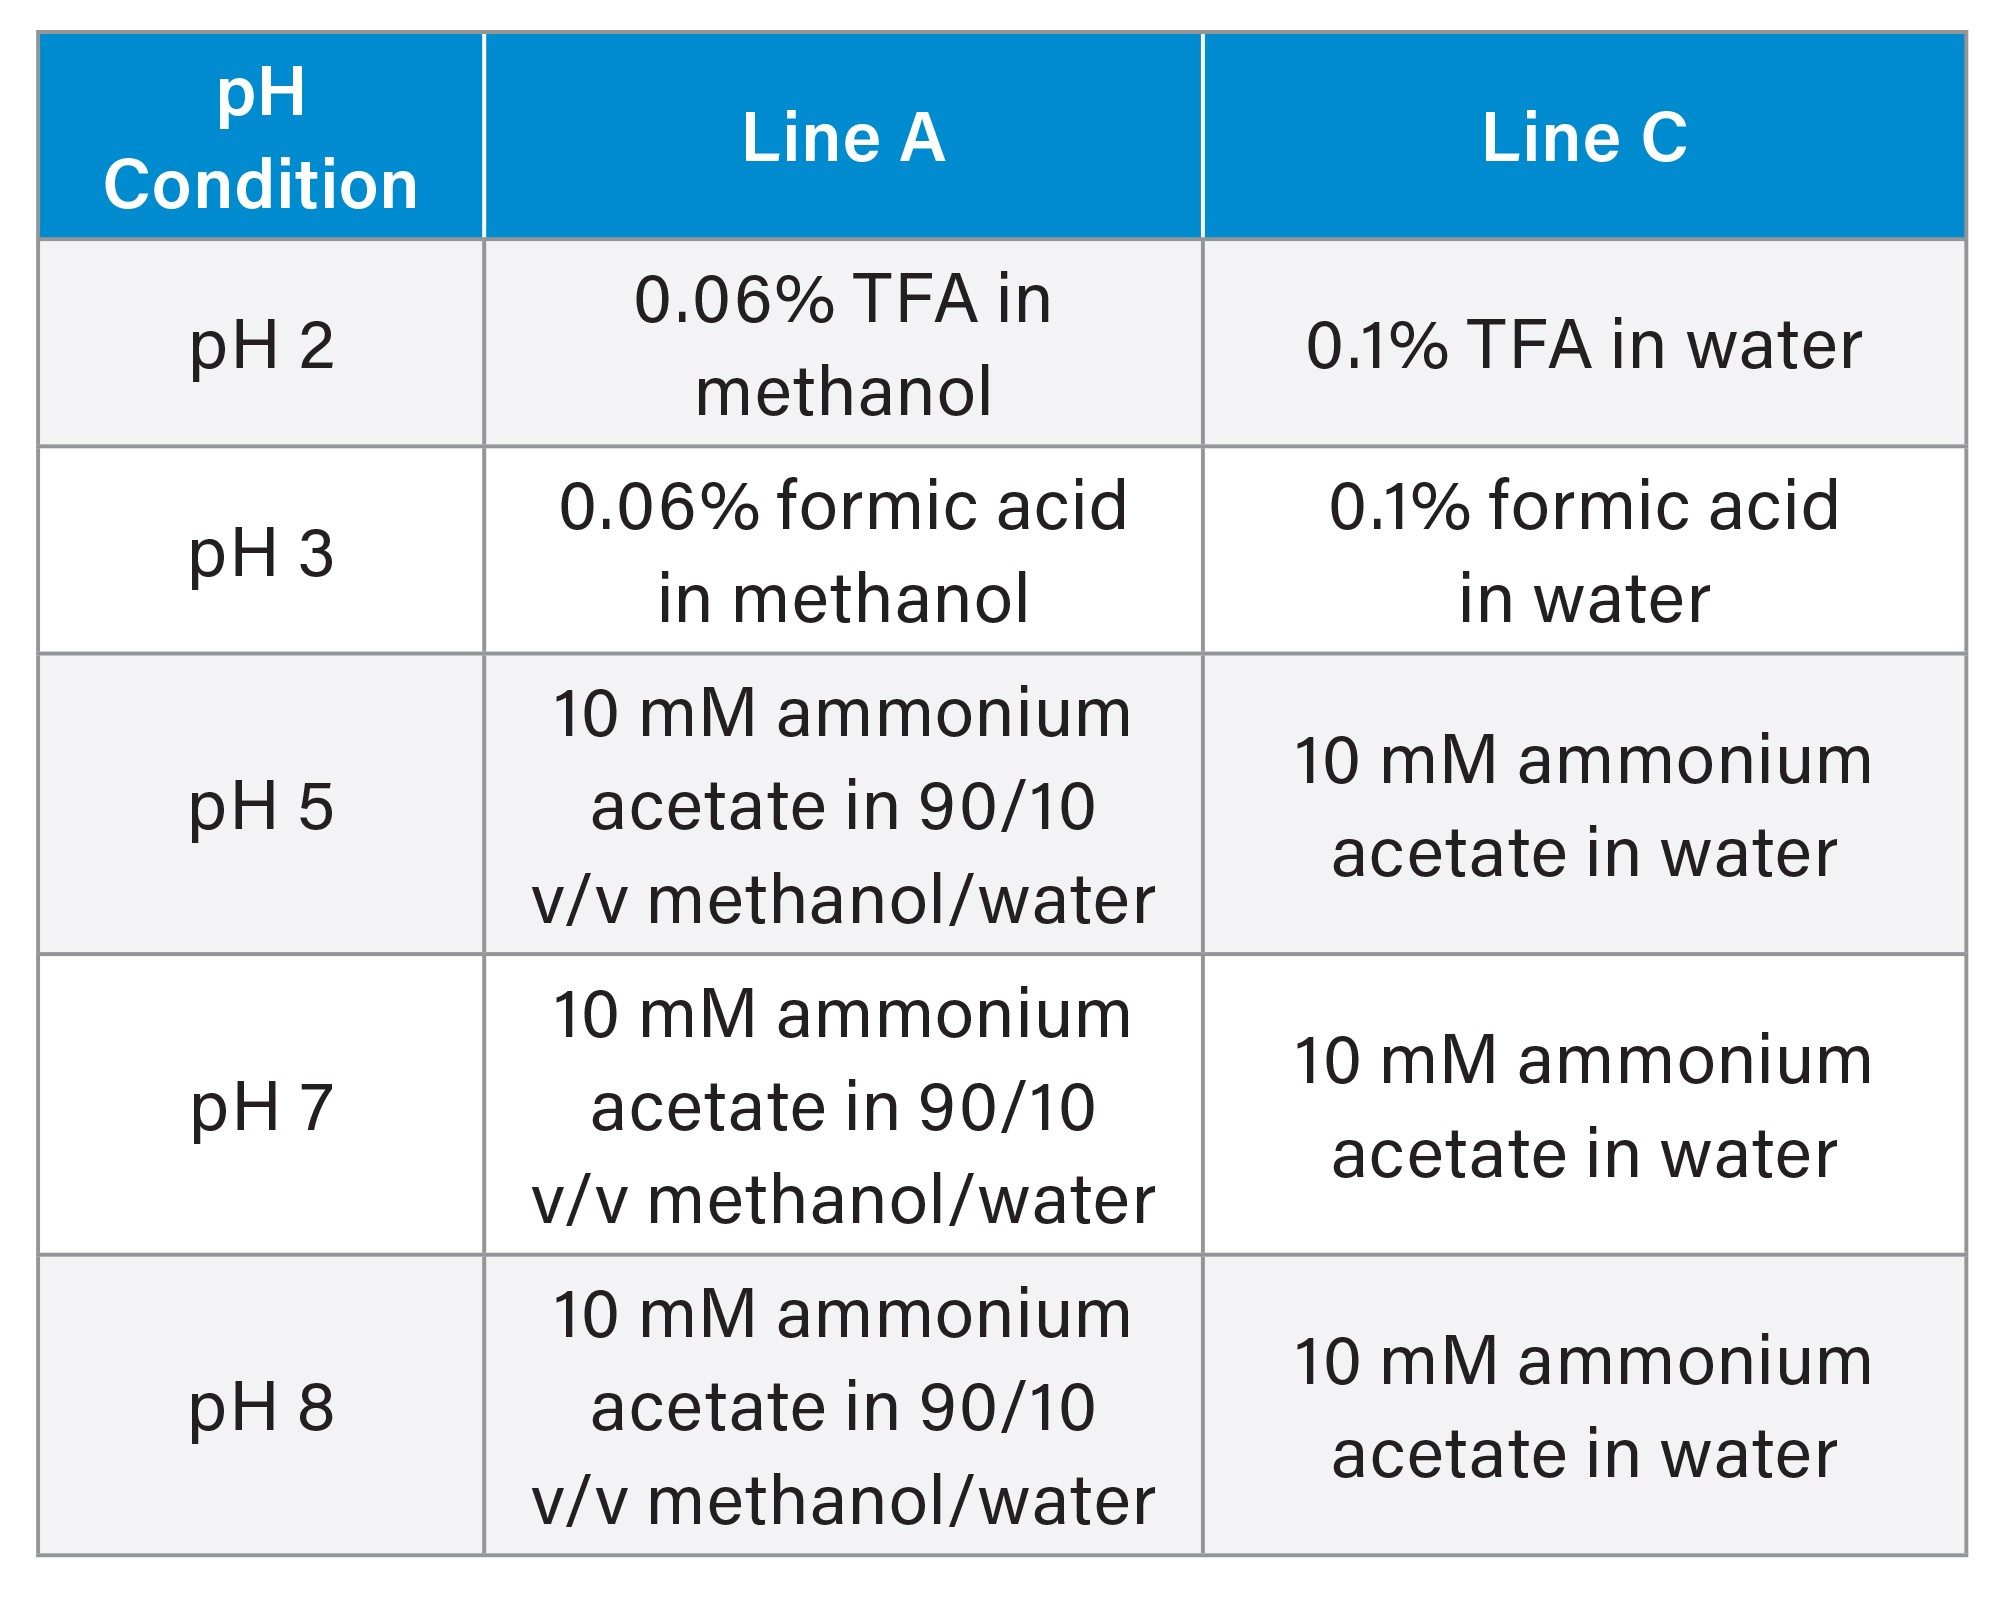
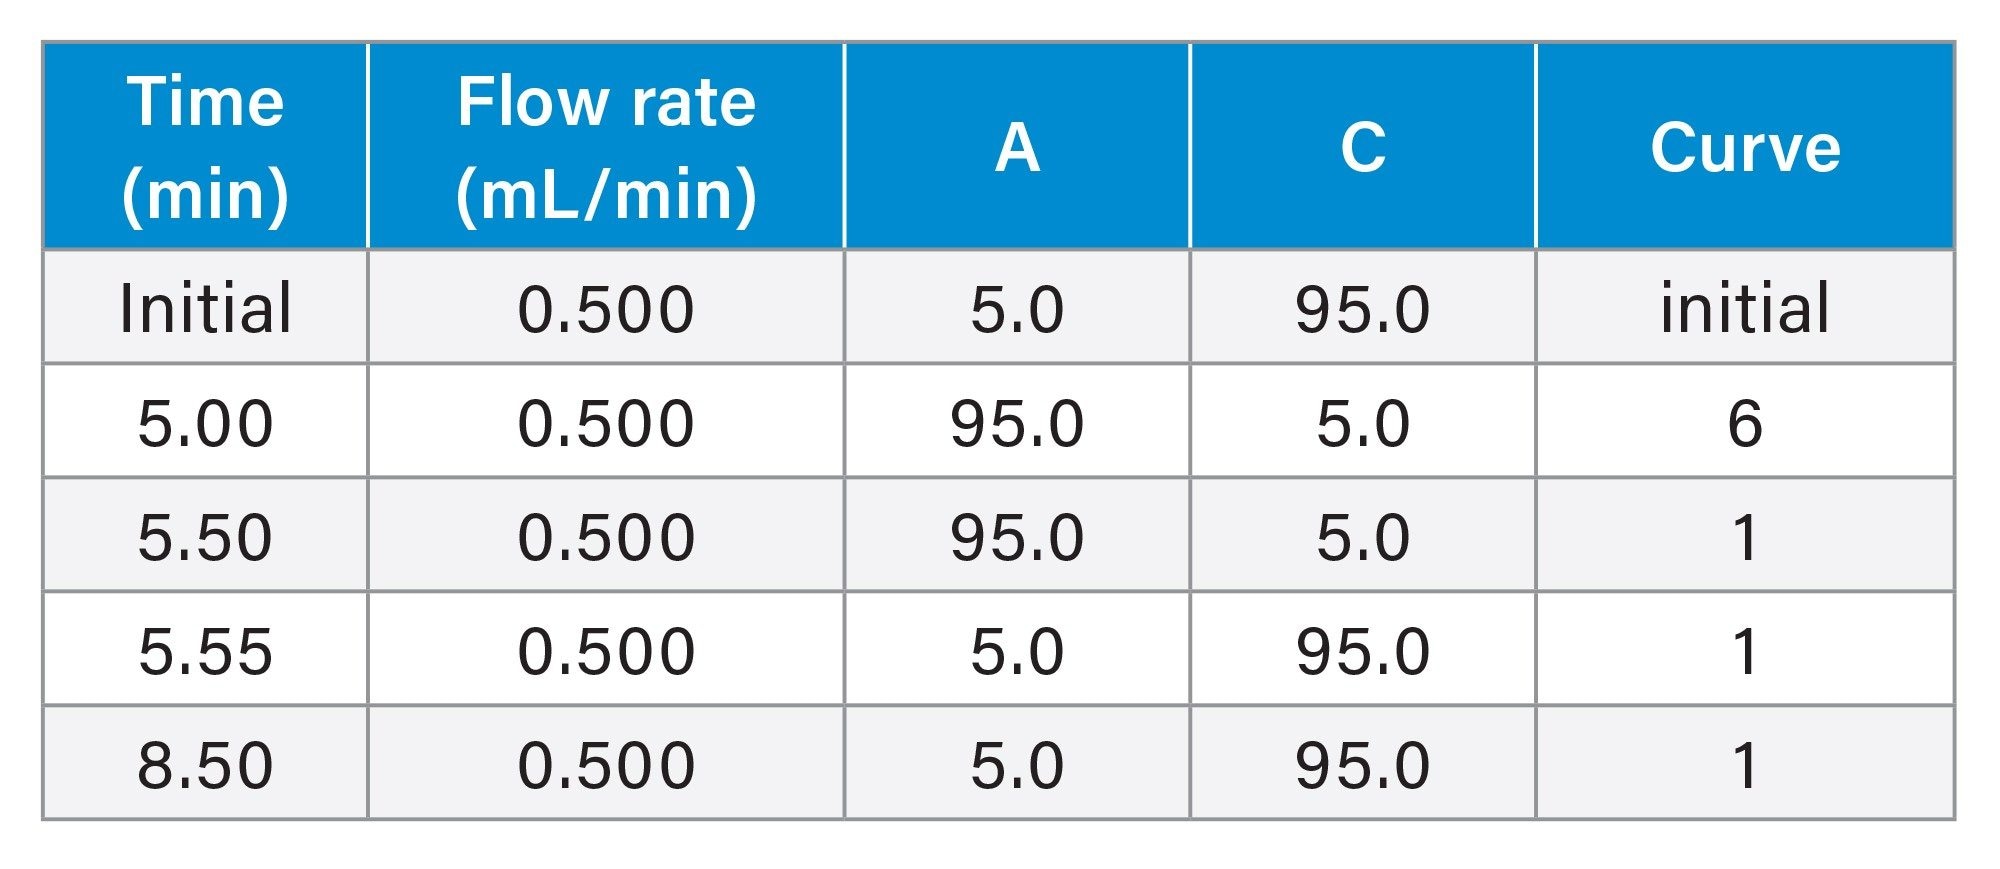
UV-Detected Column Bleed Study
Column bleed was assessed using a methanol gradient with 5 different aqueous mobile phases ranging from pH 2–8. A 1 minute equilibration in 5/95 v/v methanol/ aqueous mobile phase was performed before four consecutive blank aqueous injections were carried out. The results obtained from the last injection were used for calculations.
|
Instrument: |
ACQUITY UPLC H-Class System consisting of a QSM with a 100 μL mixer, a SM-FTN with a 15 μL needle, an ACQUITY CM-A and CM-Aux, and an ACQUITY UPLC PDA Detector installed with a 500 nL analytical flow cell |
|
Data management: |
Empower 3 Chromatography Data System |
LC Method Conditions
|
Column size: |
2.1 x 50 mm |
|
|
Column temperature: |
30 °C |
|
|
Injection volume: |
1.0 µL |
|
|
UV detection: |
250 nm |
Mobile phase
Gradient Table
Selectivity Evaluation I
2 sample mixtures were used in this evaluation. The first sample contained 10 µg/ml of uracil, 40 µg/mL of caffeine, 500 µg/mL of butylbenzene, and 1.5 µg/mL of anthracene. The second sample contained 200 µg/mL of phenol, 800 µg/mL of amylbenzene, 40 µg/mL of naphthalene, and 18 µg/mL of o-terphenyl. The sample diluent used was 70/30 v/v methanol/water. The column was equilibrated for 30 minutes and then 3 injections of sample mix 1 and sample mix 2 were performed. The results from the last injection of each mixture were reported.
|
Instrument: |
ACQUITY UPLC H-Class System consisting of a QSM with a 100 μL mixer, a SM-FTN with a 15 μL needle, an ACQUITY CM-A and a CM-Aux, and an ACQUITY UPLC PDA Detector installed with a 500 nL analytical flow cell |
|
Data management: |
Empower 3 Chromatography Data System |
LC Method Conditions
|
Column size: |
2.1 x 50 mm |
|
Column temperature: |
40 °C |
|
Injection volume: |
1.0 µL |
|
Flow rate: |
0.25 mL/min |
|
Mobile phase: |
70/30 v/v methanol/ water |
|
UV detection: |
254 nm |
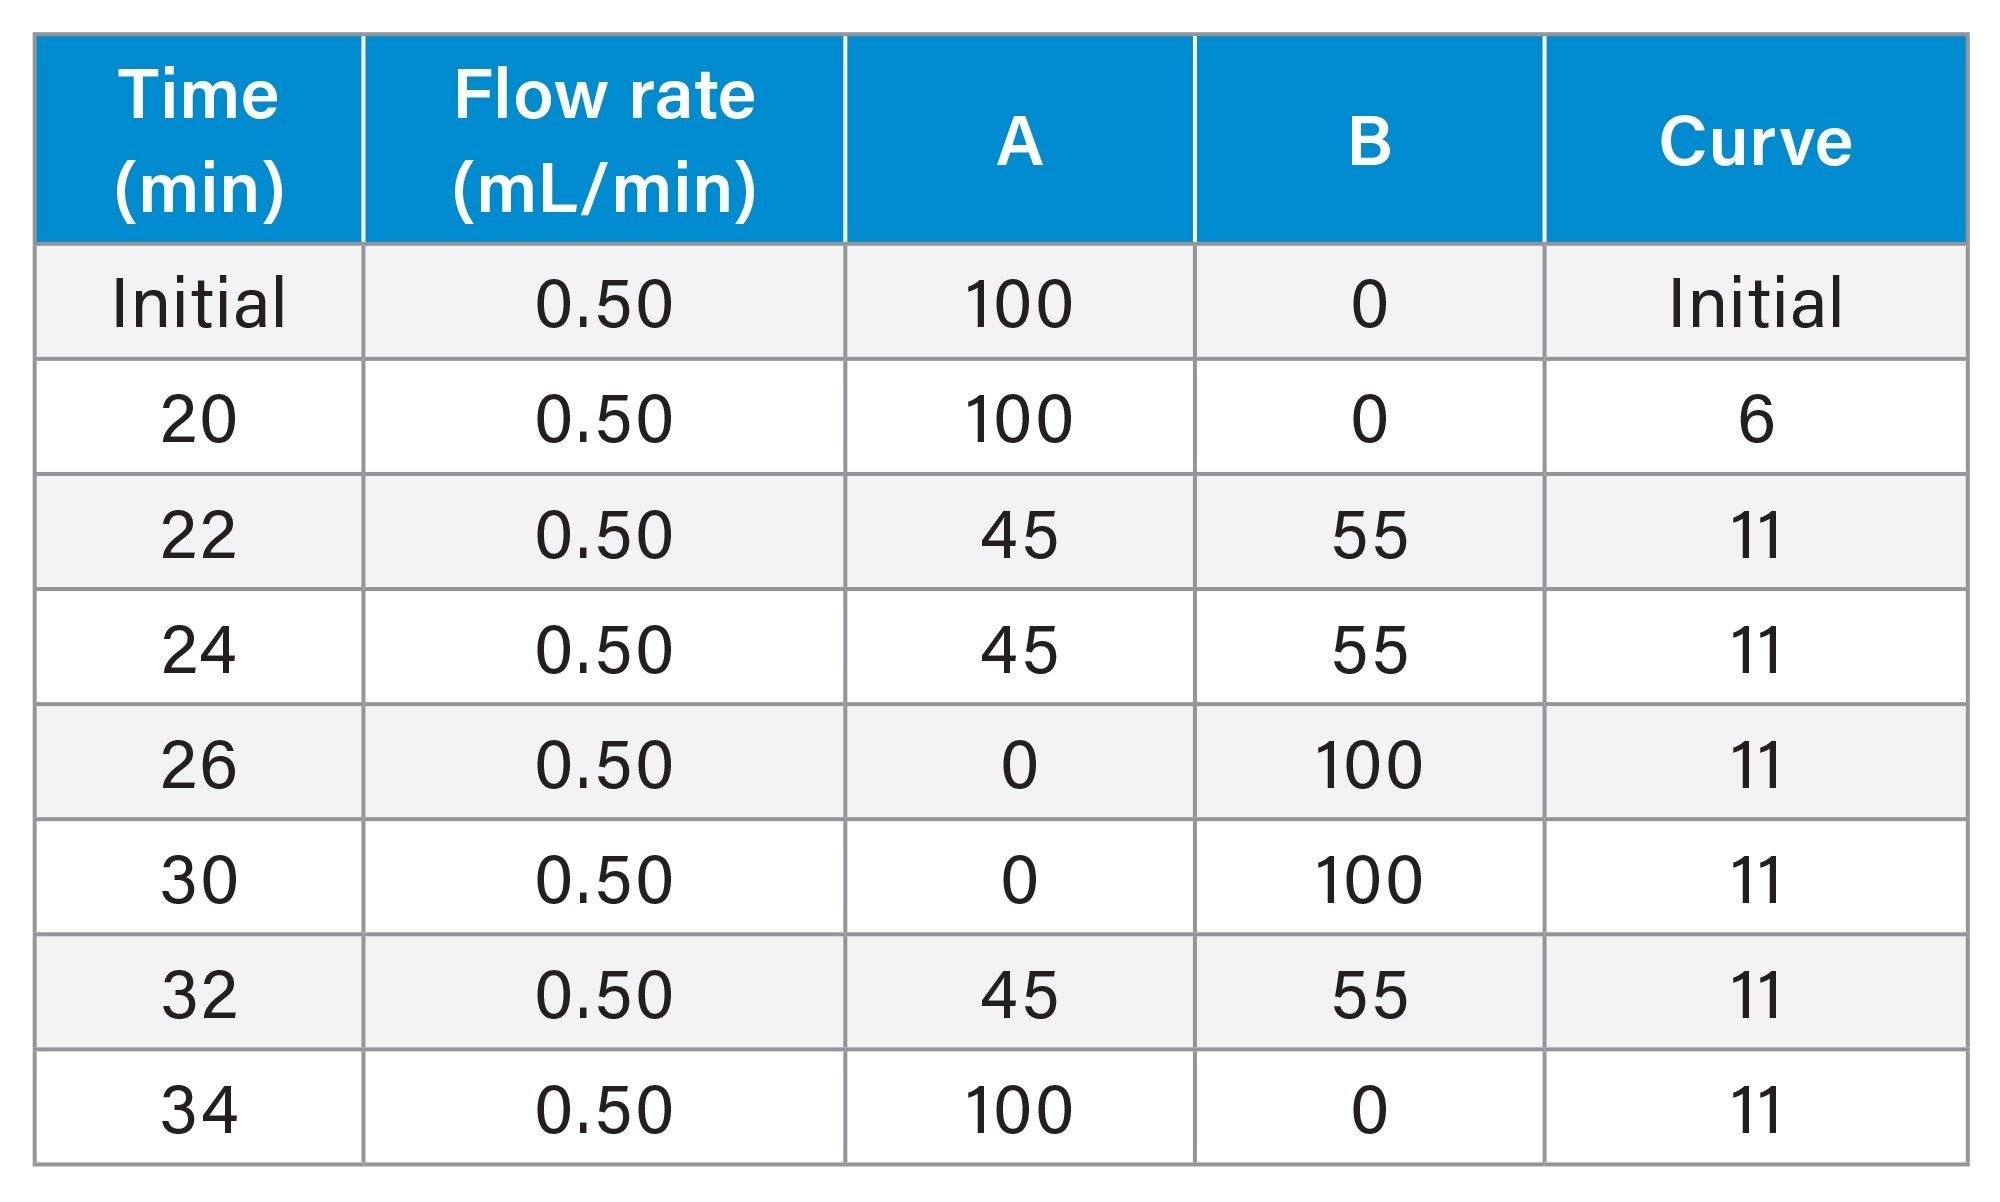
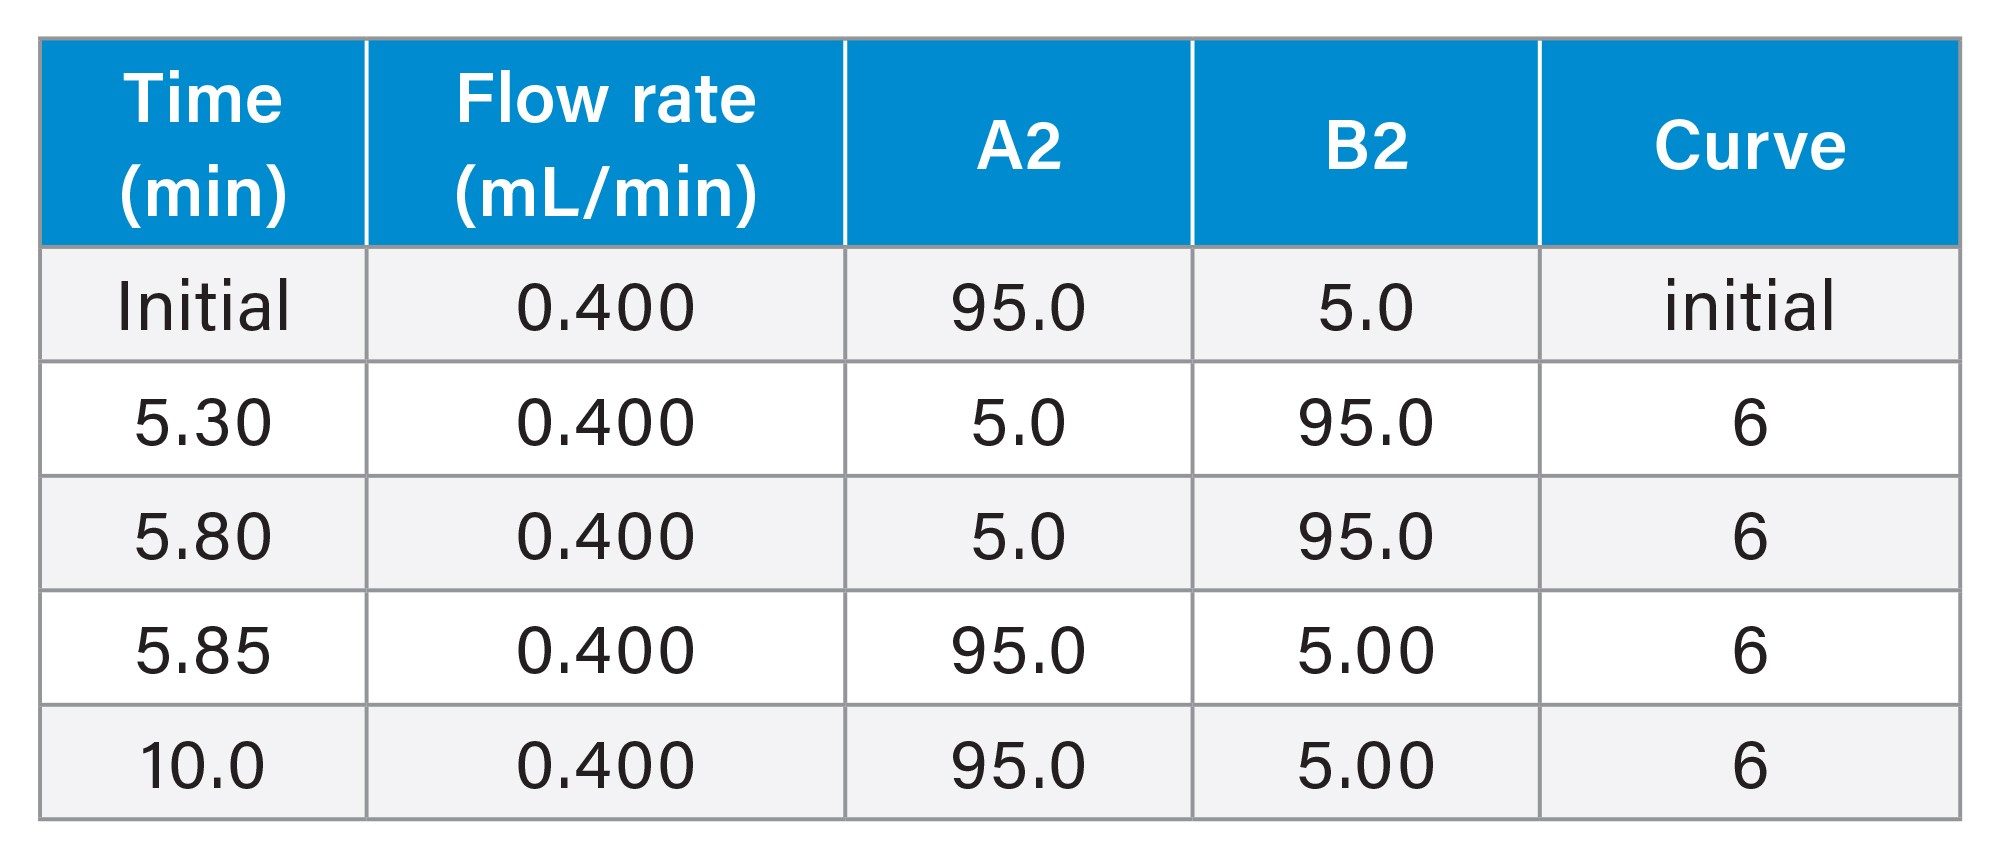
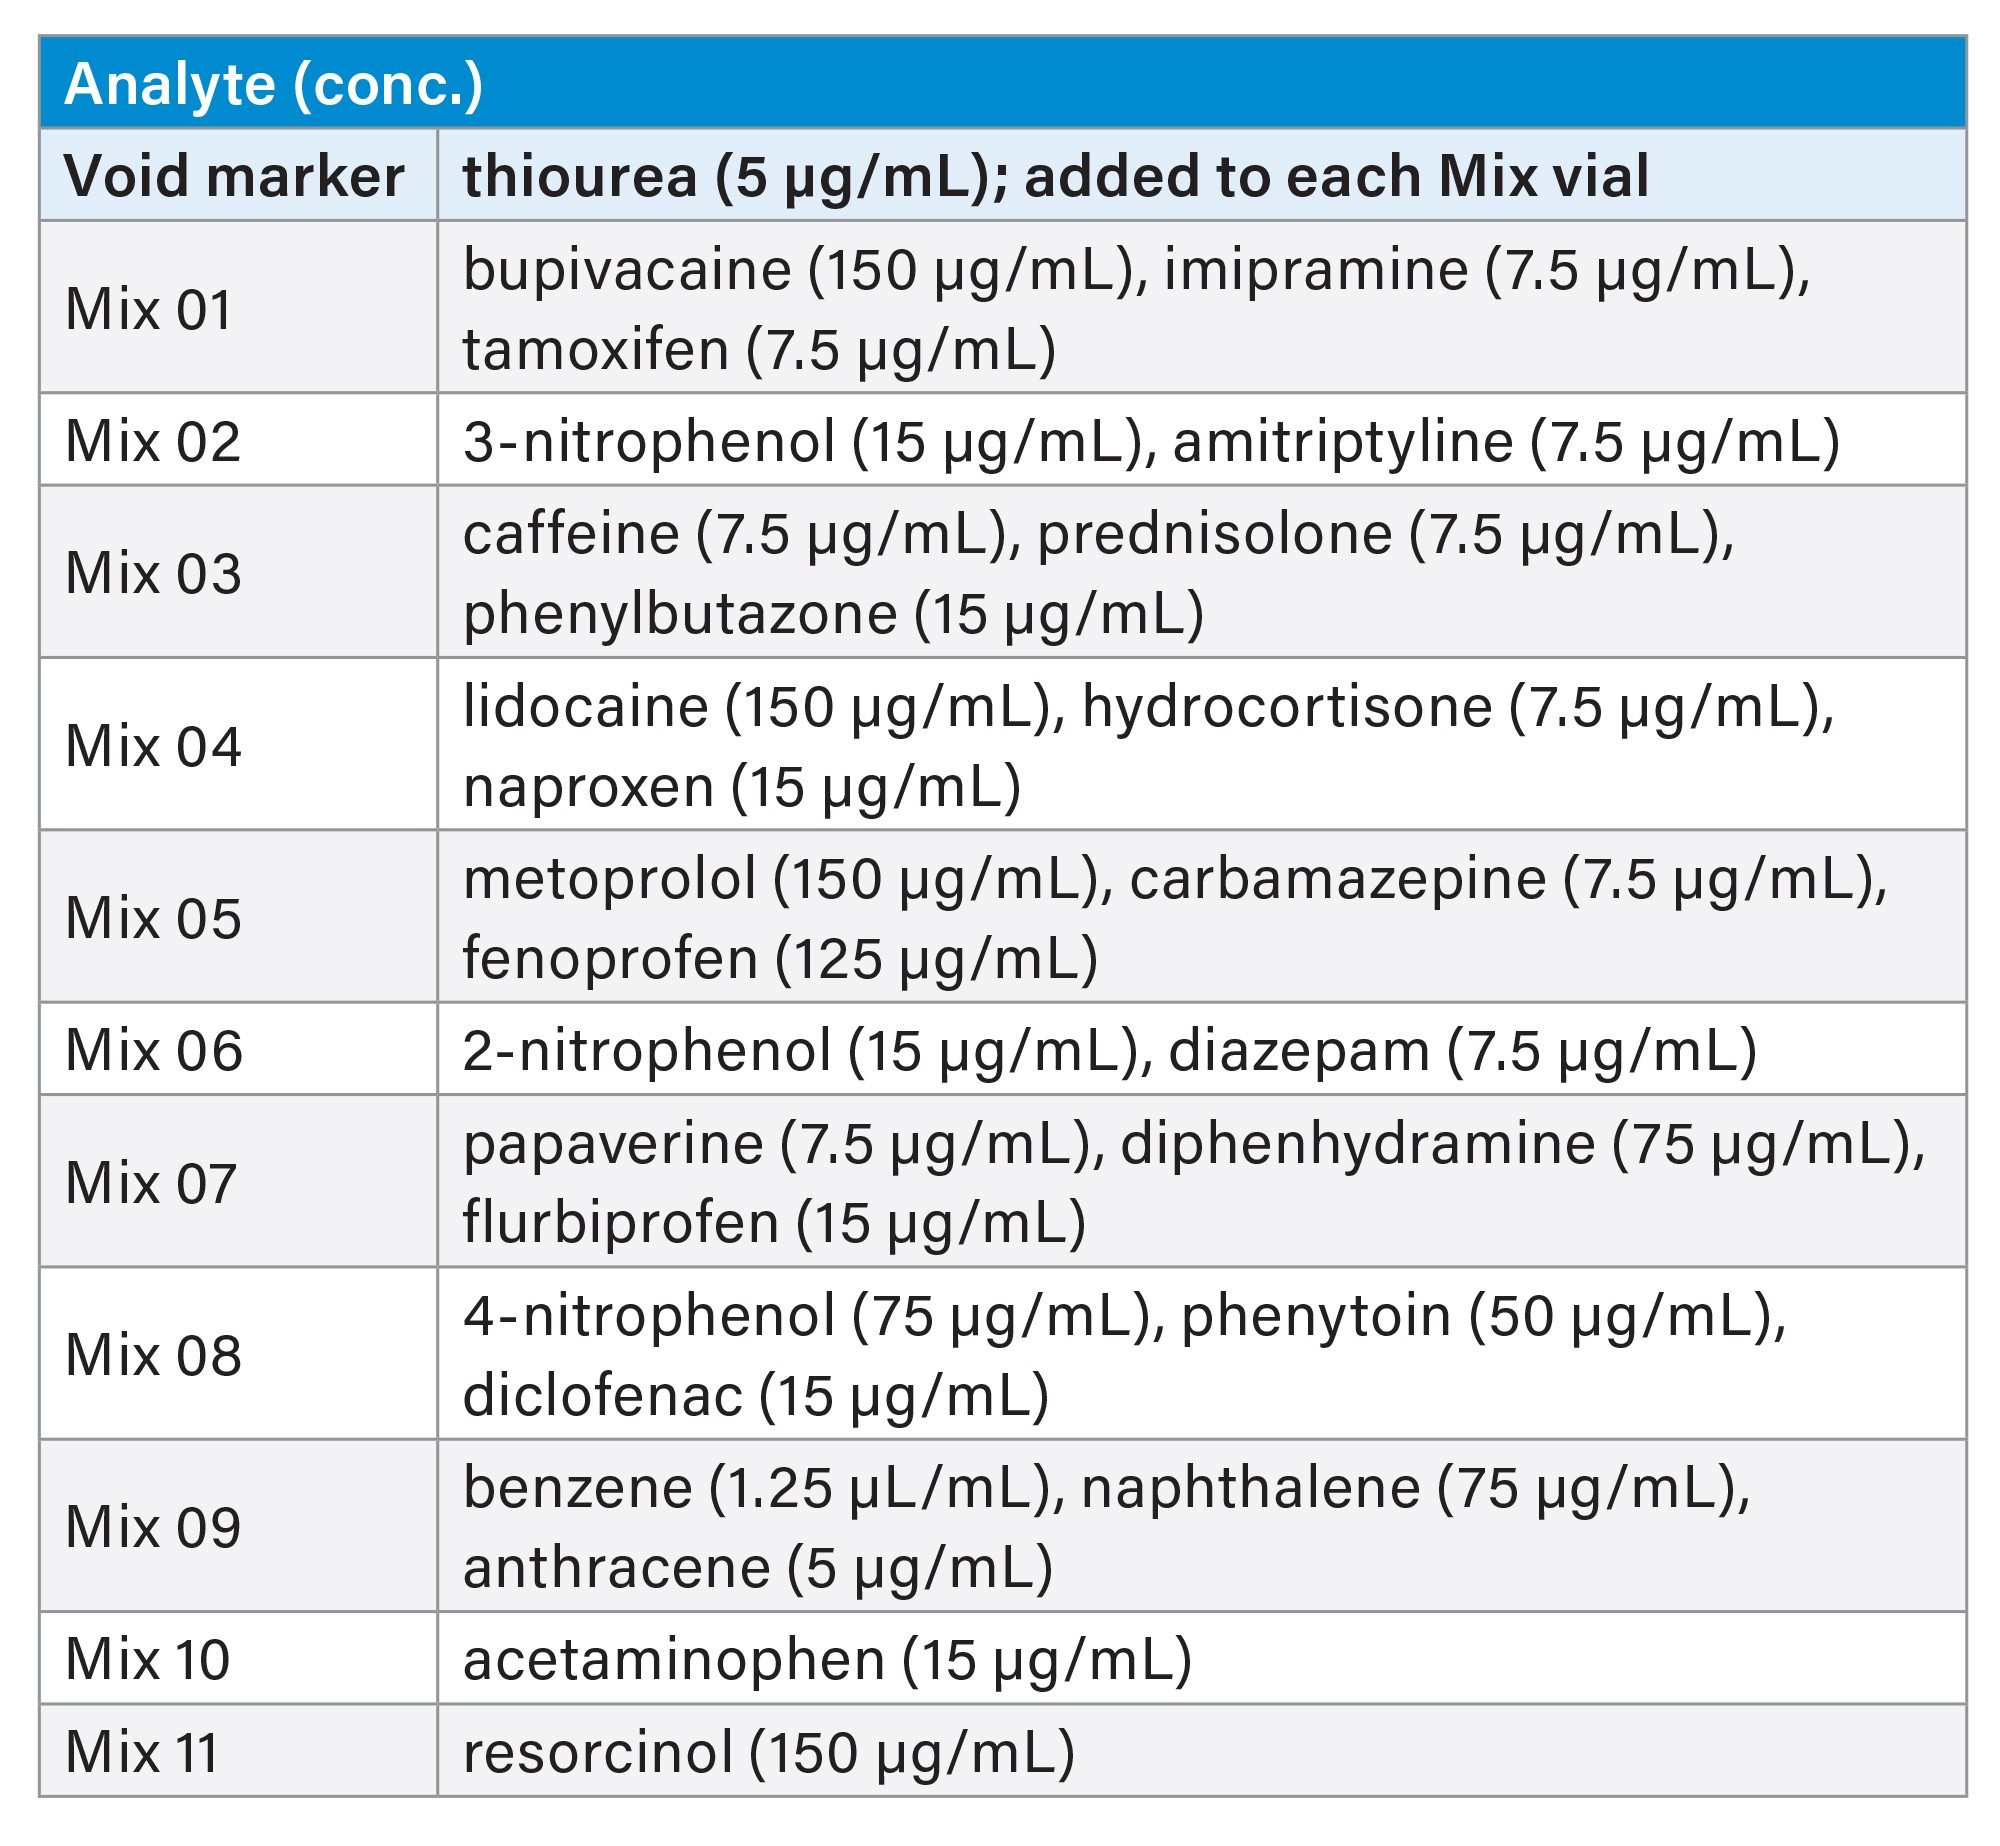
Selectivity Evaluation II
In this study, 11 sample mixtures, each containing one to four analytes, were analyzed using a methanol gradient. The contents of the samples are given on the table below. The sample diluent used for the mixtures was 20/80 v/v acetonitrile/water, except for Mix 09 which was prepared using 100% acetonitrile. The column was conditioned using the gradient profile for 10 minutes and then 3 blank injections were performed followed by 1 injection of each sample mix. Each sample mixture had a run time of 10 minutes.
|
Instrument: |
ACQUITY Premier UPLC System with a BSM with 50 μL Ti-15k mixer, a SM-FTN with a 15 μL needle, an ACQUITY CH-A with APH enabled, and an ACQUITY UPLC PDA Detector installed with a 500 nL analytical flow cell |
|
Data management: |
Empower 3 Chromatography Data System |
LC Method Conditions
|
Column size: |
2.1 x 50 mm |
|
Column temperature: |
30 °C |
|
Injection volume: |
1.0 µL |
|
Mobile phase: |
Line A2 – 15.4 mM ammonium formate (aq) pH 3.0 Line B2 – 100% methanol |
|
UV detection: |
254 nm |
Gradient Table
Sample Table
Batch-to-Batch Reproducibility
The sample mixture contained 10 µg/mL of uracil, 4 µg/mL of anthracene, 43 µg/mL of naphthalene, 10 µg/mL of propylparaben, 100 µg/mL of amitriptyline, 200 µg/mL of acenaphthene, 250 µg/mL of propranolol and 240 µg/mL of dipropyl phthalate. The sample diluent was 65/35 v/v methanol/20mM potassium phosphate pH 7.0. The column was equilibrated for 30 minutes in 65/35 v/v methanol/20 mM potassium phosphate pH 7.0 and then four injections of the sample mixture were performed. The results from the last injection of the mixture were reported.
|
Instrument: |
ACQUITY UPLC Classic System consisting of a BSM with a 50 μL mixer, a 2 µL fixed loop Sample Manager with a 30 μL needle, an ACQUITY UPLC High Temperature Column Heater and an ACQUITY TUV Detector installed with a 500 nL analytical flow cell |
|
Data management: |
Empower 3 Chromatography Data System |
LC Method Conditions
|
Column size: |
2.1 x 50 mm |
|
Column temperature: |
30 °C |
|
Injection volume: |
1.5 µL |
|
Flow rate: |
0.25 mL/min |
|
Mobile phase: |
65/35 v/v methanol/20 mM potassium phosphate pH 7.0 |
|
UV detection: |
254 nm |
Results and Discussion
Chemical and Physical Properties of the BEH Biphenyl Stationary Phase
A biphenyl group consists of 2 benzene rings connected by a single covalent bond.5 The 2 rings are not planar and are typically twisted by 45°. The presence of 2 benzene rings in biphenyl offers twice as many π electrons as a phenyl group. The biphenyl groups can interact with analytes that possess π electrons or with electron-deficient analytes6 increasing their retention. This interaction is lacking for alkyl stationary phases and is relatively weak for phenyl stationary phases. Consequently, biphenyl stationary phases exhibit different selectivity than alkyl and phenyl columns, particularly when using mobile phase solvents that don’t possess π electrons (e.g. methanol instead of acetonitrile).
Table 1 compares the base material and bonding chemistry of 6 different biphenyl columns along with comparisons to BEH C18 and BEH Phenyl materials. Trifunctional bonding is represented by t and monofunctional bonding is represented by m. The BEH Biphenyl stationary phase is based on 130 Å BEH particles which were chosen to provide similar stability and reproducibility to other BEH materials. In comparison, the biphenyl columns from other vendors are based on silica and have poor stability above pH 8 due to hydrolysis of the silica particles.7
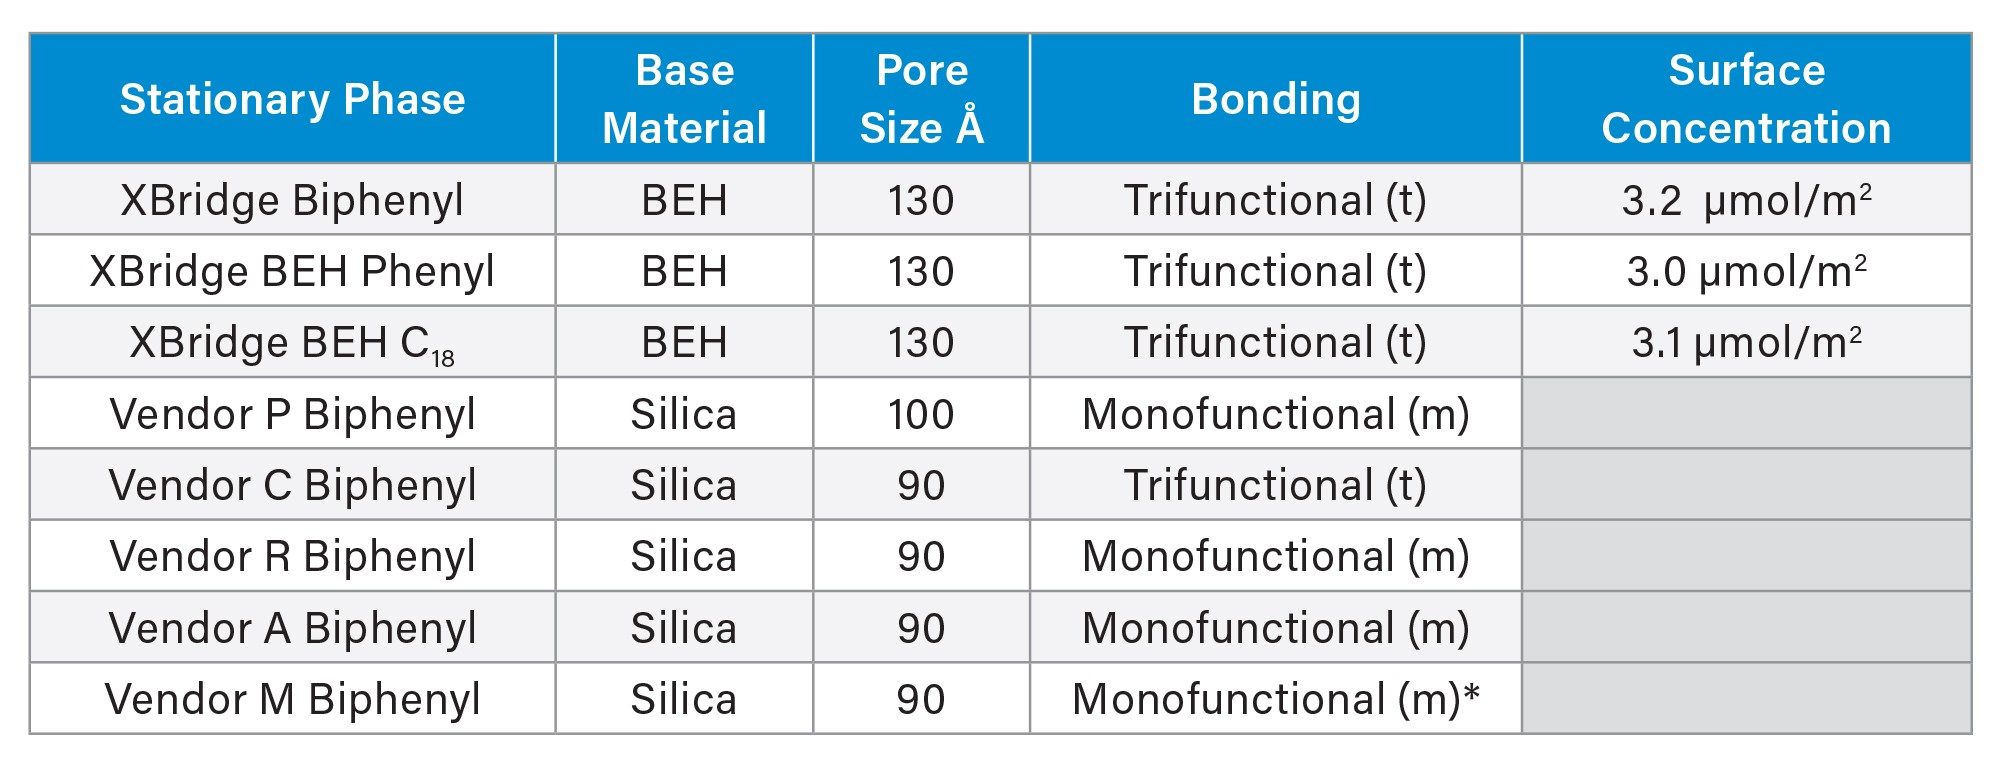
Table 1. Comparison of the chemical and physical properties of several stationary phases.
*The stationary phase for vendor M has isobutyl groups attached to the silicon atom.
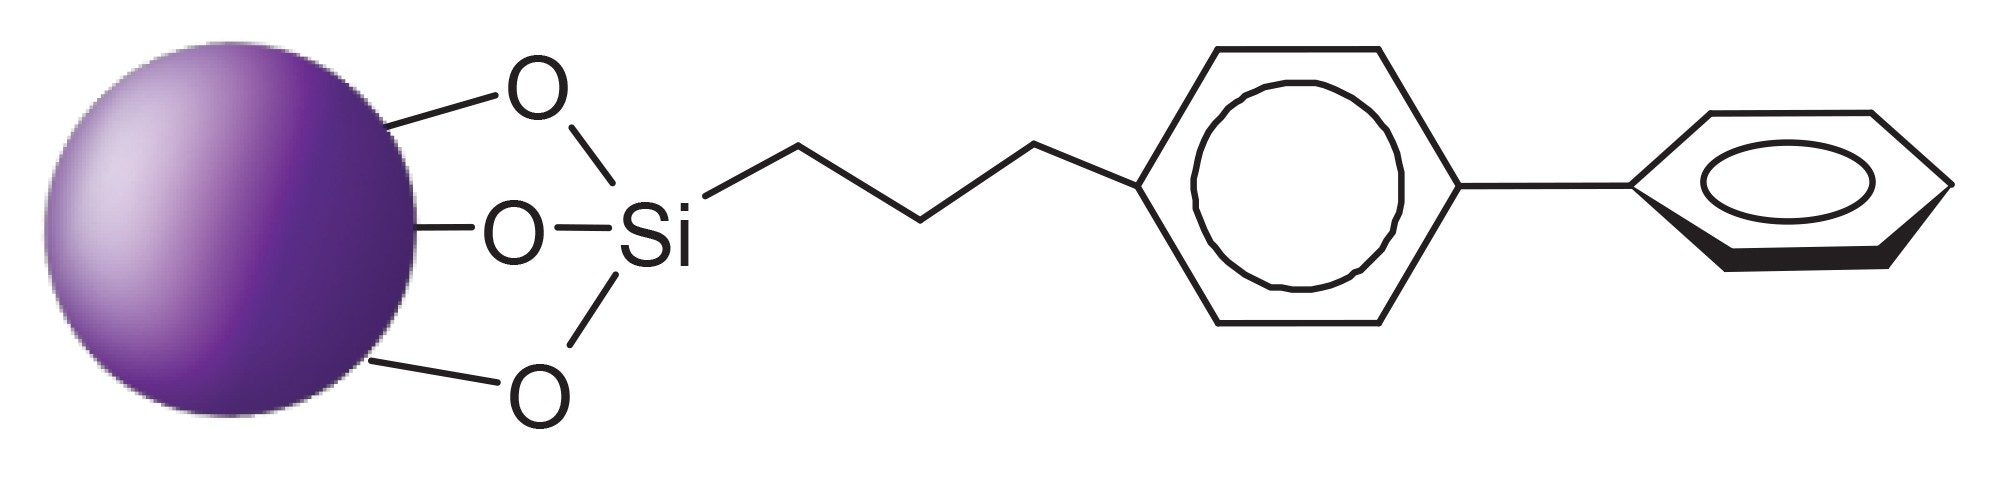
Figure 1 shows the structure of the BEH Biphenyl bonded phase. Trifunctional bonding (t) attaches the biphenyl group to the particle by up to three siloxane bonds, which increases the hydrolytic stability of the bonded phase.8 The propyl linker between the silicon atom and the biphenyl group provides an additional increase in hydrolytic stability.
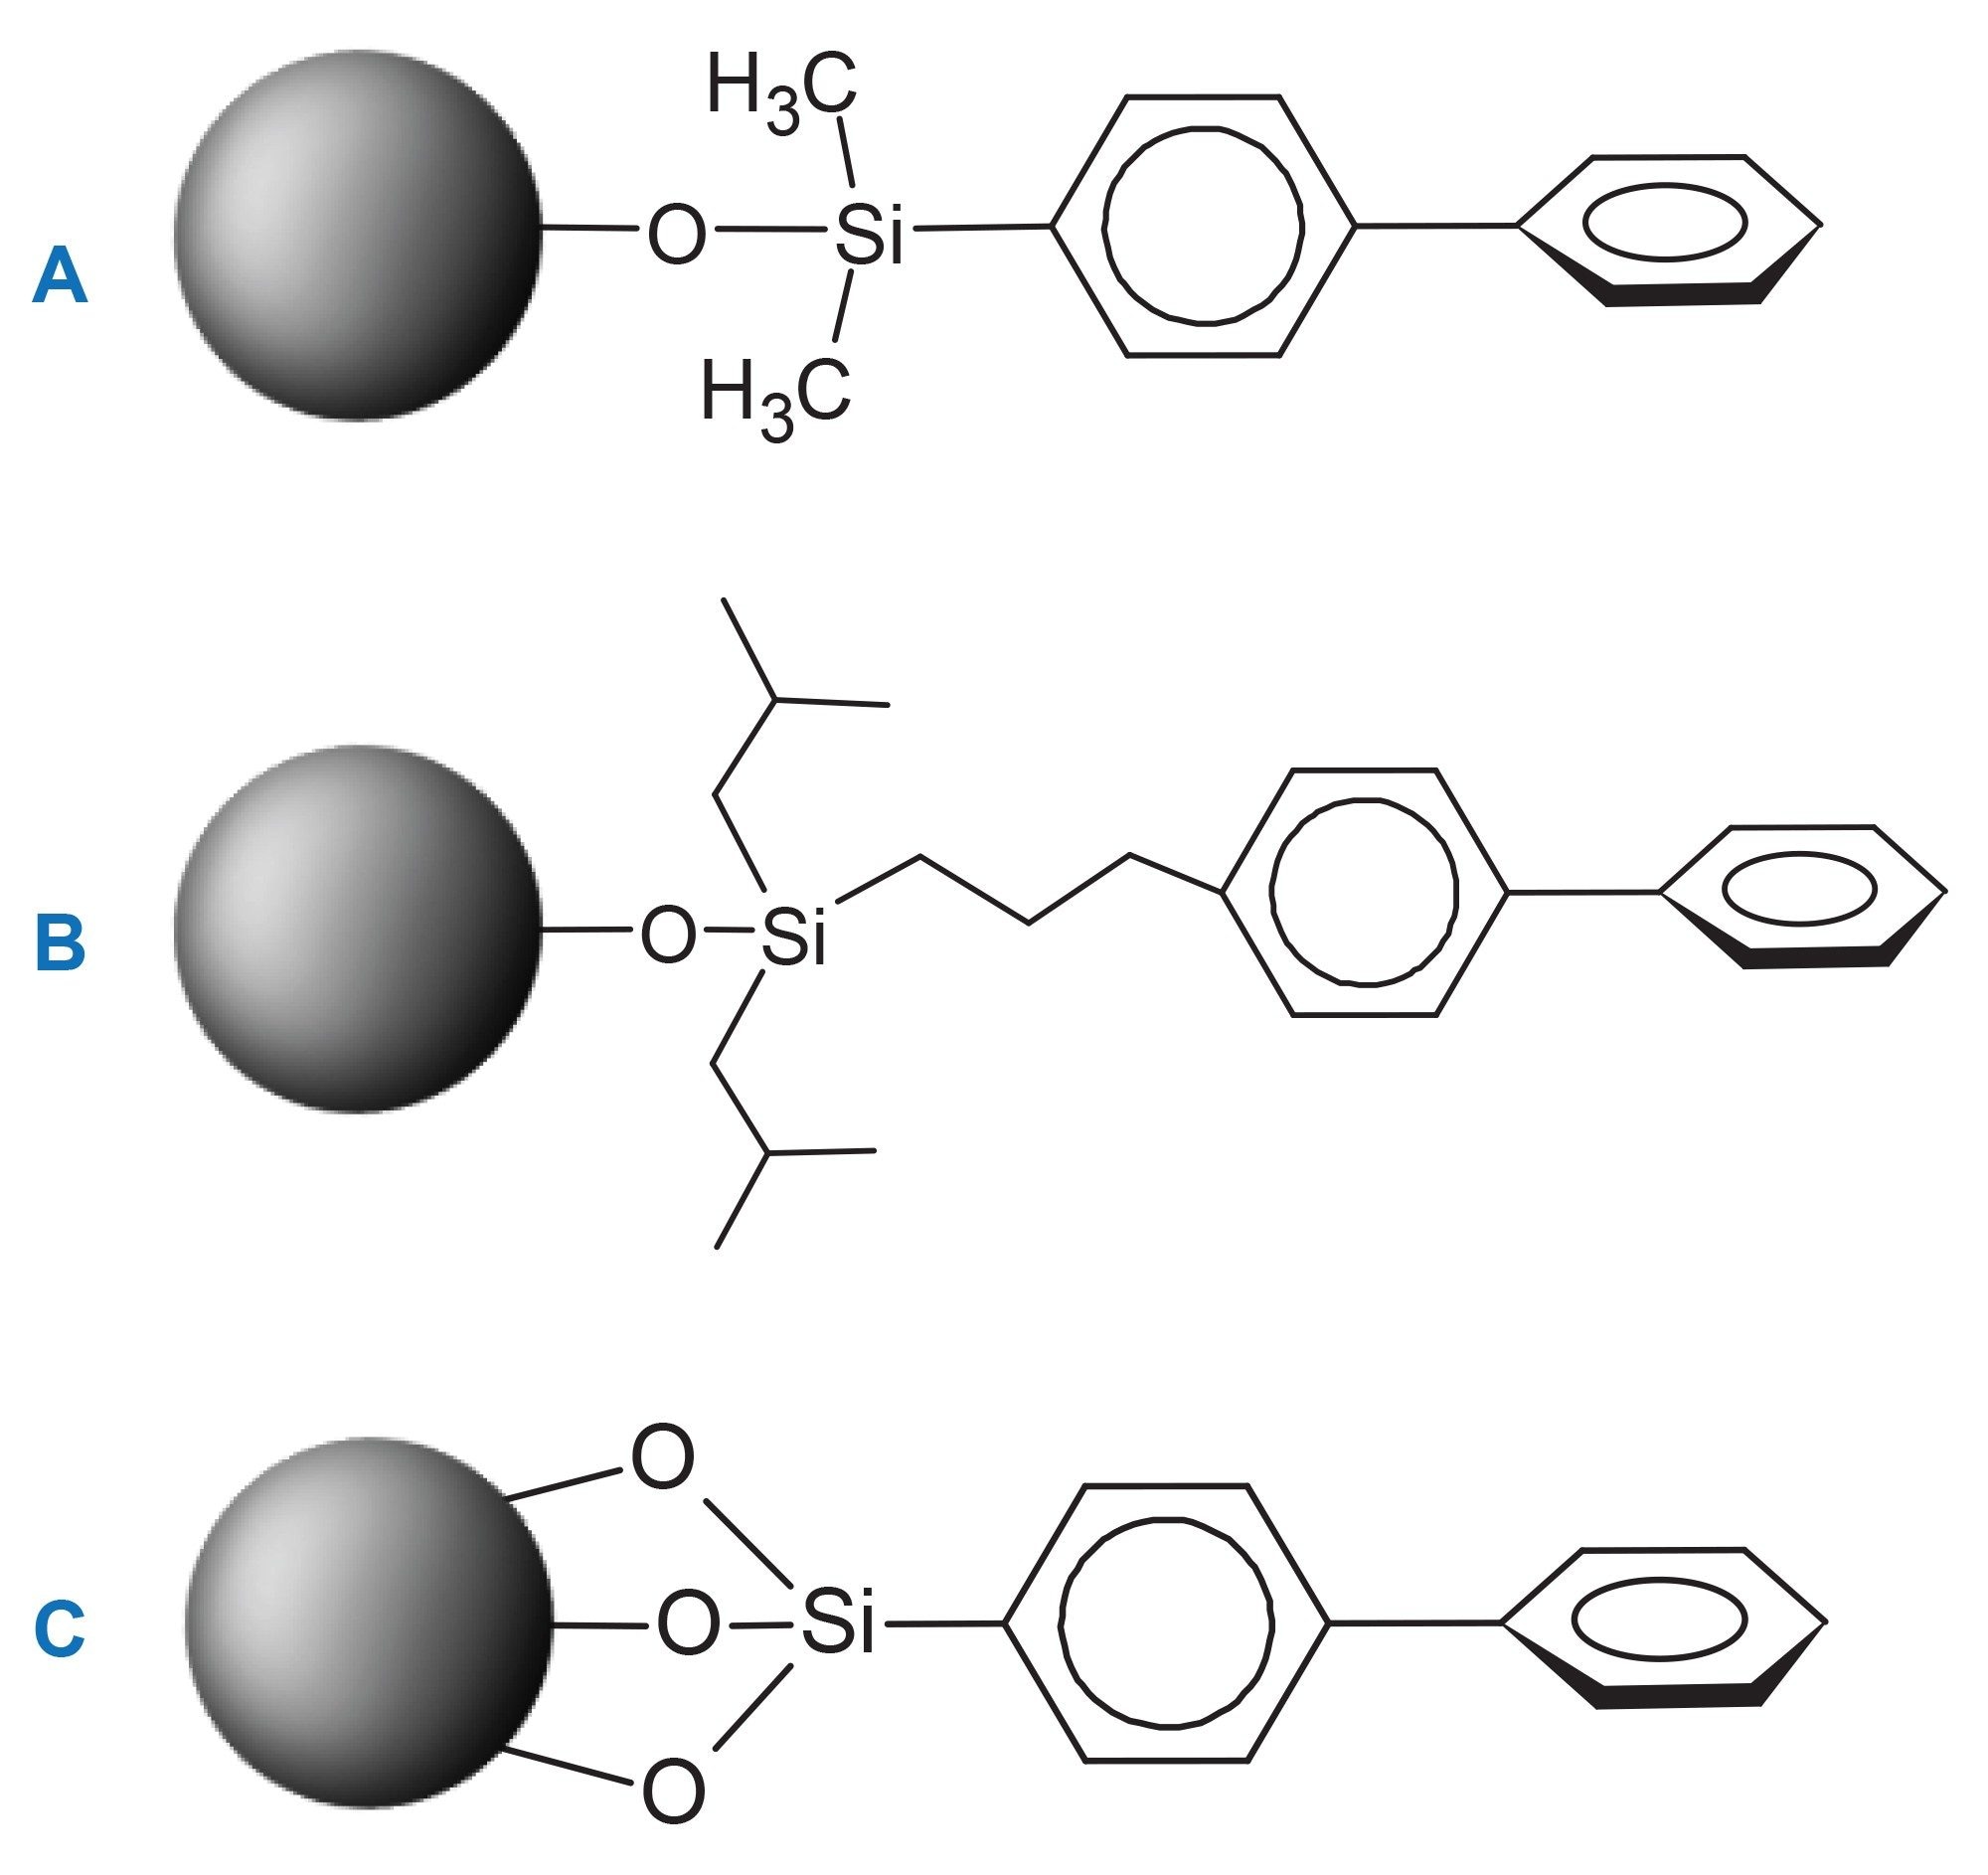
The structures of biphenyl bonded phases offered by other vendors are shown in Figure 2. Most biphenyl stationary phases are monofunctionally bonded (m) where the biphenyl ligand is attached to the silica by a single siloxane bond (Figure 2A). This siloxane bond may be cleaved when exposed to acidic or basic mobile phases, resulting in loss of the bonded phase.8 The biphenyl stationary phase offered by vendor M is monofunctionally bonded with isobutyl groups used in place of methyl groups to provide steric protection for the siloxane bond (see Figure 2B). The biphenyl columns from vendor C employ the trifunctional bonded phase structure as shown in Figure 2C, which differs from that of the BEH Biphenyl bonded phase by the absence of the propyl linker between the silicon atom and the biphenyl group.
pH Stability
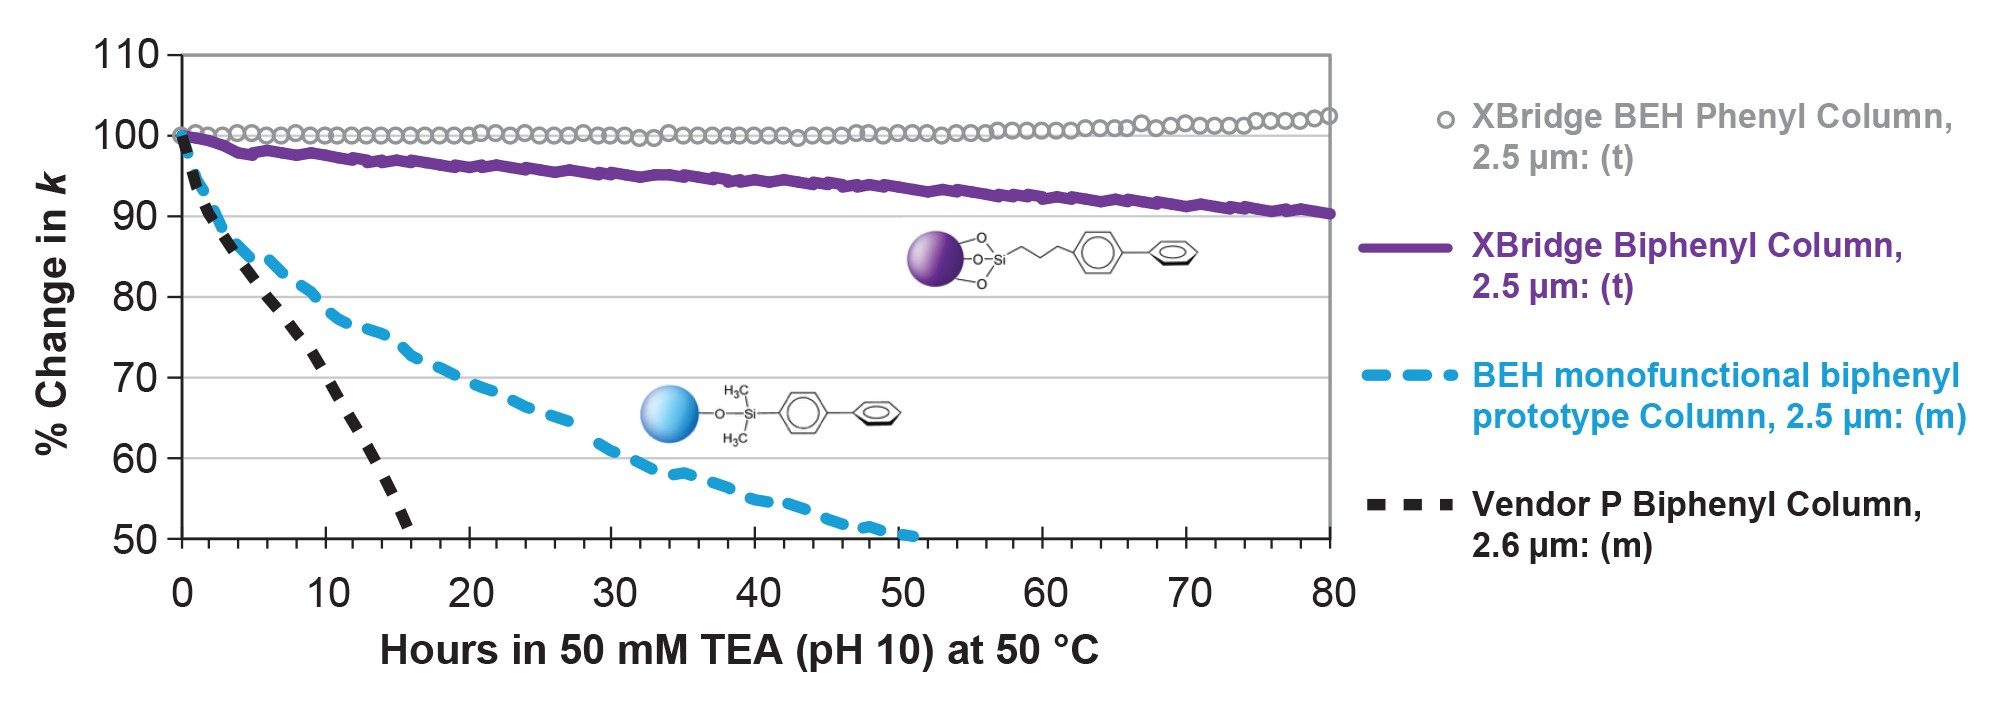
The base-stable BEH particles combined with the trifunctional bonding and propyl linker used in biphenyl columns provide exceptional stability under both acidic and basic conditions. The BEH particles increase chemical stability at high pH due to the internal crosslinking provided by the ethylene-bridged siloxane groups present throughout the particles.9 Figure 3 compares the accelerated base stability of an XBridge Biphenyl Column to that of an XBridge BEH Phenyl Column, a prototype monofunctional BEH Biphenyl Column with the bonded phase structure shown in Figure 2A and a silica-based monofunctional biphenyl column from vendor P. Each column was subjected to repeated exposures to 50 mM TEA buffer (pH 10) at 50 °C. The tests were carried out for a total of 80 hours of base exposure or until the column exhibited a 50% decrease in retention factor (k). The silica-based biphenyl column from vendor P only lasted for 16 hours under these conditions. The prototype BEH monofunctional (m) biphenyl column exhibited 50% k loss after 52 hours. The XBridge Biphenyl Column showed improved stability in comparison to the monofunctionally bonded prototype column with less than 10% k loss after 80 hours. These results demonstrate that the BEH particle, the trifunctional bonding and the propyl linker all contribute to the base stability of XBridge Biphenyl columns.
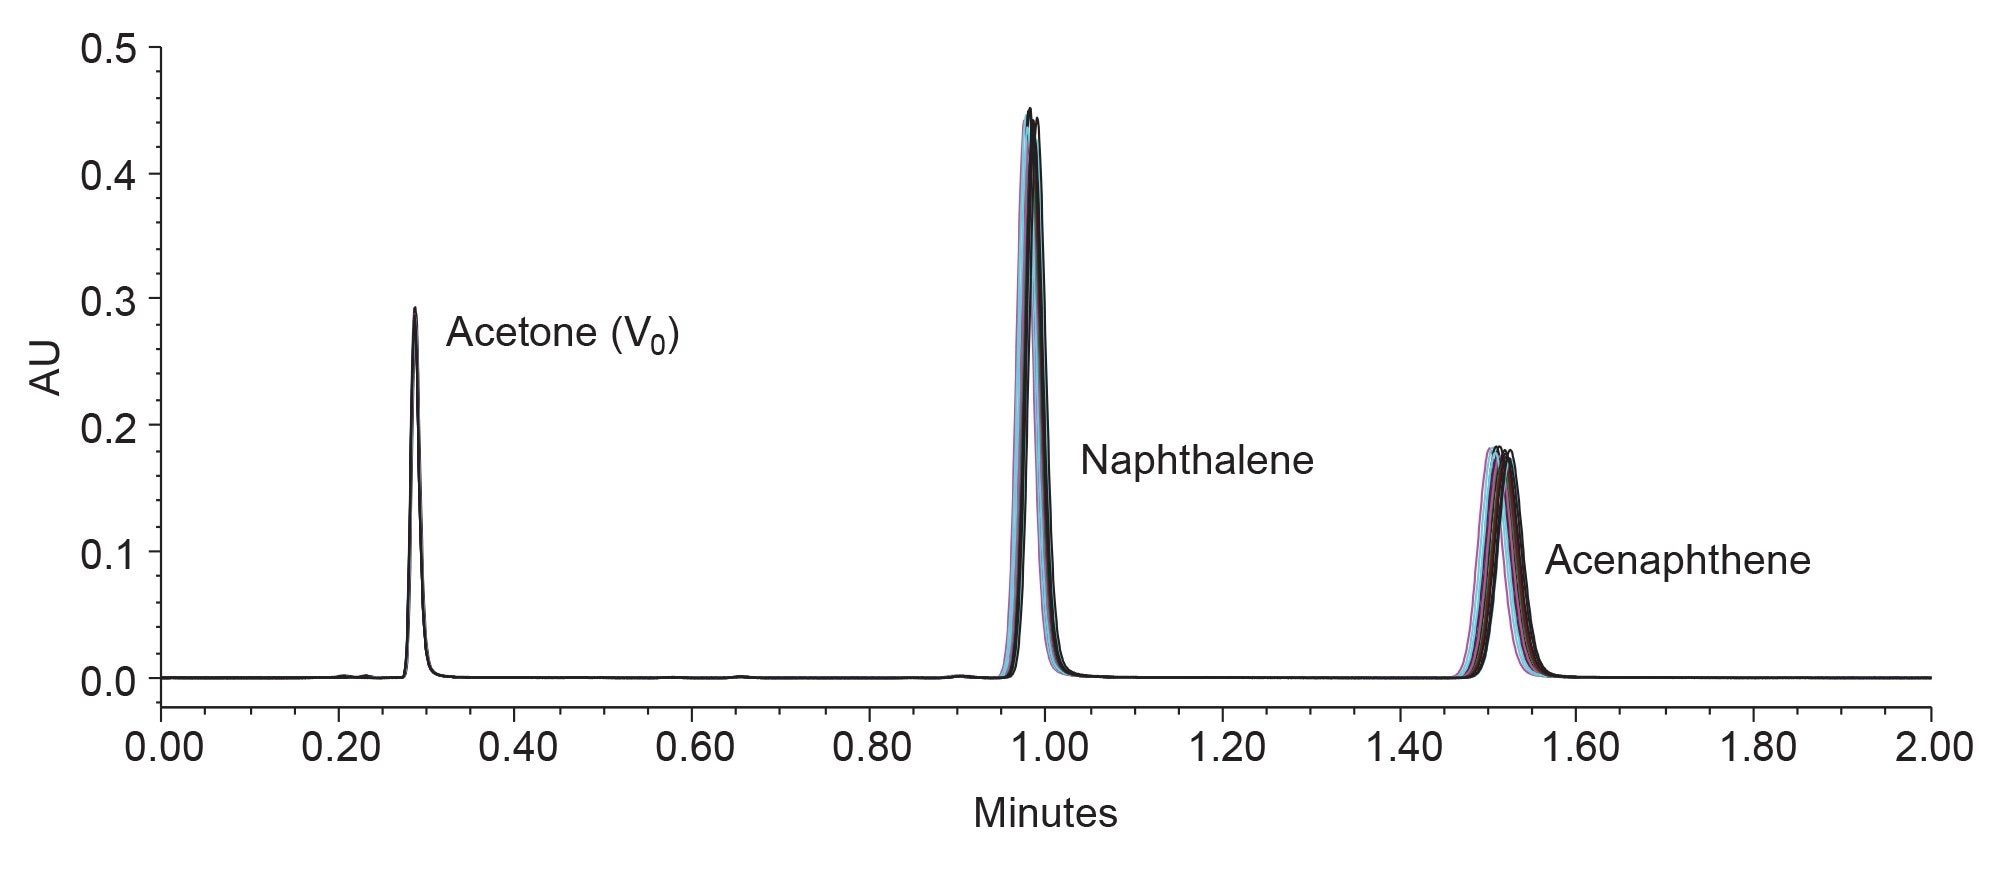
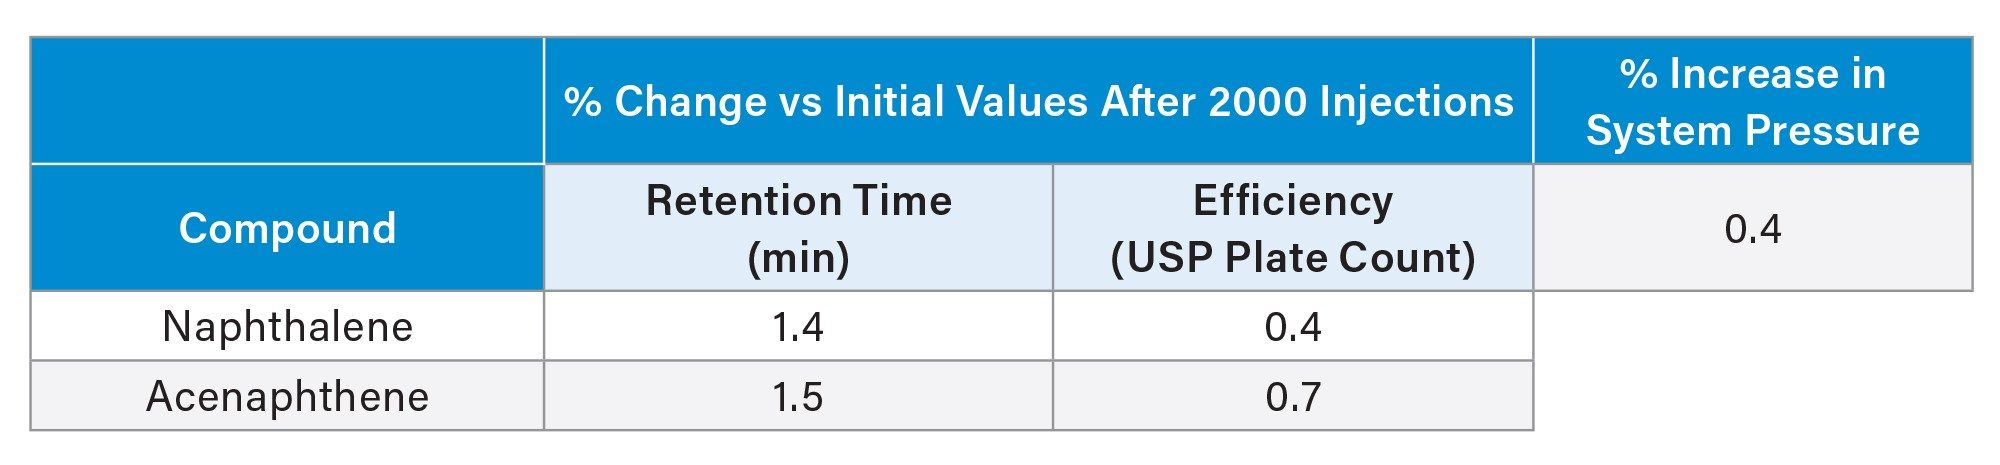
Another assessment was conducted to determine the stability of the Biphenyl columns under non-accelerated basic conditions. An Acquity Biphenyl Column was subjected to 2000 consecutive 2-minute injections of a Waters neutrals QCRM standard using 50/50 (v/v) acetonitrile/ 20 mM ammonium bicarbonate pH 9.0 as the mobile phase and a temperature of 35 °C. The results shown in Figure 4 demonstrate consistent peak shape and minimal retention time changes over the course of the test. Table 2 shows the % change in retention time and efficiency for the 2 analytes present in the QCRM standard. The % change in system pressure is also reported. The retention times changed by less than 1.6% and efficiency was changed by less than 1%. The system pressure increased less than 1% over the 2000 injections which indicates no significant fouling or blockage.
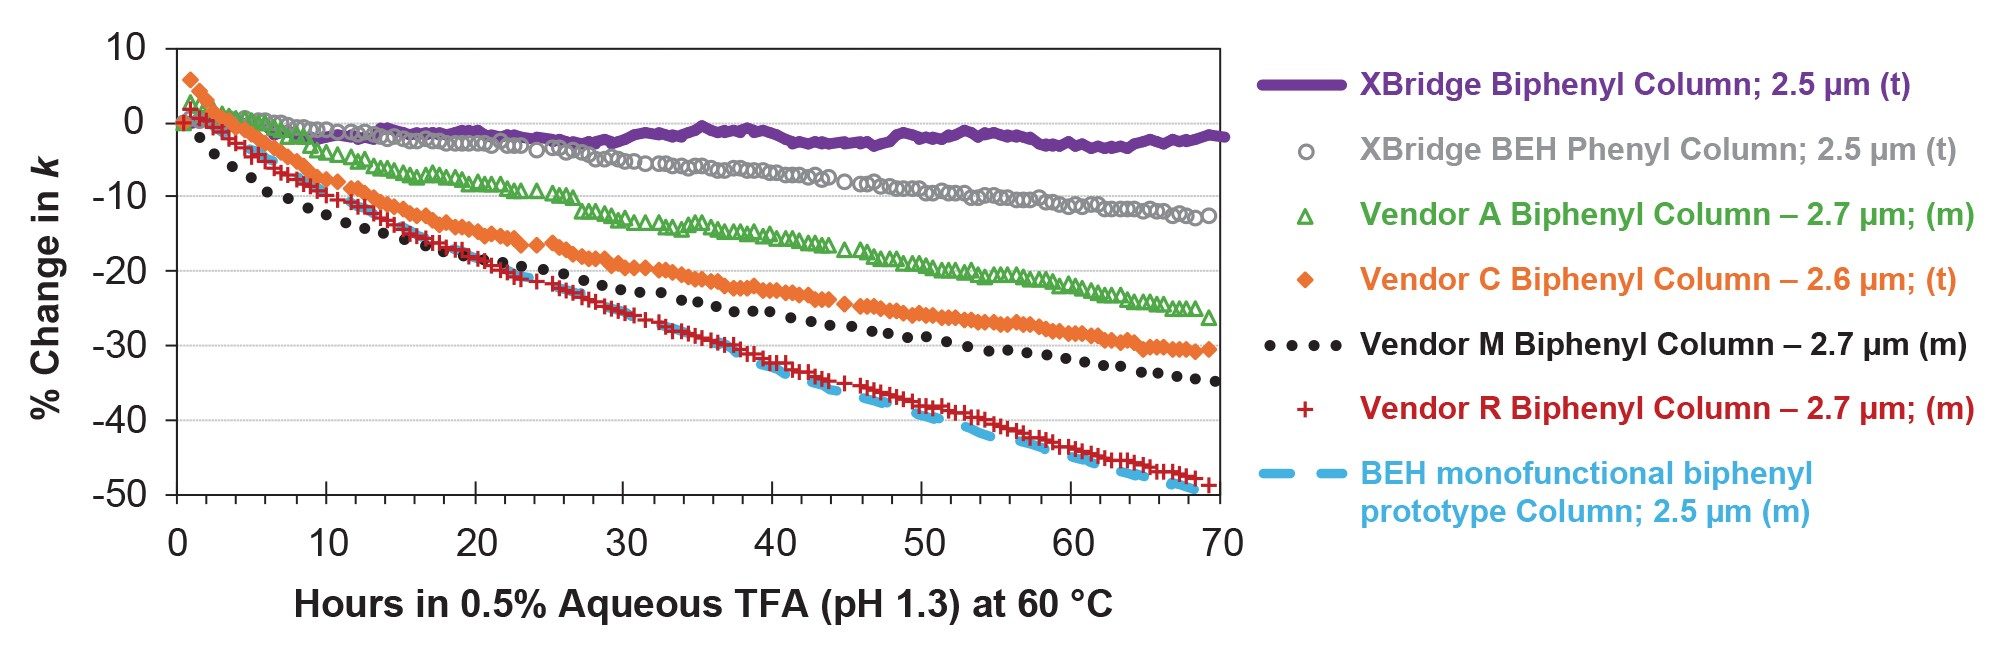
Having established the robustness of biphenyl columns in basic conditions, an accelerated acid stability assessment was performed. Seven columns were evaluated including 4 biphenyl columns from other vendors, an XBridge Biphenyl Column, an XBridge BEH Phenyl Column and a monofunctional BEH Biphenyl Prototype Column. For each column, 130 injections were made using 0.5% TFA (pH 1.3) as the challenge mobile phase at a temperature of 60 °C. Figure 5 shows the results of the accelerated acid stability study. Among all columns evaluated, the XBridge Biphenyl Column demonstrated the greatest resistance to acidic degradation. After 68 hours of exposure, there was less than 10% change in k for the XBridge Biphenyl Column. The BEH biphenyl prototype with monofunctional bonding had ~50% decrease in retention. The biphenyl columns from other vendors, including the biphenyl column from vendor C which also uses trifunctional bonding but lacks the propyl linker (see Figure 2C), had greater than a 20% loss in k after 68 hours. The enhanced stability of the XBridge Biphenyl Column is due to both the trifunctional biphenyl bonding chemistry and the propyl linker between the silicon atom and the biphenyl group which minimize degradation via hydrolytic cleavage. The resulting robustness supports long column lifetimes which are critical for many applications.
UV-Detected Column Bleed
Most biphenyl columns exhibit significant column bleed during gradient separations when using UV detection, complicating peak integration. This interference arises from the elution of bonded phase hydrolysis products containing the biphenyl group. The absorption maximum for biphenyl is 250 nm which is close to commonly used detection wavelengths (e.g., 254 nm). At 250 nm, the molar absorptivity for biphenyl is 16,000 M-1 cm-1 10 which means biphenyl groups strongly absorb UV light at this wavelength producing a significant absorbance signal. This signal may interfere with chromatographic analyses. Consequently, efforts have been made by some vendors to minimize UV-detected column bleed. However, column bleed remains a common interference during gradient separations when using UV detection with biphenyl columns.
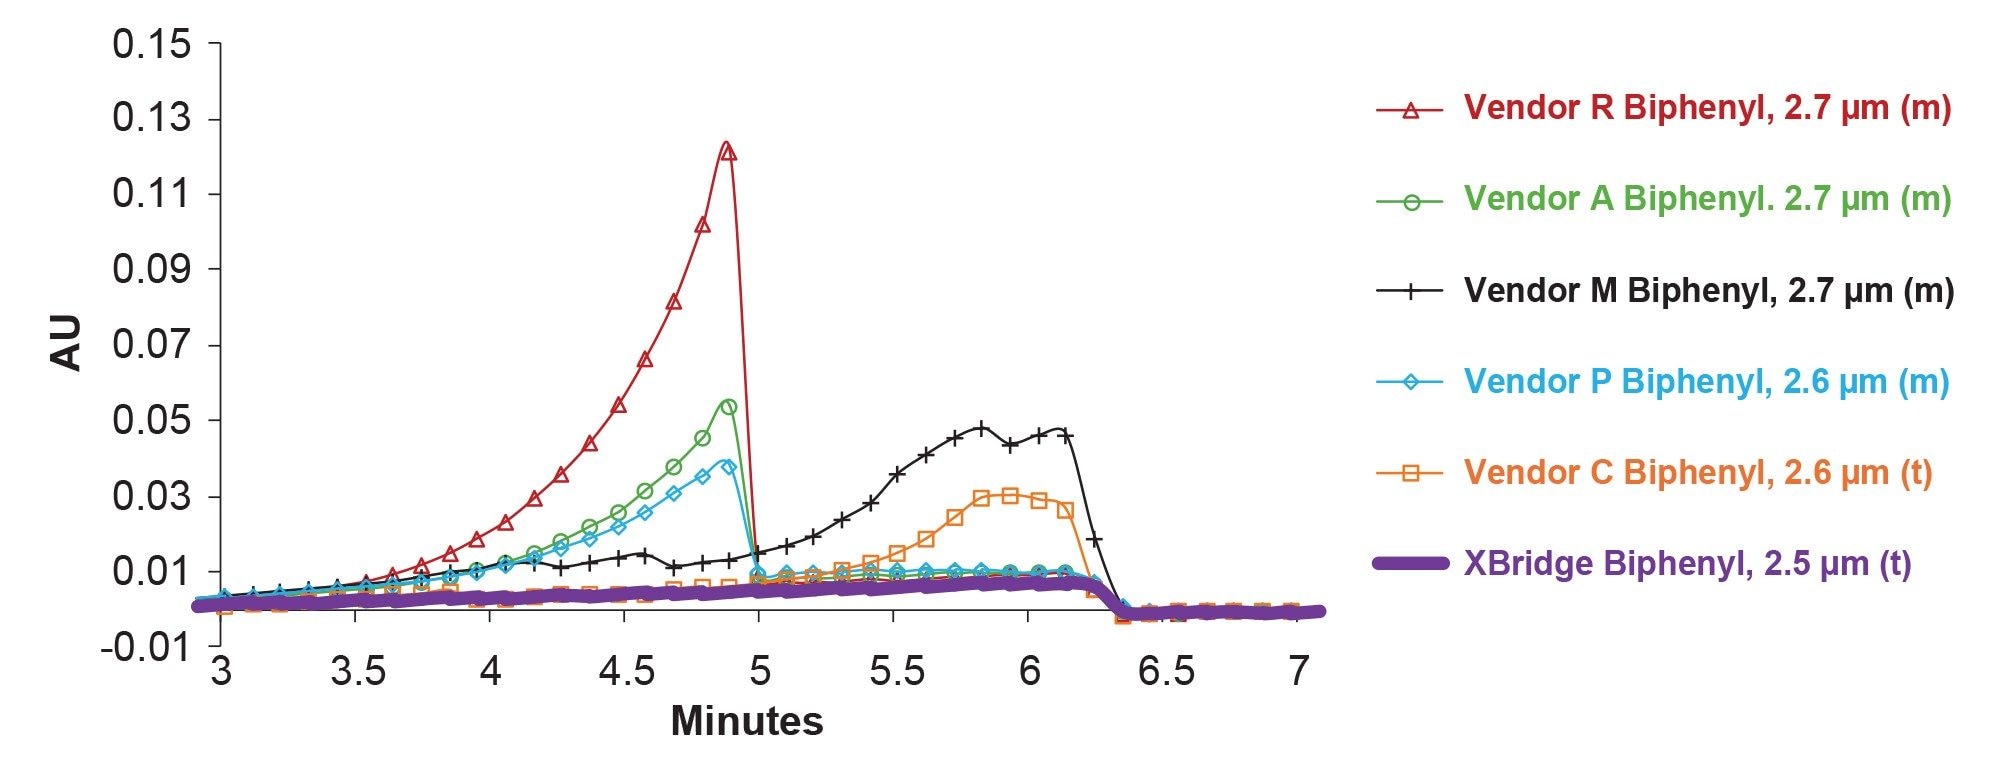
In Figure 6, blank gradients (5–95% organic) using 0.06% TFA in methanol and 0.1% TFA in water are compared for an XBridge Biphenyl Column and biphenyl columns from five different vendors. Small baseline changes may occur in gradient separations due to differences in the absorbance of the mobile phase.11 The baseline rise seen with biphenyl columns is larger and more prominent than what is seen for columns without column bleed like XBridge BEH C18 columns. For almost all the biphenyl columns tested, there is a large baseline rise seen between 3.5–5.0 minutes. The column from vendor R has the largest baseline rise in this retention time window while columns from other vendors have smaller baseline rises at various points in the gradient such as the columns from vendor M and vendor C. The XBridge Biphenyl Column was the only biphenyl column that did not exhibit any detectable column bleed when using a mobile phase containing 0.1% TFA (pH 2).
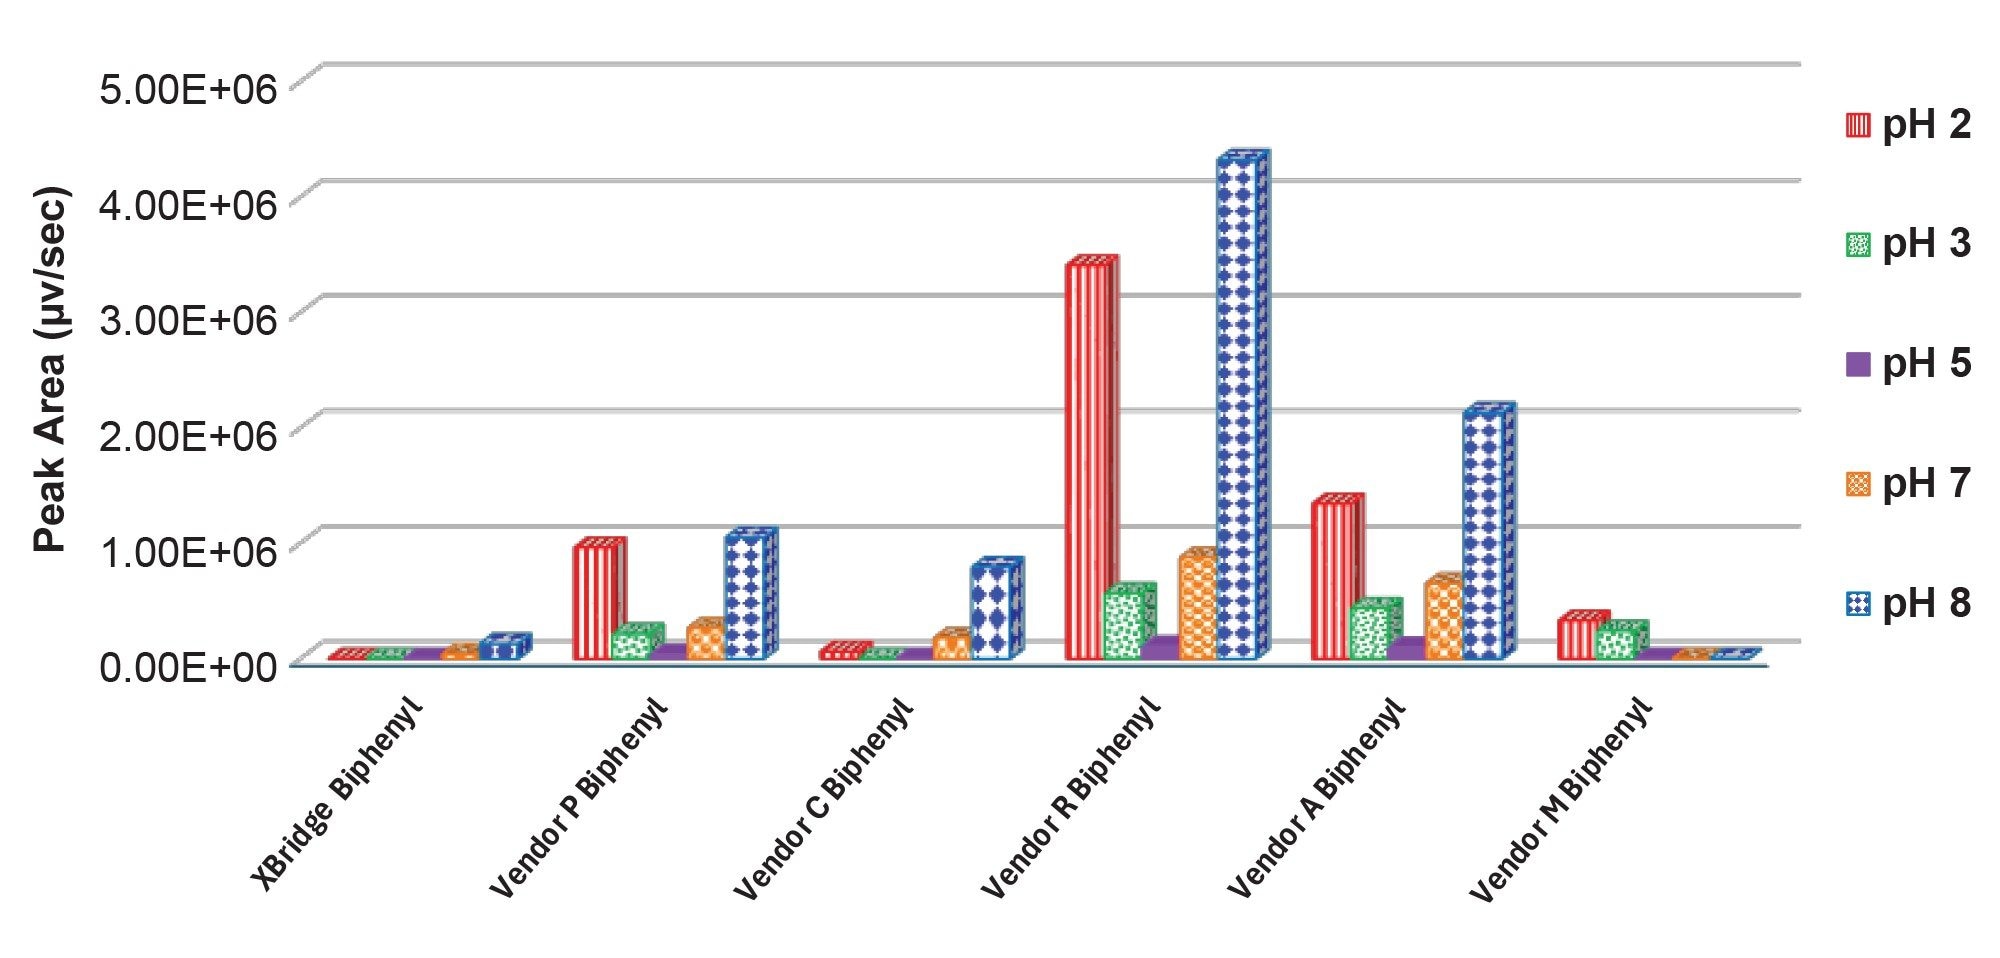
The columns were tested using 4 other mobile phase pH values with results similar to that seen in Figure 6. After each column was tested, the baseline rise was integrated, and the peak area was calculated. An XBridge Biphenyl Column was tested along with the biphenyl columns from other vendors. All peak area results are shown in Figure 7. The column from vendor R had the greatest column bleed across all five pH conditions. Across all the pH conditions, the XBridge Biphenyl Column had the lowest amount of column bleed in comparison to the other biphenyl columns tested. The reduced UV-detected column bleed, especially under acidic conditions, enables more reliable peak detection and integration in gradient separations. This differentiates the XBridge Biphenyl Columns from the other biphenyl columns currently on the market.
Selectivity Evaluation I
Selectivity is a measure of the ability of a stationary phase to separate analytes. Chromatographic selectivity is essential in many methods to properly distinguish between analytes.12 The Tanaka test was originally developed to characterize the selectivity of different C18 stationary phases.13 Certain pairs of analytes were selected to calculate selectivity (α - the ratio of retention factors for 2 peaks) for different types of interactions. The primary interaction for C18 stationary phases is the hydrophobic interaction.14 Additional interactions that may occur for certain analytes are hydrogen bonding, steric exclusion and ion-exchange. The Tanaka test used α(butylbenzene/amylbenzene) to assess hydrophobic selectivity, α(caffeine/theophylline) to assess hydrogen bonding selectivity, α(triphenylene/o-terphenyl) to assess steric selectivity and α(benzylamine/phenol) as an indicator of ion-exchange capacity at pH 2.7 and 7.6.14
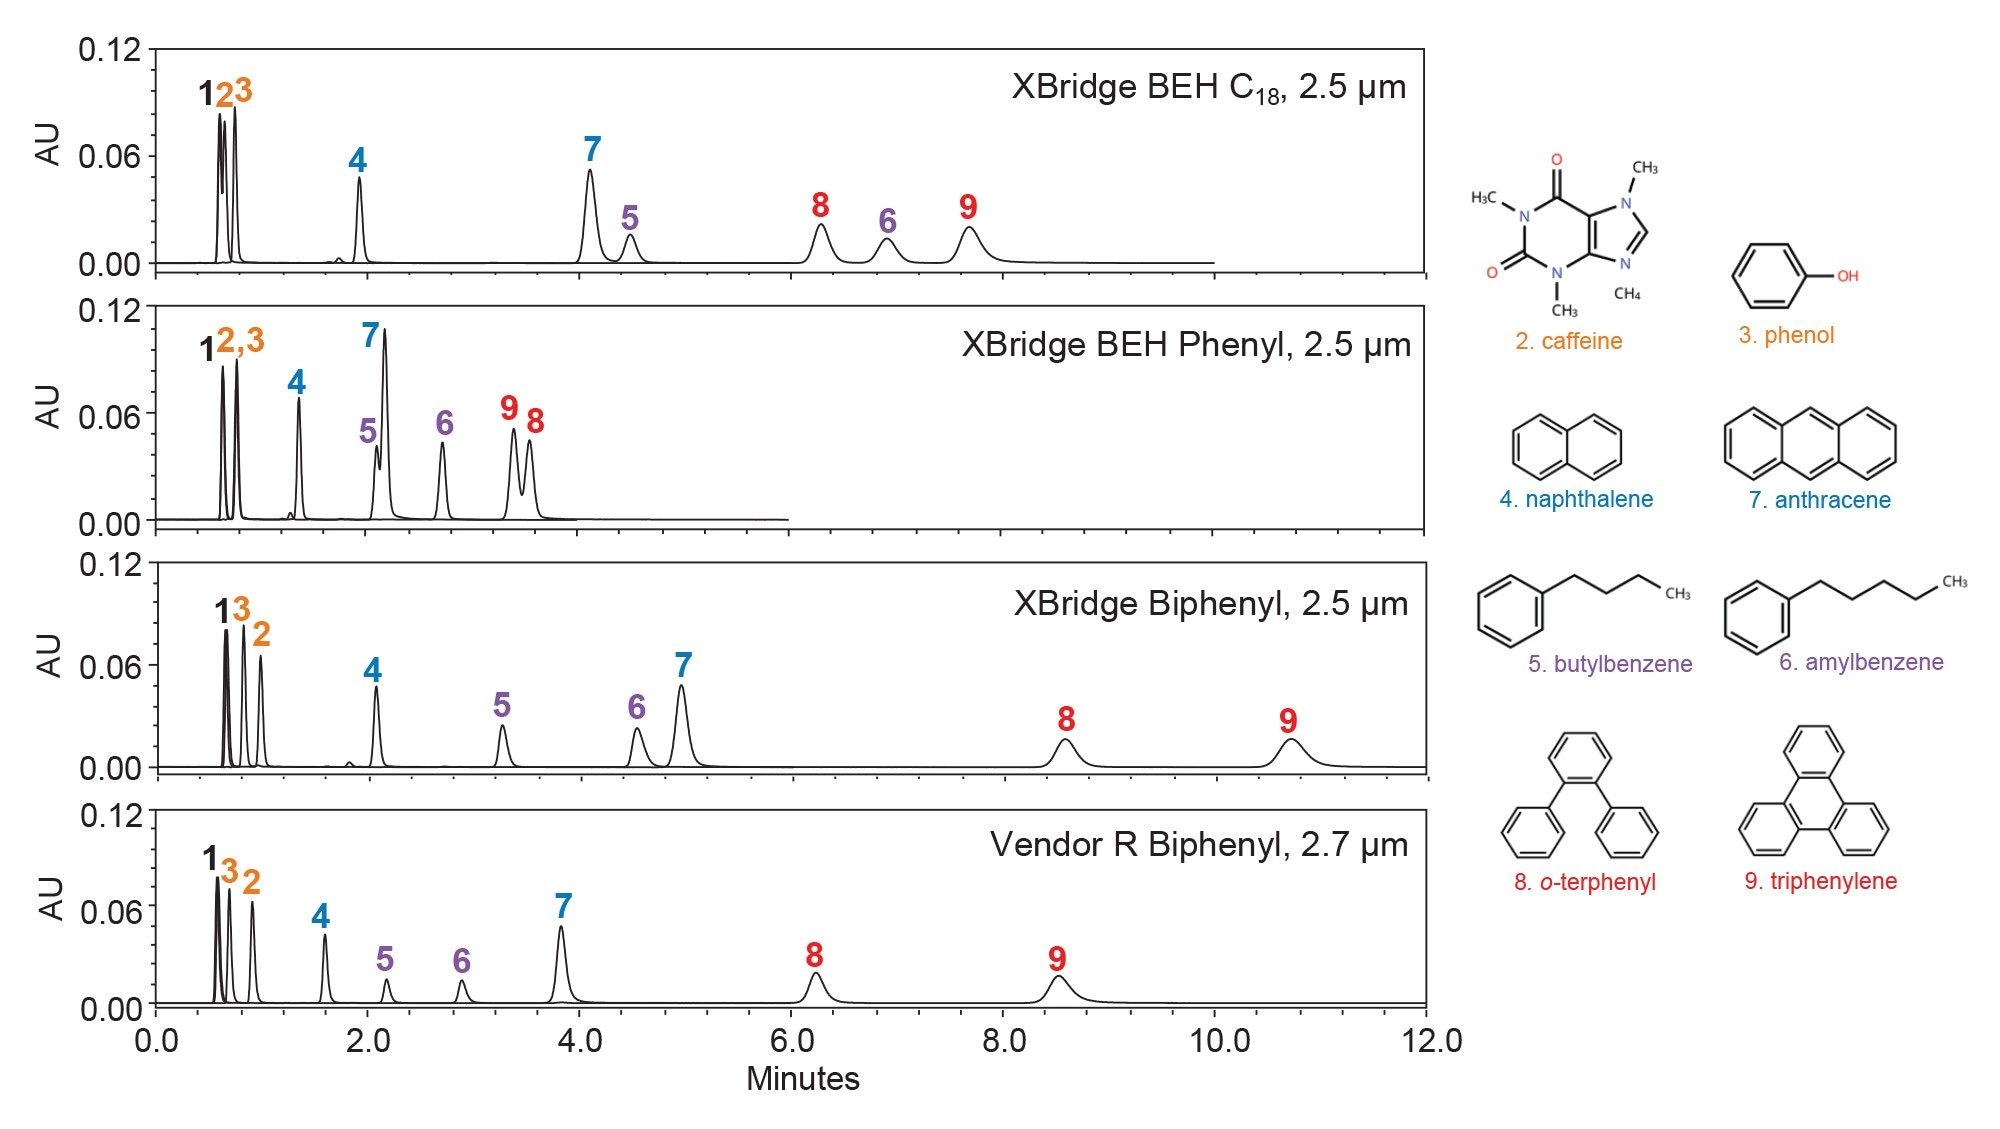
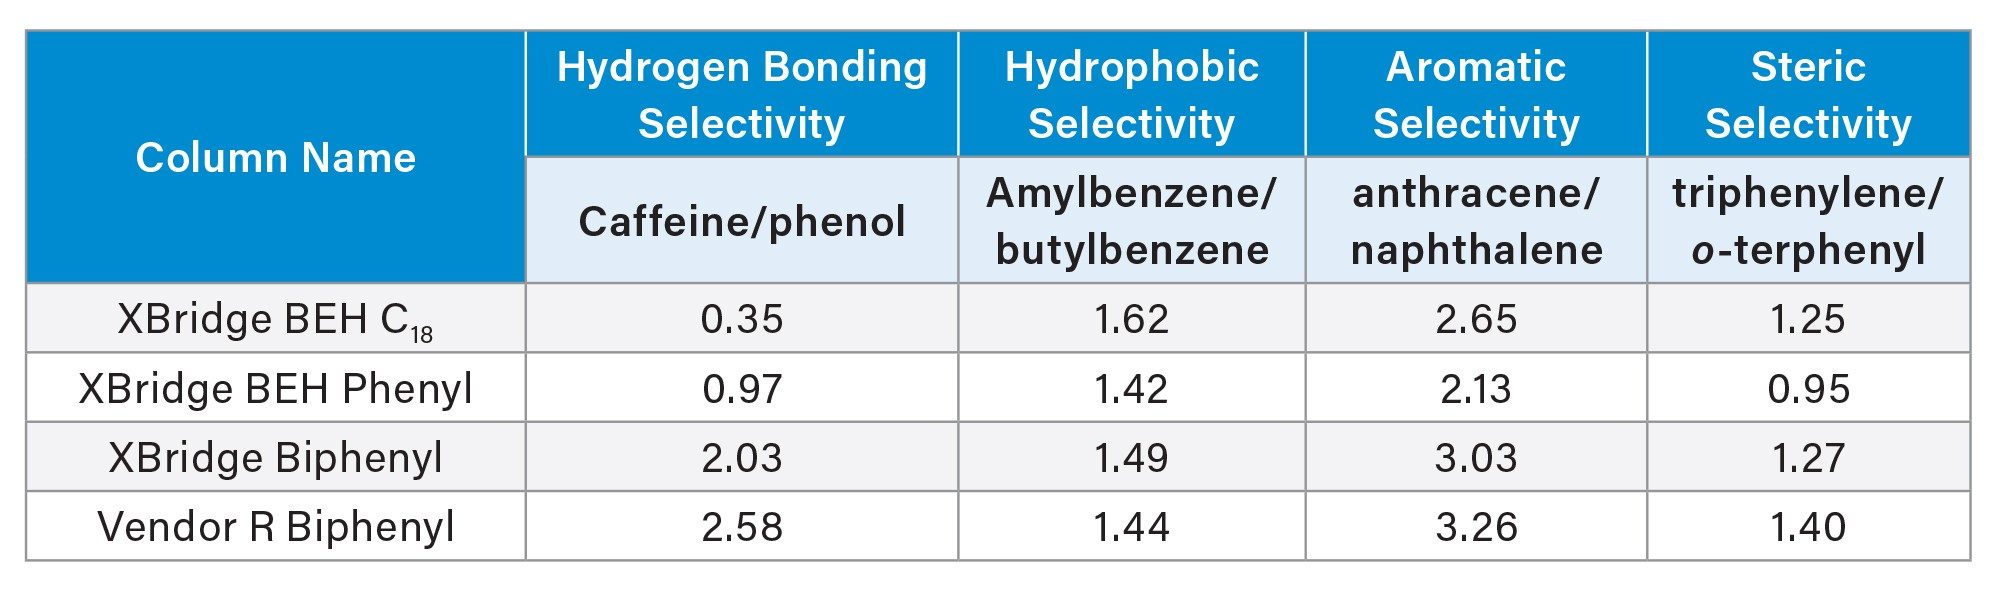
To add an assessment of π–π interactions, a modified version of the Tanaka test was developed in which naphthalene and anthracene were added. An XBridge BEH C18 Column, an XBridge BEH Phenyl Column, an XBridge Biphenyl Column and a biphenyl column from vendor R were tested in this evaluation. The mobile phase was 70/30 (v/v) methanol/water and columns were tested at a temperature of 40 °C for this evaluation. Figure 8 shows the chemical structure of each of these analytes along with the chromatograms for each column tested. The XBridge BEH Phenyl Column had the lowest retention overall and was only able to resolve some of the analytes. Butyl- and amylbenzene (peaks 5 and 6) were retained the longest on the XBridge BEH C18 Column, while the XBridge Biphenyl Column retained naphthalene, anthracene, o-terphenyl and triphenylene (peaks 4, 7, 8, and 9) the longest in comparison to the other columns tested. The values for hydrogen bonding selectivity, hydrophobic selectivity, aromatic selectivity and steric selectivity for each column are shown in Table 3 below. There are modest differences in the hydrophobic selectivity and steric selectivity among the four columns. However, the hydrogen bonding selectivity was significantly greater for both the XBridge Biphenyl Column and the vendor R Biphenyl Column. Further studies have cast doubt on the interpretation of α(caffeine/phenol) as an indicator of hydrogen-bonding interactions,1 and the larger values seen for the biphenyl columns may be due to π–π or other interactions. The XBridge Biphenyl Column had greater aromatic selectivity compared to the XBridge BEH Phenyl and XBridge BEH C18 Columns. The biphenyl column from vendor R had slightly greater aromatic selectivity when compared to the Waters XBridge Biphenyl Column indicating modest selectivity differences between the two biphenyl columns.
Methanol was chosen as the solvent in this evaluation to accentuate the π–π interactions between the stationary phase and the analytes. Previous evaluations using acetonitrile as the organic solvent have shown that it may reduce the aromatic selectivity of biphenyl columns. This is likely due to potential charge transfer between π electrons of the solvent and stationary phase in a reverse-phase environment.1
Selectivity Evaluation II
The modified Tanaka test provides an assessment of the hydrogen-bonding, hydrophobic, aromatic and steric selectivity of biphenyl stationary phases, but it is not the sole indicator of column selectivity. For a second evaluation a panel of 27 compounds comprised of acidic, neutral, and basic analytes with aromatic groups was used. Gradient separations were performed using a pH 3.0 ammonium formate buffer for the aqueous component and methanol for the organic component and kg values were determined for each column. Figure 9 displays the chromatograms obtained for an XBridge BEH C18 Column, an XBridge BEH Phenyl Column and an XBridge Biphenyl Column. Compared to the XBridge BEH C18 Column, the XBridge BEH Phenyl Column gave lower retention for many of the analytes. In contrast, the XBridge Biphenyl Column gave comparable or greater retention for most of the analytes relative to the XBridge BEH C18 Column.
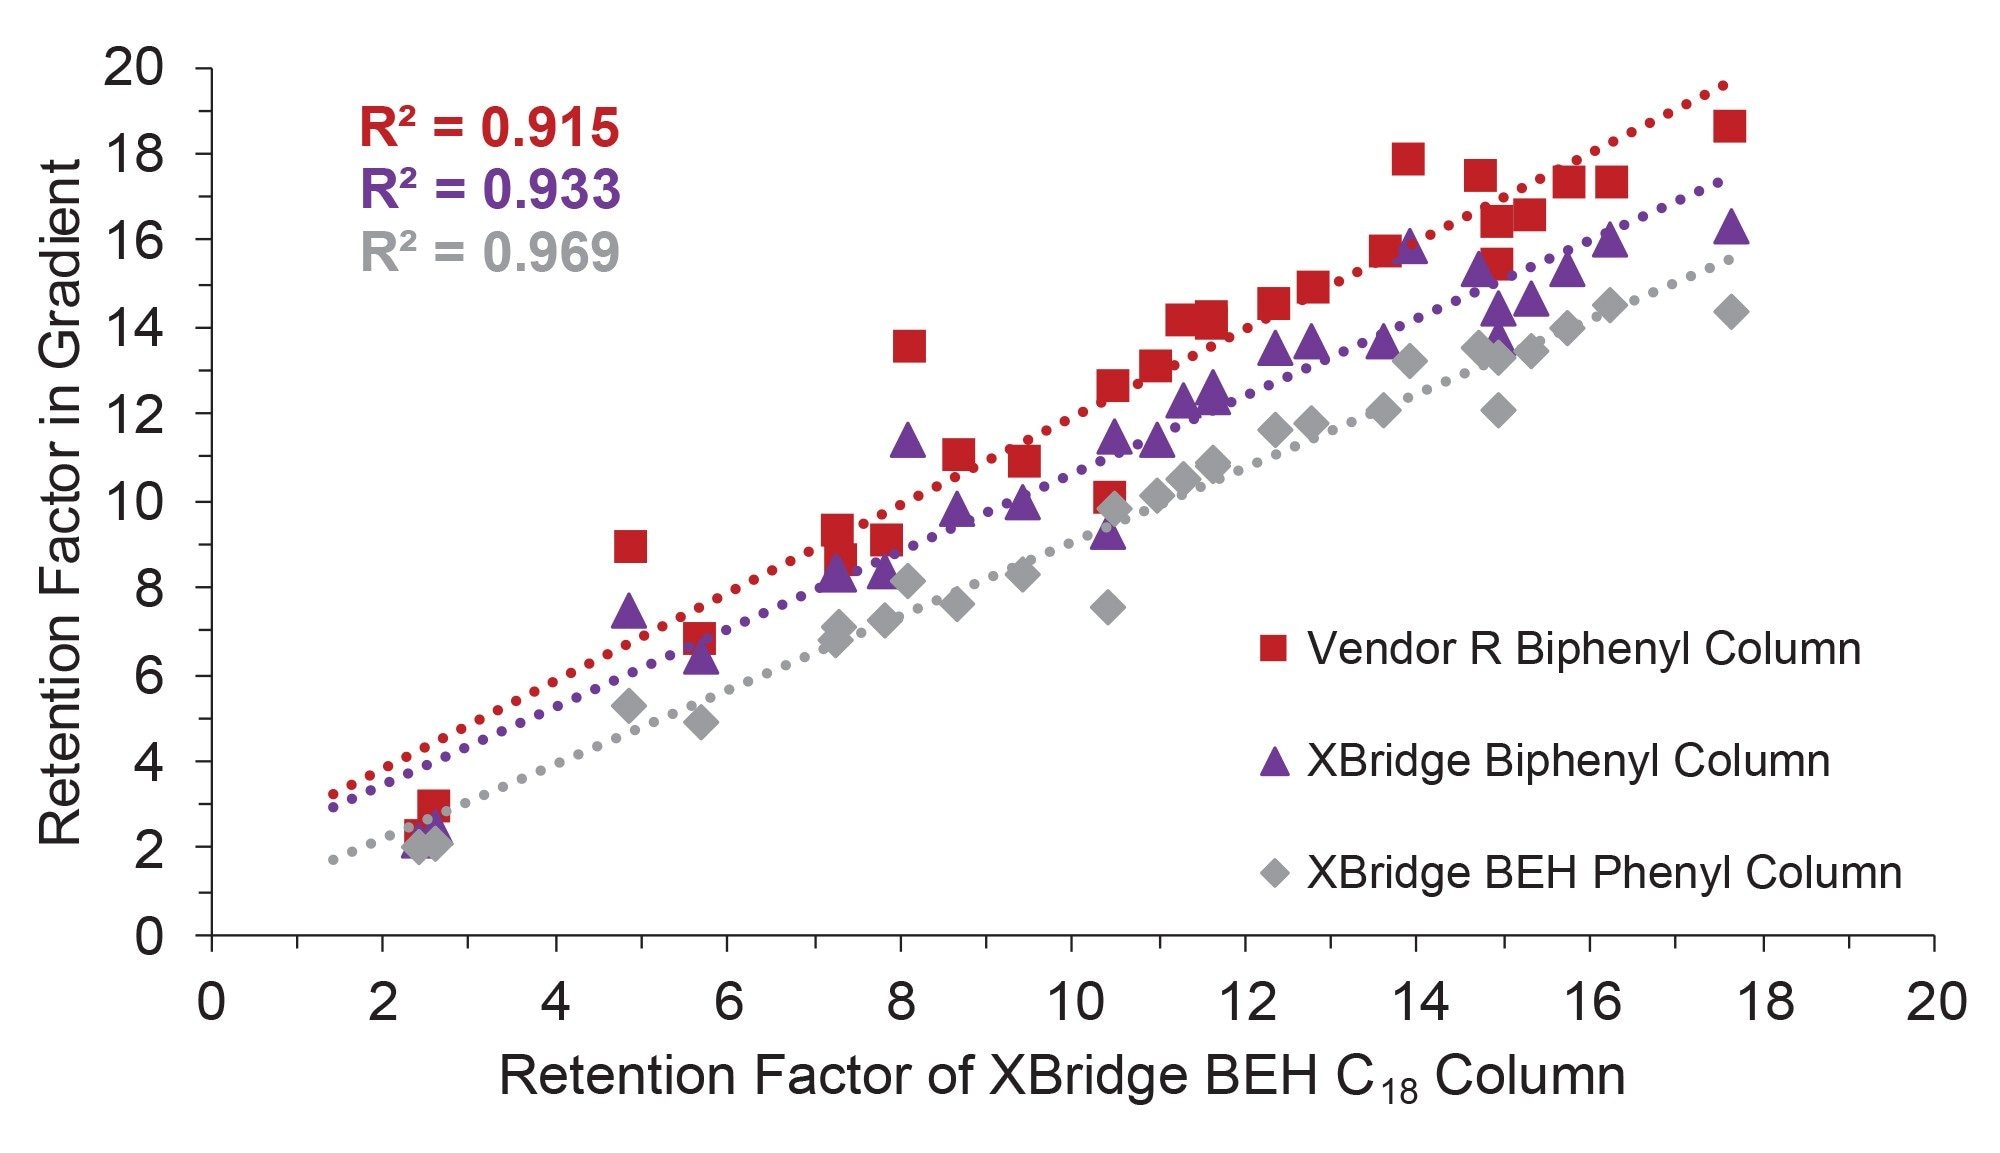
Figure 10 shows plots of the gradient retention factors (kg) for an XBridge BEH Phenyl Column, an XBridge Biphenyl Column and a biphenyl column from vendor R versus kg for an XBridge BEH C18 Column. Greater scatter of the data points was observed for the XBridge Biphenyl Column and the biphenyl column from vendor R. This increased scatter indicated greater selectivity differences relative to the XBridge BEH C18 Column. Selectivity values (S) between these columns were calculated as

where R is the correlation coefficient defined by the linear relationship between the kg plots.15 A higher S value indicates a larger selectivity difference between two columns. The results are shown in Table 4.
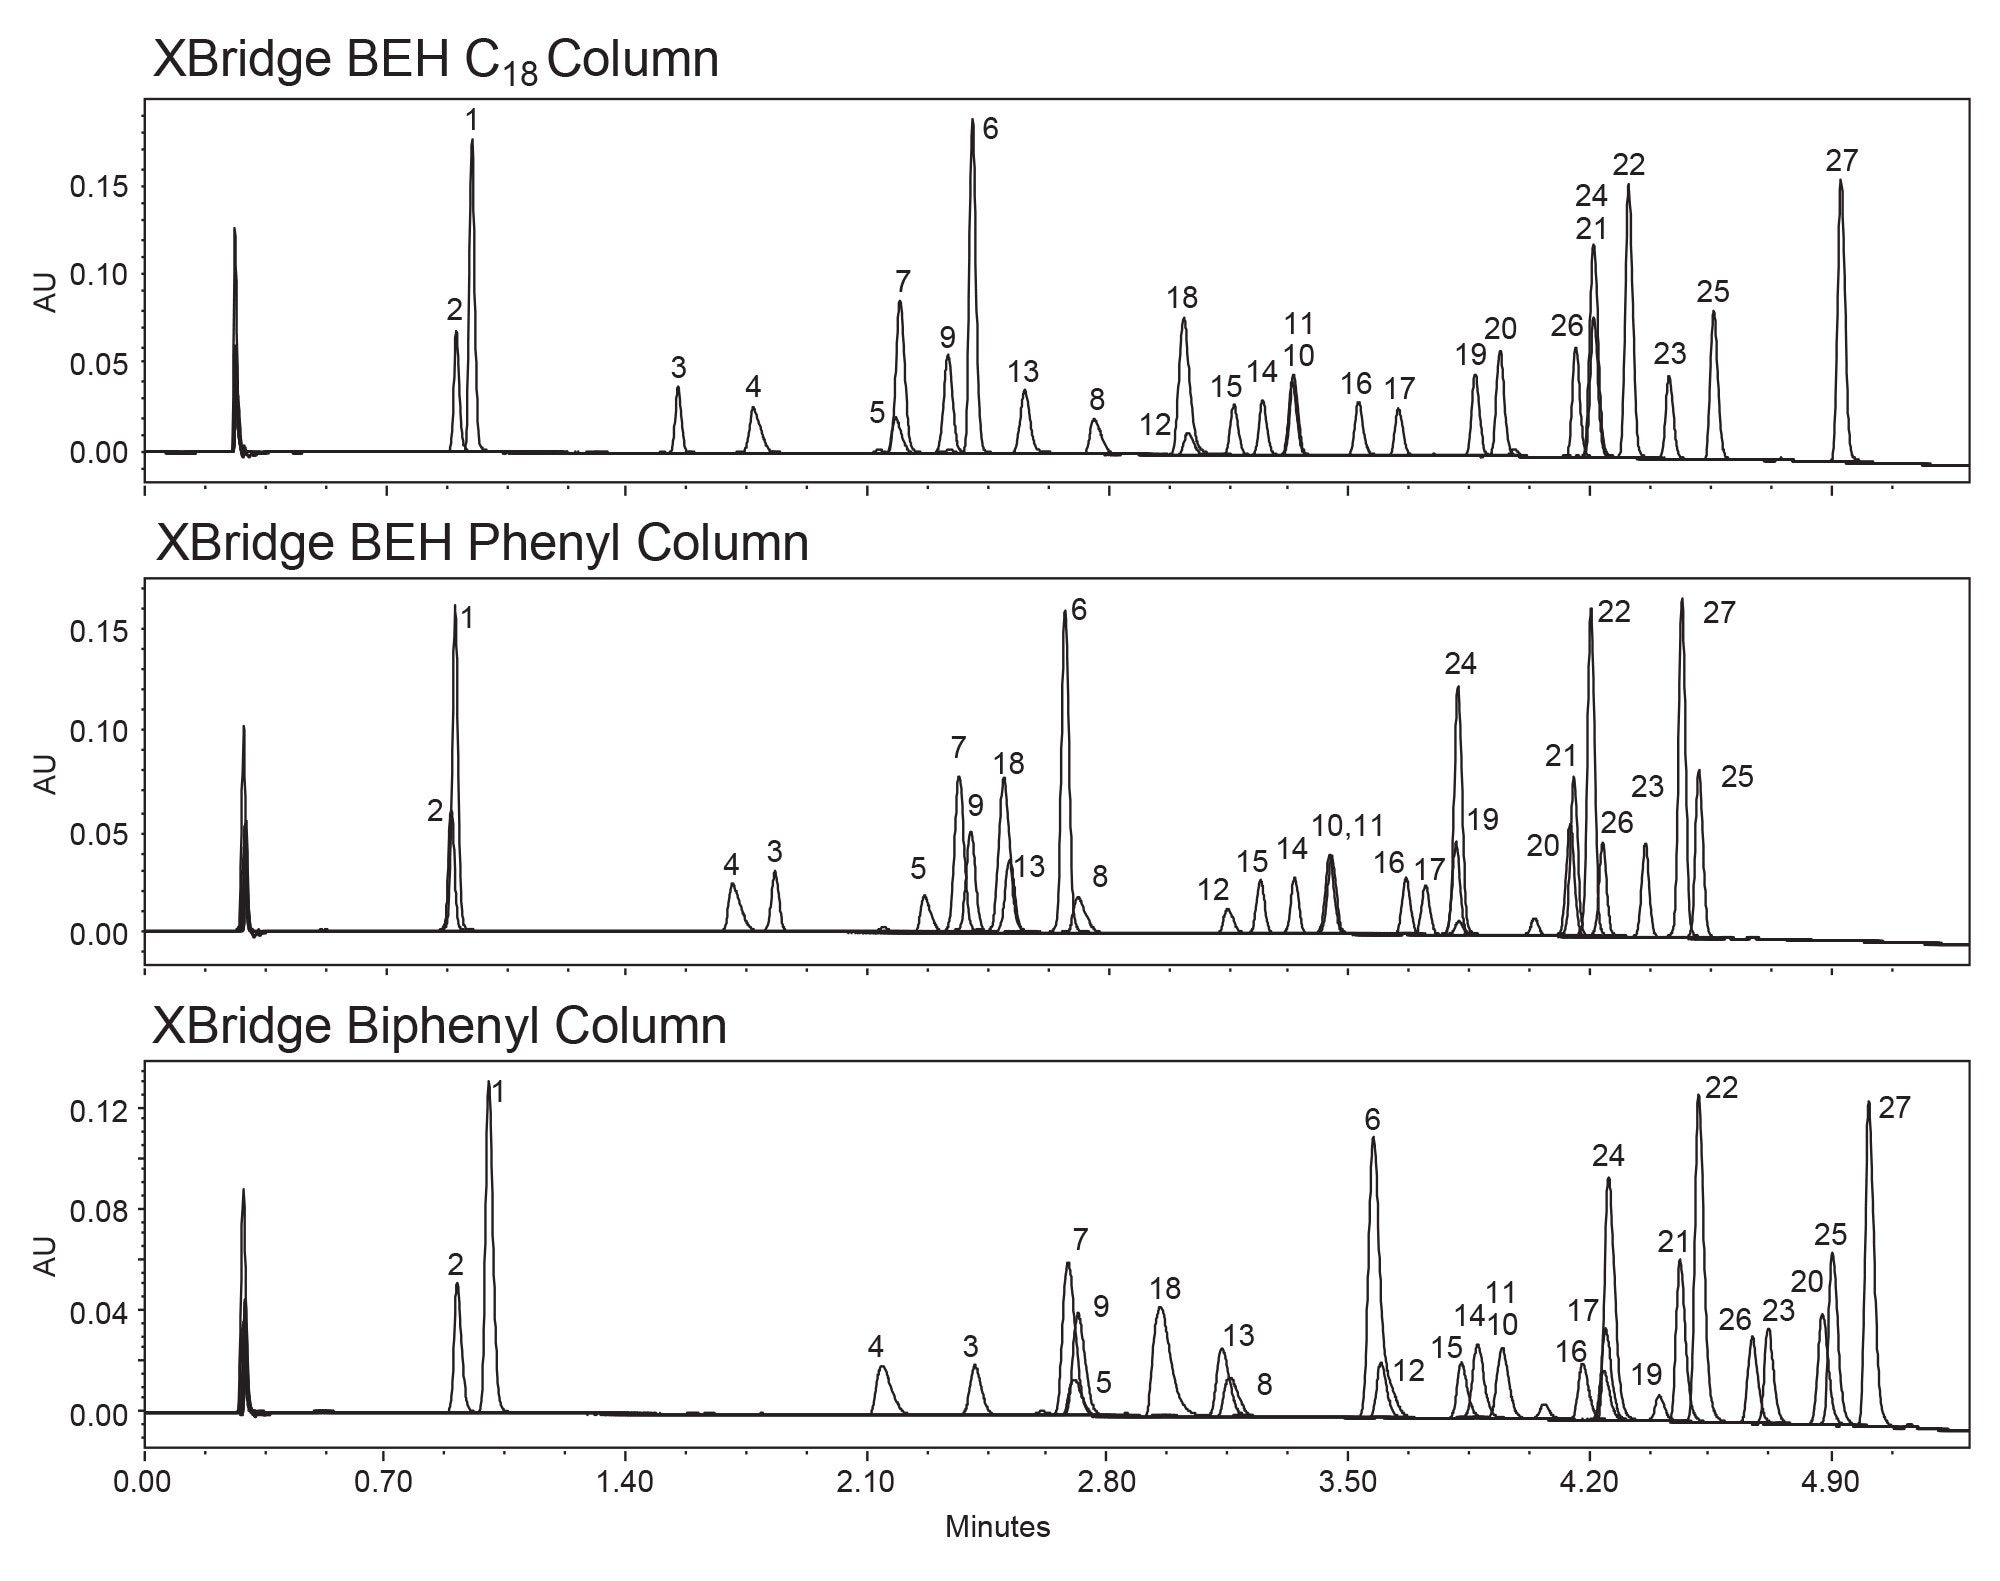
Figure 9. Selectivity Evaluation II; overlaid chromatograms for gradient separation of 27 analytes using three different columns.
Peak identification: 1) acetaminophen, 2) resorcinol, 3) caffeine, 4) lidocaine, 5) metoprolol, 6) papaverine, 7) 4-nitrophenol, 8) bupivacaine, 9) 3-nitrophenol, 10) prednisolone, 11) hydrocortisone, 12) diphenhydramine, 13) 2-nitrophenol, 14) carbamazepine, 15) phenytoin, 16) imipramine, 17) amitriptyline, 18) benzene, 19) naproxen, 20) diazepam, 21) fenoprofen, 22) flurbiprofen, 23) diclofenac, 24) naphthalene, 25) tamoxifen, 26) phenylbutazone, 27) anthracene
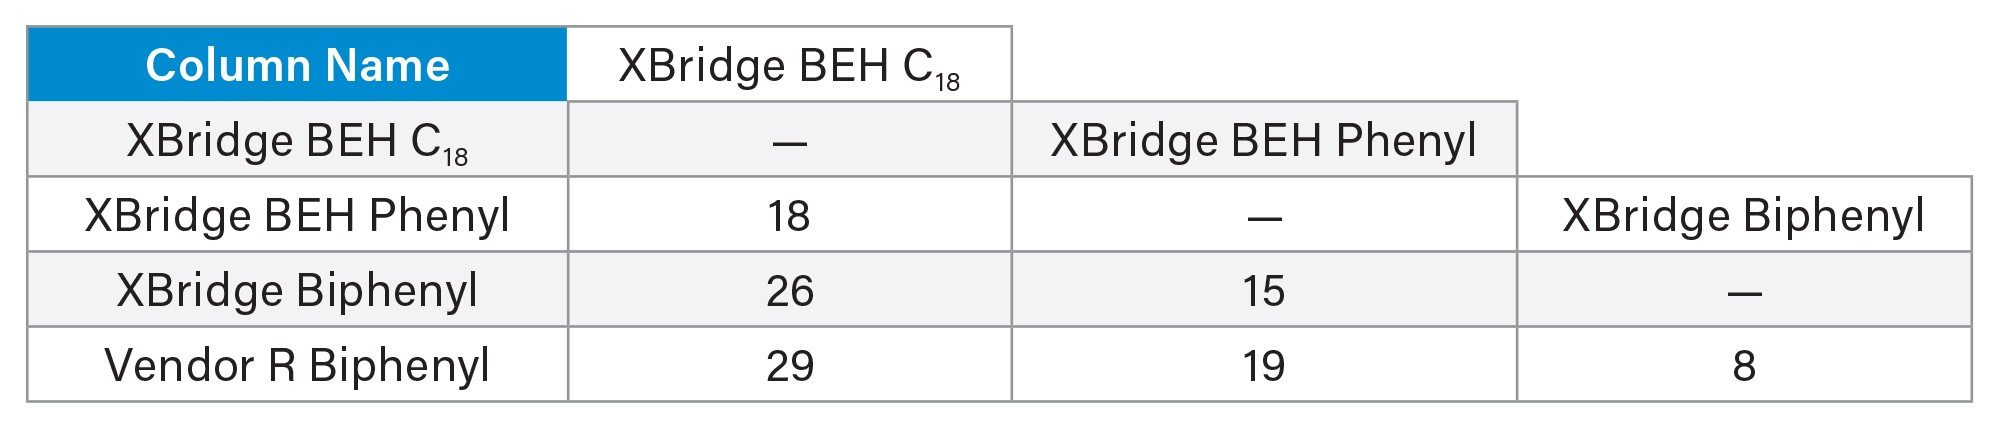
The S-value for the XBridge Biphenyl Column vs the BEH C18 Column was calculated to be 26, indicating a substantial selectivity difference between the columns. The S-value of 15 for the XBridge Biphenyl Column vs the BEH Phenyl Column shows that the selectivity difference is smaller, but still significant. The XBridge Biphenyl Column had a calculated S-value of 8 in comparison to the Biphenyl Column from vendor R indicating that there is a much smaller difference in selectivity between these columns.
Batch – to – Batch Reproducibility
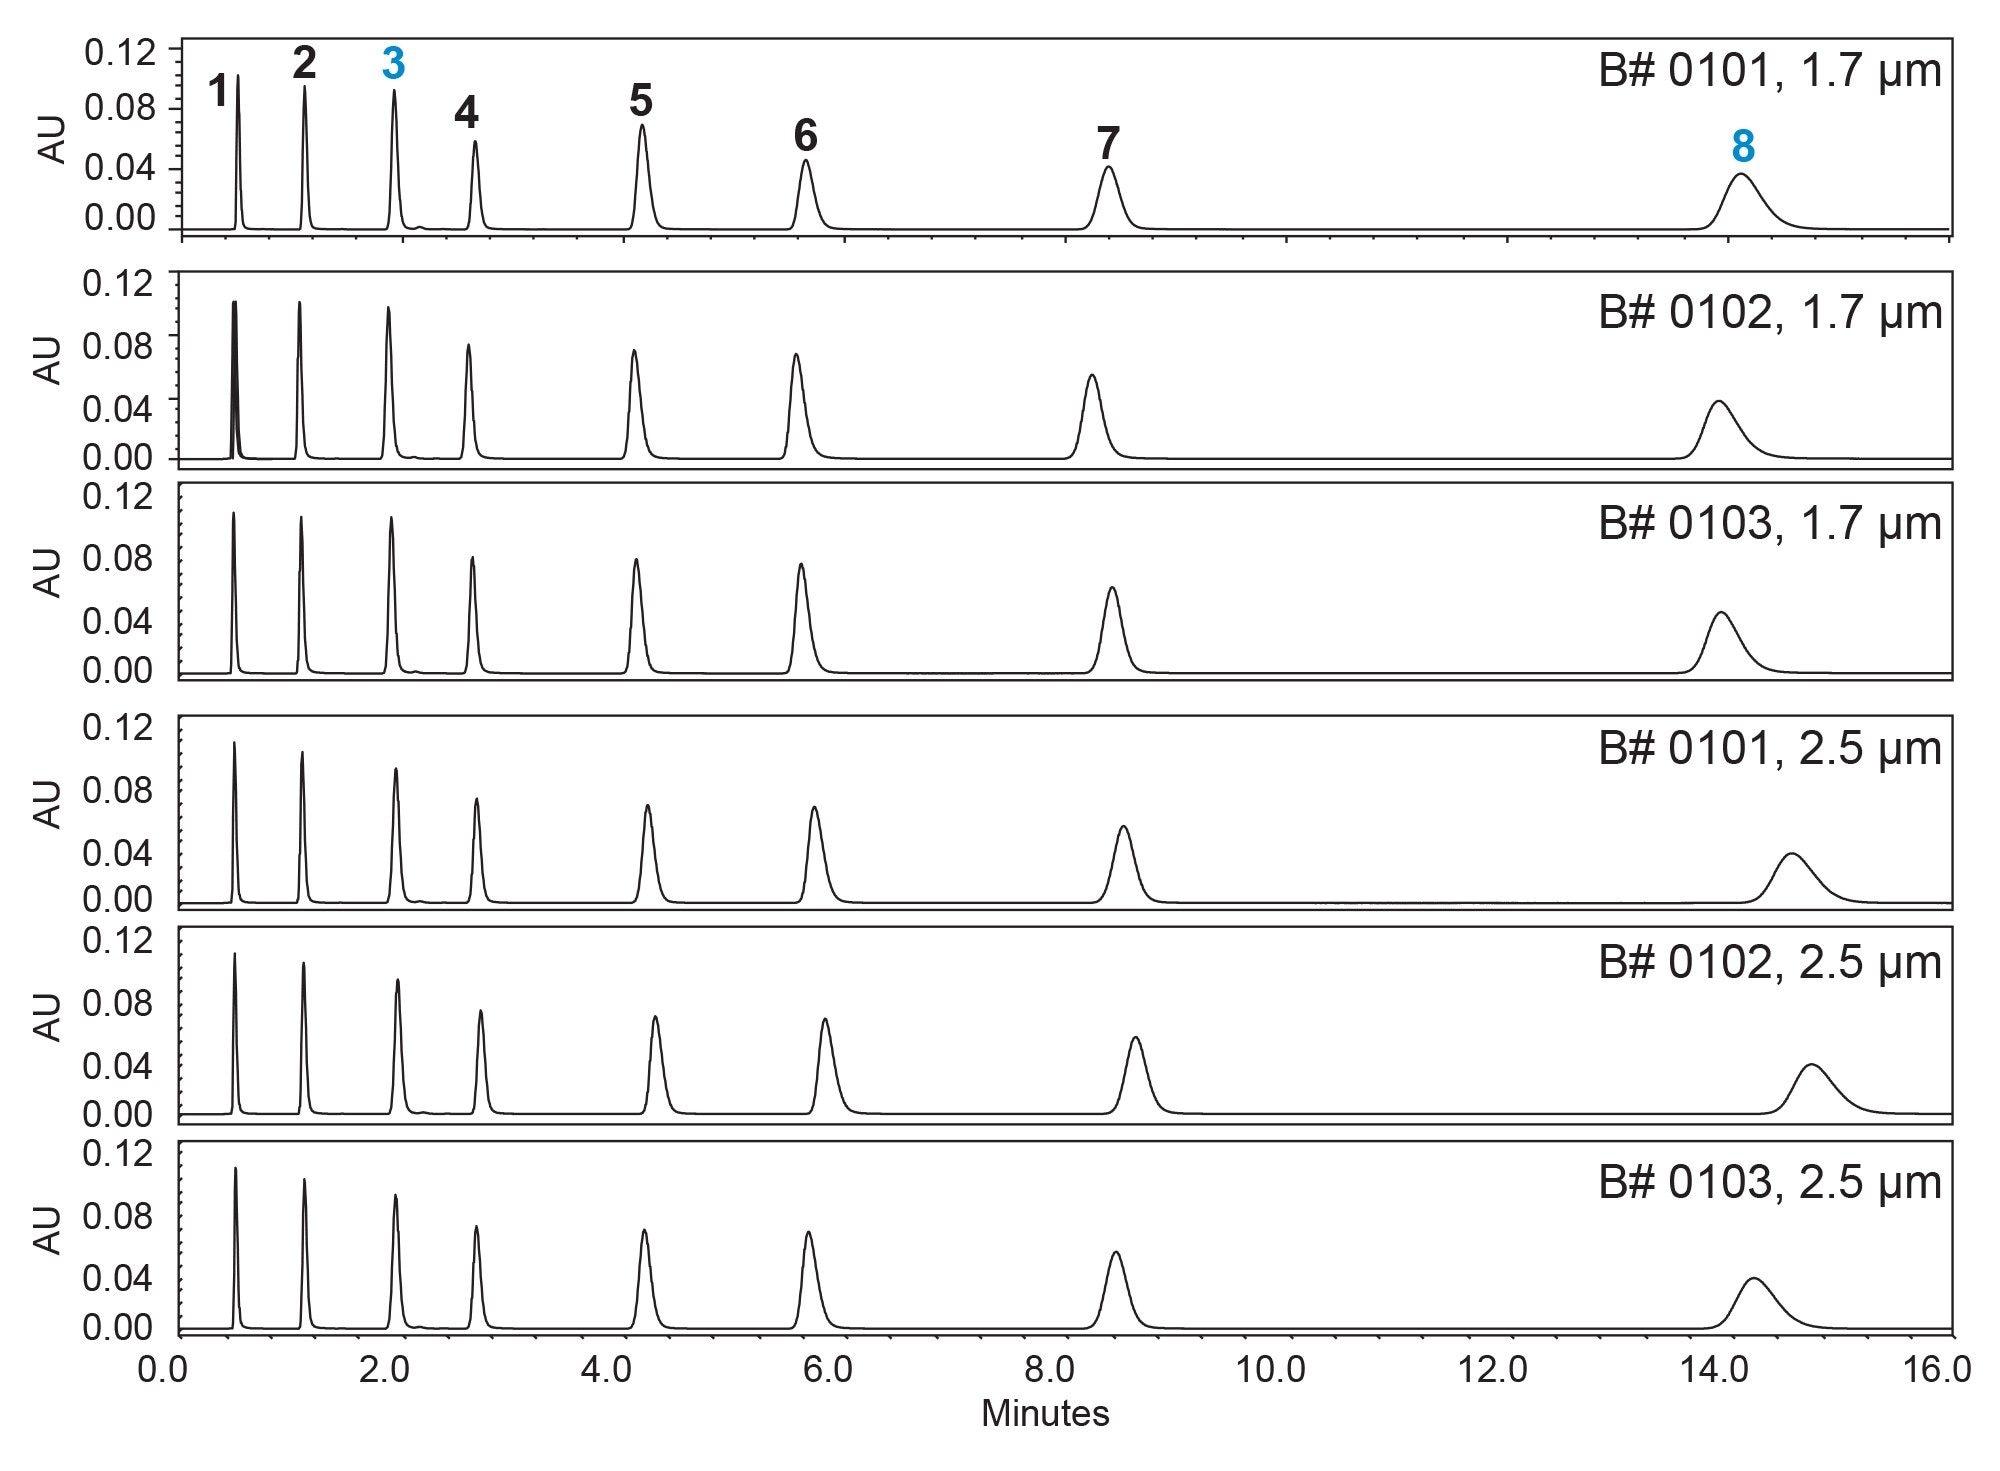
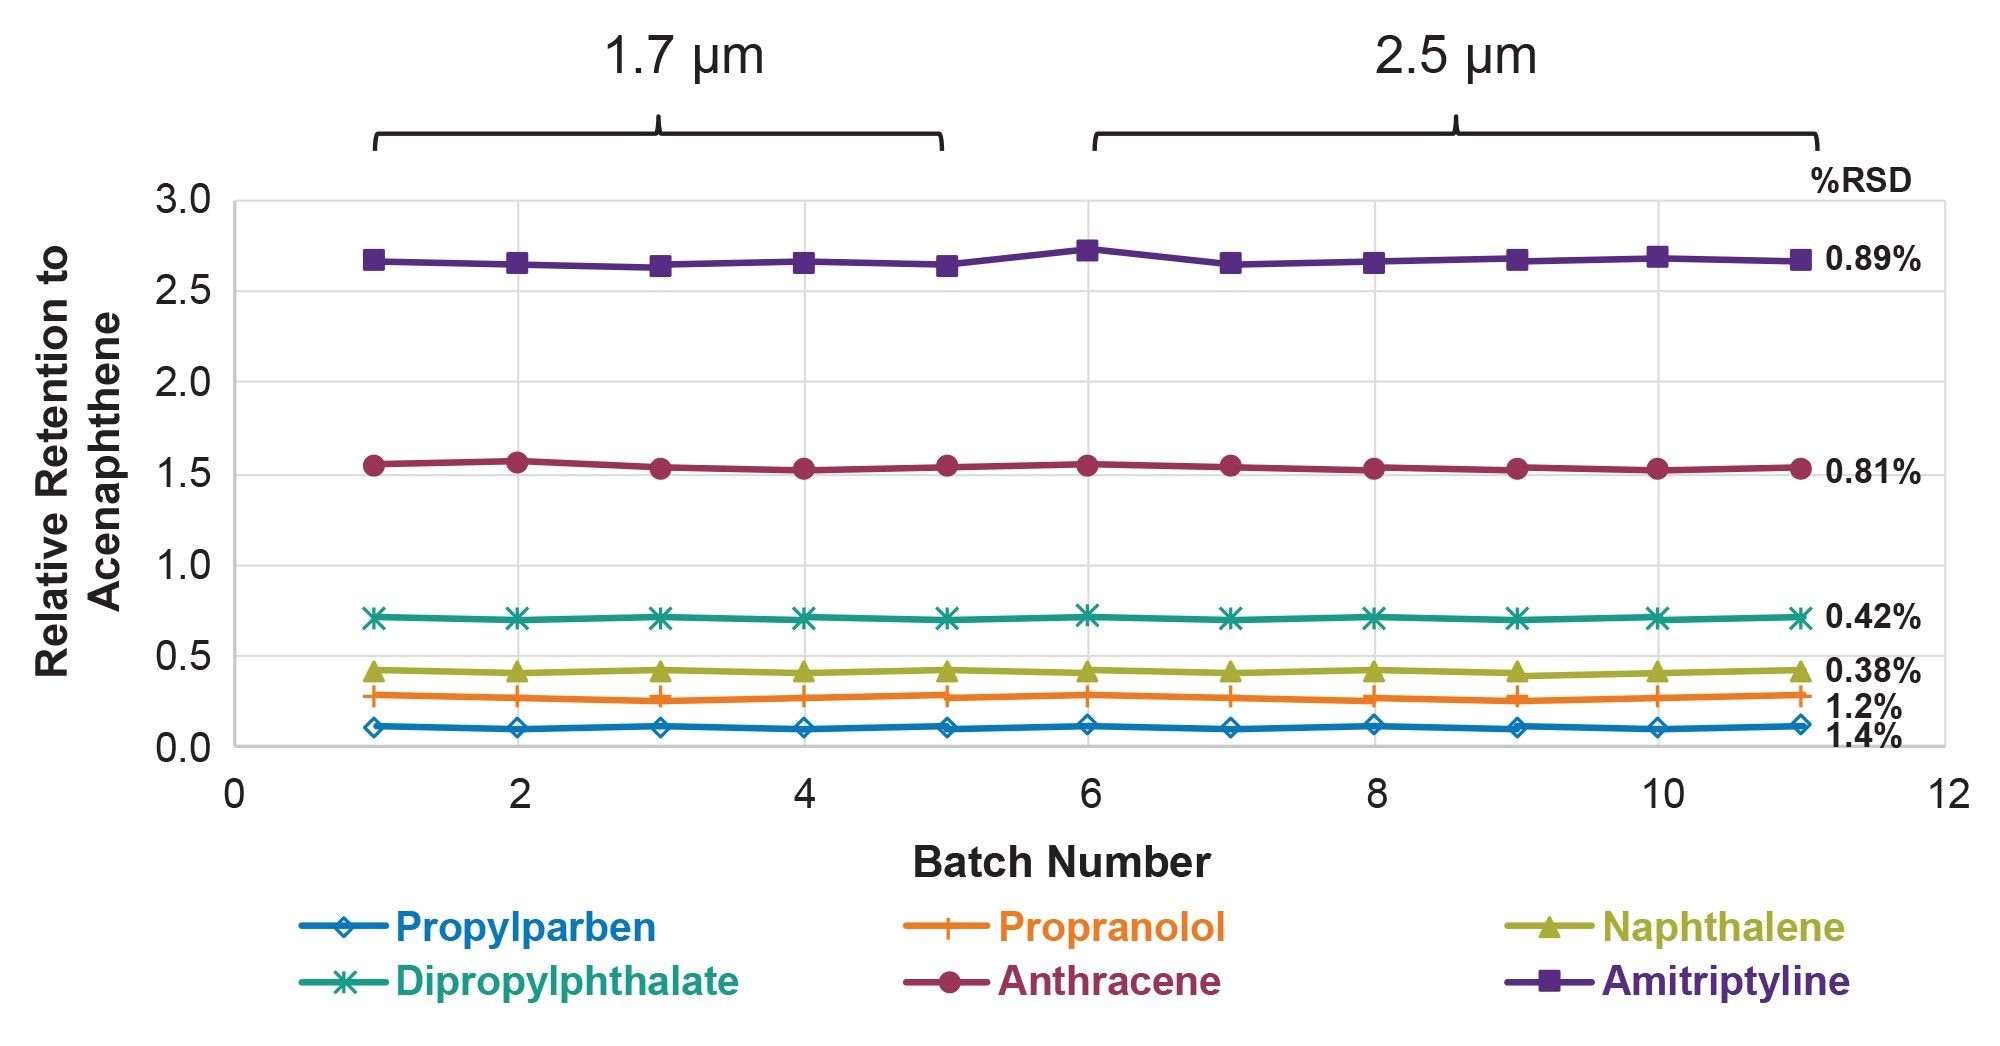
Similar to BEH C18,16 the XBridge Biphenyl material was designed to have excellent batch-to-batch reproducibility. The chromatographic reproducibility of Waters Acquity and XBridge Biphenyl columns were assessed for 11 batches, 5 of 1.7 and 6 of 2.5 µm using a separation of 8 analytes. The chromatographic results for 3 representative batches of each particle size are shown in Figure 11 which demonstrates the consistent retention times and peak shapes between the different batches. The relative standard deviations (RSD) for the relative retention values are shown in Figure 12. The RSDs range from 0.4 to 1.4% which are small windows of variation. The chromatographic data and calculated RSD values demonstrate exceptional reproducibility both within and between particle sizes, enabling seamless scalability between columns packed with particles of different size.
Conclusion
This application note provided an overview of the characteristics of a new biphenyl stationary phase that offers different selectivity in comparison to C18 and phenyl bonded phases. Excellent batch-to-batch reproducibility of the BEH Biphenyl material was demonstrated. Relative retention RSD values were <2% for 11 different batches. Under accelerated acidic and basic conditions, Waters Acquity and XBridge Biphenyl RP Columns with MaxPeak Premier Technology lost less than 10% k, outperforming biphenyl columns from other vendors. Column bleed - widely recognized as a major limitation of biphenyl stationary phases when using UV detection - is minimized in the Waters Acquity and XBridge Biphenyl columns and is significantly lower than observed for biphenyl columns from other vendors. This clearly differentiates the Waters Acquity and XBridge Biphenyl column from other biphenyl columns currently on the market. These combined attributes of reproducibility, pH stability and reduced column bleed make Waters Acquity and XBridge Biphenyl RP Columns with Max Peak Premier Technology a robust and reliable choice for achieving alternative chromatographic selectivity through increased π–π interactions vs C18 and phenyl columns across a wide range of applications.
References
- H. Cramer, D. S. Bell, D. L. Shollenberger, Evaluation of Retention and Selectivity Using Biphenyl Stationary Phases. LCGC North Am. 35 (2017) 360–365.
- J. M. Lindner, M. Vogeser, S. H. Grimm, Biphenyl based stationary phases for improved selectivity in complex steroid assays. J. Pharm. Biomed. Anal. 142 (2017) 66–73.
- A. Taniguchi, T. Hirose, M. Shimotsuma, Retention and Selectivity Differences due to Molecular Structure of Phenyl—Type Reversed—Phase HPLC Columns. Chromatography 46 (2025) 55–61.
- M. DeLano, T. H. Walter, M. A. Lauber, M. Gilar, M. C. Jung, J. M. Nguyen, C. Boissel, A. V. Patel, A. Bates-Harrison, K. D. Wyndham, Using Hybrid Organic-Inorganic Surface Technology to Mitigate Analyte Interactions with Metal Surfaces in UHPLC, Anal. Chem. 93 (2021) 5773-5781. doi: 10.1021/acs.analchem.0c05203.
- “Biphenyl.” National Center for Biotechnology Information. PubChem Compound Database, U.S. National Library of Medicine, pubchem.ncbi.nlm.nih.gov/compound/7095. Accessed 3 Nov. 2025.
- S. E. Wheeler, Understanding substituent effects in noncovalent interactions involving aromatic rings. Acc. Chem. Res. 46 (4) (2013) 1029–1038. https://doi.org/10.1021/ar300109n.
- D. S. Bell, A. I. Green, D. A. Lopez, What Is on Your HPLC Particle? A Look at Stationary Phase Chemistry Synthesis. LCGC International. 38 (9) (2020) 488–493.
- B. C. Trammell, C. A. Boissel, C. Carignan, D. J. O’Shea, C. J. Hudalla, U. D. Neue and P. C. Iraneta, “Development of an accelerated low-pH reversed-phase liquid chromatography column stability test”, J. Chromatogr. A 1060 (2004) 153–163.
- K. D. Wyndham, J. E. O’Gara, T. H. Walter, K. H. Glose, N. L. Lawrence, B. A. Alden, G. S. Izzo, C. J. Hudalla and P. C. Iraneta, “Characterization and Evaluation of C18 HPLC Stationary Phases Based on Ethyl-Bridged Hybrid Organic/Inorganic Particles”, Anal. Chem., 75 (2003) 6781-6788, doi: 10.1021/ac034767w.
- “Biphenyl.” NIST Chemistry WebBook, National Institute of Standards and Technology (2025) webbook.nist.gov/cgi/cbook.cgi?ID=C92524&Mask=400. Accessed 3 Dec. 2025.
- J. W. Dolan, Gradient Elution, Part V: Baseline Drift Problems, LCGC North Am. 31 (2013) 538–543.
- E. Ross. Choosing the Correct Column for Chromatographic Selectivity. Waters Blog, Waters Corporation, 28 July 2022, www.waters.com/blog/choosing-the-correct-column-for-chromatographic-selectivity/.
- X. Subirats, M. Rosés. “Characterization of HPLC columns: a comparison of Tanaka and Abraham methods.” J. Chromatogr. A . 1762 (2025) 466376.
- K. Kimata, K. Iwaguchi, S. Onishi, K. Jinno, R. Eksteen, K. Hosoya, M. Araki, N. Tanaka, Chromatographic characterization of silica C18 packing materials. Correlation between a preparation method and retention behavior of stationary phase, J. Chromatogr. Sci. 27 (12) (1989) 721–728.
- U. D. Neue, J. E. O’Gara, A. Méndez. “Selectivity in reversed-phase separations Influence of the stationary phase”, J. Chromatogr. A 1127 (2006) 161–174.
- T. H. Walter, J. Yang, Assessment of the reproducibility of a C18 bonded phase based on ethylene-bridged hybrid organic/inorganic particles. J. Chromatogr. A . 1716 (2024) 464637.
720009261, February 2026