• アプリケーションノート

Gradient Method Scaling for Life Cycle Management of a USP Impurities Method

Gradient Method Scaling for Life Cycle Management of a USP Impurities Method

  • Amanda B. Dlugasch
  • Jennifer Simeone
  • Patricia R. McConville
  • Waters Corporation
Quetiapine molecule structure

Abstract

In this study, the USP impurity monograph for quetiapine fumarate will be scaled to smaller particle sized columns using the Waters Columns Calculator. The scaled methods will then be compared to the original HPLC method to ensure no loss of chromatographic or quantitative performance. The scaled methods provide decreased run times and solvent consumption while providing equivalent chromatographic performance.

Benefits

  • The Waters Columns Calculator enables users to geometrically scale methods
  • Improved throughput is obtained by scaling HPLC columns to those with smaller particle sizes and shorter column lengths
  • The quetiapine fumarate impurities method run time was reduced by 51% using a 2.5 μm column with a UHPLC system and 75% using a 1.7 μm column with a UPLC system
  • Equivalent chromatographic and quantitative performance was achieved for the quetiapine fumarate impurities method across all separations

Introduction

Pharmaceutical companies often follow compendial high performance liquid chromatography (HPLC) methods for the analysis of raw materials and finished products. However, modernization of older HPLC methods, which can include scaling or transfer1 of a method to new column or LC technologies should be considered as part of pharmaceutical lifecycle management.2 The successful scaling of a method requires the proper adjustment of various method parameters including column particle size and dimension, flow rate, injection volume, and gradient timing.

In this study, the USP impurity monograph for quetiapine fumarate3 will be scaled to smaller particle sized columns using the Waters Columns Calculator. The scaled methods will then be compared to the original HPLC method to ensure no loss of chromatographic or quantitative performance. The scaled methods provide decreased run times and solvent consumption while providing equivalent chromatographic performance.

Chemical structures of quetiapine fumarate, and its impurities.
Figure 1. Chemical structures of quetiapine fumarate, and its impurities, quetiapine related compound B, quetiapine related compound G, and quetiapine desethoxy.

Experimental

Sample description

The quetiapine fumarate standard (catalog#: 1592704), and the quetiapine system suitability standard (catalog#: 1592715) were purchased from the United States Pharmacopeia. The unknown quetiapine fumarate sample was purchased from Alibaba.com.

All solutions were prepared to the designated concentrations per the USP monograph. The system suitability and the standard solutions were prepared in the diluent comprised of Solution A: Solution B (86:14). The unknown sample solution was prepared in Solution A.

The concentrations of the solutions are 1.0 mg/mL for the system suitability solution, 0.001 mg/mL for the standard solution, and 1.0 mg/mL for the unknown sample solution.

Method conditions

Mobile phase:

Solution A: Acetonitrile and buffer (25:75)

Solution B:

Acetonitrile

Buffer:

3.1 g/L of ammonium acetate in water. 2 mL of 25% ammonium hydroxide was added to each 1 liter of solution. The final pH is not less than (NLT) 9.2

PDA wavelength:

250 nm at 4.8 nm resolution

Gradient

HPLC (min)

UHPLC (min)

UPLC (min)

Solution A (%)

Solution B (%)

0.0

0.0

0.0

100

0.0

25.0

11.90

6.07

100

0.0

60.0

28.57

14.57

29.3

70.7

60.1

28.62

14.6

100

0.0

68.0

32.38

16.51

100

0.0

70.0

34.0

17.00

100

0.0

LC systems and conditions

HPLC system:

Alliance e2695 Separations Module with 100 μL syringe, 2998 PDA Detector and CH-30 equipped with the passive column preheater

Column:

XBridge BEH C8, 3.5 μm, 4.6 mm × 150 mm (p/n: 186003055)

Sample temp.:

4 °C

Column temp.:

45 °C

Injection volume:

20.0 μL

Flow rate:

1.500 mL/min

Pre-injection volume:

NA

Run time:

70 minutes

UHPLC system:

ACQUITY Arc (path 2) with active solvent preheating (CH-30A) and 2998 PDA Detector

Column:

XBridge BEH C8 XP, 2.5 μm, 3.0 mm × 100 mm (p/n: 186006047)

Sample temp.:

4 °C

Column temp.:

45 °C

Injection volume:

5.7 μL

Flow rate:

0.893 mL/min

Pre-injection volume:

388 μL

Run time:

34 minutes

UPLC system:

ACQUITY UPLC H-Class PLUS with active solvent preheating (CH-30A), 50 μL extension loop and ACQUITY UPLC PDA Detector

Column:

ACQUITY UPLC BEH C8, 1.7 μm, 2.1 mm × 75 mm (p/n: 186005606)

Sample temp.:

4 °C

Column temp.:

45 °C

Injection volume:

2.1 μL

Flow rate:

0.644 mL/min

Pre-injection volume:

285 μL

Run time:

17 minutes

Data management

Empower 3 Chromatography Data Software, FR 4

Results and Discussion

Methodology

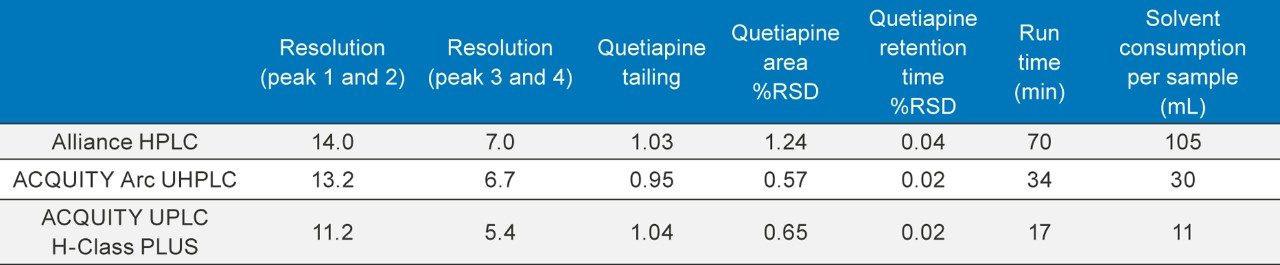
The quetiapine fumarate impurities USP method was first analyzed on the Alliance HPLC System using the described monograph conditions.3 Performance was evaluated based on the system suitability requirements as outlined in the monograph, which include resolution, tailing, and RSD for peak retention time and area. The column dimensions and method conditions were then geometrically scaled to columns with smaller particles.4 

The first step in method scaling is to select the column dimensions and particle size. The column selected should maintain the L/dp ratio, where L is the length of the column and dp is the diameter of the particle size. The L/dp ratio is critical to maintain the resolving power of the column.5

Once the appropriate column length and particle size are determined, the adjusted flow rate can be calculated. This ensures the same linear velocity is maintained from the original method to the scaled method. The modified flow rate is based on the internal diameter of the columns, the particle size of the columns, and the original flow rate using the following equation: 

F2 = F1 × (dp1/dc1) / (dp2/dc2

where F1 and F2 are the flow rates (mL/min) for the original and scaled method, respectively; dp1 and dp2 are the diameters of the particle sizes (µm) of the original and scaled methods, respectively, and dc1 and dc2 are the column diameters (mm) for the original and scaled method, respectively.6

In scaling methods, it is also important to adjust the injection volume to maintain sensitivity, linearity, etc. Thus, the injection volume needs to be adjusted with column volumes using the following equation: 

Vinj2 = Vinj1 x (V02/V01)

where Vinj1 and Vinj2 are the injection volumes for the original and scaled methods, respectively, and V01 and V02 are the column void volumes for the original and scaled methods, respectively.6

To maintain the separation, the gradient step must be kept constant in terms of column volumes. To do this, the column volumes must be calculated for the original method and then preserved for the scaled method. The number of column volumes determined for each segment is calculated as follows:

CV = ( F × T) / V0

where CV is equal to column volumes, F is the flow rate (mL/min), T is the segment duration (minutes), and V0 is the column void volume (mL).6 Since the void volume and flow rate are constant, the time duration of each gradient step in the scaled method can be calculated based on the required column volume.

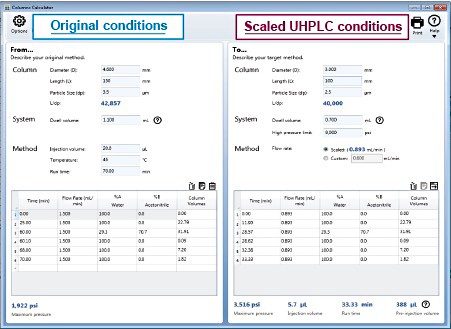
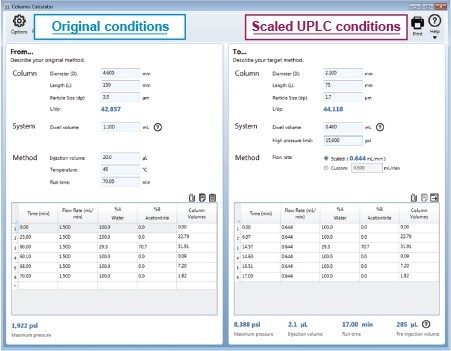
Geometrically scaling a gradient method can seem challenging, but there is a tool to assist users in completing all of the necessary method adjustments.7 The Waters Columns Calculator determines the flow rate, the injection volume, as well as the timing for each gradient step. Once a user enters in the required information (column dimensions, particle size, original method gradient table, etc.) the scaled method conditions are automatically calculated. (Figure 2 and Figure 3).

In order to preserve the original HPLC column L/dp ratio the column dimensions and particle size were scaled to a UHPLC column with a 2.5 µm particle size and 3.0 mm × 100 mm column dimensions. The UHPLC column L/dp ratio decreased by 7% from the HPLC column. The Waters Columns Calculator (Figure 2) scaled the flow rate to 0.893 mL/min and the injection volume to 5.7 µL for the UHPLC method. 

Waters Columns Calculator.
Figure 2. Waters Columns Calculator. HPLC method conditions calculated to UHPLC method conditions.

The Waters Columns Calculator was also used to scale the quetiapine fumarate impurity method to a UPLC column with 1.7 µm particle size and 2.1 mm × 75 mm dimensions (Figure 3). The scaled column dimensions resulted in an L/dp ratio increase of 3%, a flow rate of 0.644 mL/min and the injection volume of 2.1 µL. 

Waters Columns Calculator.
Figure 3. Waters Columns Calculator. HPLC method conditions calculated to UPLC method conditions.

The dwell volume, or gradient delay volume, is the volume between the point of solvent mixing and the head of the column. Since the dwell volume is effectively an isocratic hold at the beginning of a gradient, it can affect selectivity, resolution, and retention in method scaling. Therefore, when scaling methods, the dwell volume is often kept constant in terms of column volumes. In fact, this is part of the method scaling parameters determined using the Waters Columns Calculator. 

To account for the dwell volume differences, the values for the two LC systems were determined8 and entered into the Waters Columns Calculator. The dwell volume in terms of column volume varied for the Alliance HPLC System, the ACQUITY UHPLC Arc System, and the ACQUITY UPLC H-Class PLUS System. Thus, when scaling from the Alliance HPLC System (and column), “pre-injection volumes” were required for both the UHPLC scaled method (388 µL) and the UPLC method (285 µL). 

Scaling of a gradient method from HPLC to UHPLC and UPLC

To evaluate the performance of the scaled methods, the results were compared to the original HPLC method run on the Alliance HPLC System. Additionally, an unknown sample was analyzed on each of the three systems to determine the quantitative reproducibility of the scaled methods. 

The original HPLC method as well as the two scaled methods all show similar chromatographic performance (Table 1) in terms of resolution, tailing, and peak area and retention time RSDs. Chromatograms of the system suitability solution and the unknown sample solution are shown in Figure 4 and 5, respectively. 

Comparison of the results obtained on the Alliance HPLC System, the ACQUITY Arc UHPLC System, and the ACQUITY UPLC H-Class PLUS Systems.
Table 1. Comparison of the results obtained on the Alliance HPLC System, the ACQUITY Arc UHPLC System, and the ACQUITY UPLC H-Class PLUS Systems. Also included is the run time and solvent consumption for each method.
Quetiapine fumarate system suitability solution run on the Alliance HPLC System, the ACQUITY Arc UHPLC System, and the ACQUITY UPLC H-Class PLUS System.
Figure 4. Quetiapine fumarate system suitability solution run on the Alliance HPLC System (3.5 µm particle column), the ACQUITY Arc UHPLC System (2.5 µm particle column), and the ACQUITY UPLC H-Class PLUS System (1.7 µm particle column). Peak identification: 1: quetiapine related compound G, 2: quetiapine related compound B, 3: quetiapine desethoxy, and 4: quetiapine.
Comparison of the unknown sample solution analyzed on the Alliance HPLC System, the ACQUITY Arc UHPLC System, and the ACQUITY UPLC H-Class PLUS System.
Figure 5. Comparison of the unknown sample solution analyzed on the Alliance HPLC System (3.5 µm particle column), the ACQUITY Arc UHPLC System (2.5 µm particle column), and the ACQUITY UPLC H-Class PLUS System (1.7 µm particle column). Peak identification: 1: quetiapine desethoxy, 2: quetiapine, and 3: unknown impurity.

Scaling the original HPLC method to a smaller particle column significantly decreased the run time and solvent consumption. Scaling the original method to a 2.5 µm column decreased the run time from 70 minutes to 34 minutes (51%), and decreased the solvent usage by 71%. Further scaling the method to a 1.7 µm column was able to decrease the run time from 70 minutes to 17 minutes (75%) and reduce the solvent usage by 89%. 

To evaluate the quantitative reproducibility of the methods, an unknown sample was analyzed. The standard solution and the unknown sample solution data were used to calculate the percent of impurity for each peak in the unknown sample as follows:

Result = (ru /rs) × (Cs/Cu ) × (1/F) × 100


where ru is the peak response of each impurity from the sample solution, rs is the peak response of quetiapine from the standard solution, Cs is the concentration of USP quetiapine fumarate standard in the standard solution (mg/mL), Cu is the concentration of quetiapine fumarate in the sample solution (mg/mL) and F is the relative response factor for the impurity peak provided in the monograph.3

Two impurity peaks were found in the unknown sample, quetiapine desthoxy and an unknown impurity. The calculated percent for each impurity as well as the total amount of impurities in the unknown sample can be found in Table 2. All methods provided equivalent impurity amounts for the unknown sample. 

Calculated impurity results obtained for all three methods on the three different LC systems.
Table 2. Calculated impurity results obtained for all three methods on the three different LC systems.

Whenever a method is adjusted, producing consistent reliable results is a critical factor. Scaling the USP quetiapine fumarate impurities method across the different LC systems produced equivalent quantification of impurities contained within a sample of API.

Conclusion

It is possible to scale traditional HPLC methods to columns with a smaller particle size in order to significantly decrease run time and solvent consumption while still providing the same chromatographic and quantitative performance. This was demonstrated by scaling a USP monograph which uses a gradient elution using the Waters Columns Calculator. The scaled method conditions reduced the original run time by 51% for the 2.5 µm column and 75% for the 1.7 µm column. The scaled methods maintained similar chromatographic performance in terms of resolution, peak tailing, and retention time and peak area RSD. Additionally, quantitative results for impurities contained in the API sample were consistent regardless of which method was used.

References

  1. Fountain, Kenneth. Transferring Compendial HPLC Methods to UPLC Technology for Routine Generic Drug Analysis. Application Note. 720004251en, 2012.
  2. Guidance for Industry Q10 Pharmaceutical Quality System. ICH, 2008.
  3. Official Monographs, Quetiapine Fumarate USP 40 NF35 S1, United States Pharmacopeia and National Formulary (USP 40-NF35 S1) Baltimore, MD: United Book Press, Inc.; 2017. p. 5939.
  4. Neue Uwe D., McCabe, Doug, Ramesh, Vijaya, Pappa, Horacio, DeMuth Jim. Transfer of HPLC Procedures to Suitable Columns of Reduced Dimensions. Pharmacopeial Forum 2009 Nov–Dec; 35(6):1622.
  5. Swann, Thomas. Nguyen, Jennifer M. USP Method Modernization Using “Equivalent L/dp” and “Equivalent N” Allowed Changes with CORTECS C8 and CORTECS C8 Columns. Application Note. 720005666en, 2016.
  6. Columns Calculator Online Help. Waters Columns Calculator, version 2.0.
  7. Waters Corporation, Application Solutions. Transferring Compendial HPLC Methods to UPLC Technology. Application Notebook. 720004313en, 2013.
  8. Hong, Paula. McConville, Patricia R. Dwell Volume and Extra-Column Volume: What Are They and How Do They Impact Method Transfer. White Paper. 720005723en, 2018.

720006577, June 2019

トップに戻る トップに戻る