• アプリケーションノート

Automated Protein Modification Characterization of the Intact and Subunit NIST Monoclonal Antibody Reference Standard with Waters UNIFI Scientific Information System

Automated Protein Modification Characterization of the Intact and Subunit NIST Monoclonal Antibody Reference Standard with Waters UNIFI Scientific Information System

  • Nilini Ranbaduge
  • Henry Shion
  • Ying Qing Yu
  • Waters Corporation
Monoclonal antibody mAb

Abstract

This study demonstrates the use of UNIFI Scientific Information System for mAb modification analysis using the NIST mAb Reference Material (RM 8671) as a relevant test case.

The high-resolution instrument used for this application was a Vion IMS QTof mass spectrometer equipped with a new detector (QuanTof2) for enhanced sensitivity and dynamic range, and more efficient vacuum pumps. The data acquisition, data processing, and reporting is completely controlled by UNIFI, a compliant-ready, workflow-driven software package which enables the UNIFI/Vion system to offer an end-to-end platform probing a variety of modifications of the mAbs with high confidence.

Benefits

  • Streamlined intact and subunit mass analyses from MS acquisition to data processing and reporting using UNIFI Scientific Information System with a Vion IMS QTof Mass Spectrometer
  • Simplified MaxEnt 1 deconvolution processing for achieving accurate mass measurements for mAbs
  • Robust relative% modification quantification for the mAbs

Introduction

Monoclonal antibodies (mAb) are inherently heterogeneous molecules. Their structural diversity is due to a variety of protein modifications that arise at different stages of the production process and include innate post-translational modifications (PTMs) that occur during biotherapeutic expression, production and storage. While some PTMs improve the effectiveness of the drug product, undesirable protein modifications could profoundly impact its potency, pharmacokinetic properties, and safety. High resolution mass spectrometry (HRMS) coupled with liquid chromatography (LC) is routinely used in the characterization of intact mAbs to measure the accurate molecular weight of the drug product and their modified forms. The most challenging part of the overall analysis is often the data processing, which heavily depends on expert user intervention to obtain accurate mass measurements due to high degree of heterogeneity of the mAb. 

In this study, we demonstrate the use of UNIFI Scientific Information System for mAb modification analysis using the NIST mAb Reference Material (RM 8671) as a relevant test case. The high-resolution instrument used for this application was a Vion IMS QTof mass spectrometer equipped with a new detector (QuanTof2) for enhanced sensitivity and dynamic range,1  and more efficient vacuum pumps. The data acquisition, data processing, and reporting is completely controlled by UNIFI, a compliant-ready, workflow-driven software package which enables the UNIFI/Vion system  to offer an end-to-end platform probing a variety of modifications of the mAbs with high confidence.1-2

ACQUITY UPLC H-Class Bio System (left) coupled to a bench top Vion IMS QTof Mass Spectrometer
Figure 1. The ACQUITY UPLC H-Class Bio System (left) coupled to a bench top Vion IMS QTof Mass Spectrometer (right) controlled by UNIFI Scientific Information System.
Schematic representation of the NIST mAb.
Figure 2. Schematic representation of the NIST mAb. The intact protein contains a total of 16 disulfide bonds and an N-terminal pyroglutamic acid modification. The hinge region (in yellow) of the NIST mAb is susceptible to enzymatic cleavage and produces light chain (LC), Fd’ and single chain fragment crystallizable region (scFc) subunits under reducing conditions.2

Experimental

Reagents, Solvents, and Sample Preparation

Intact mass analysis

A humanized IgG1k monoclonal antibody (NIST mAb RM 8671, National Institute of Standards and Technology, Gaithersburg, Maryland) was received in a 10 mg/mL (800 µg) solution. A 0.1 mg/mL stock solution was prepared in 25 mM ammonium acetate for intact mass analyses. PNGase F (p/n: 176003867) was used to remove the N-glycans by incubating at 37 °C for 3 h for some of the experiments. 

Subunit mass analysis

A 5 µL aliquot of the NIST mAb solution (10 mg/mL) was diluted in a 25 mM Tris/NaCl buffer and digested with FabRICATOR (IdeS) enzyme (Genovis, Cambridge, MA) (1:1 enzyme to mAb ratio in weight) at 37 °C for 30 min followed by partial reduction with 5 mM DTT at 37 °C for  30 min. The final concentration of the solution was adjusted to 0.1 mg/mL in 3% acetonitrile, 0.1% formic acid.

LC conditions

Column type:

ACQUITY UPLC Protein BEH C4

Column temp.:

80 °C

Intact mass analysis gradient table

Time (min)

Flow rate (mL/min)

0.1% FA/H2O (%)

0.1% FA/CAN (%)

Initial

0.2

95.0

5.0

1.0

0.2

95.0

5.0

3.5

0.2

50.0

50.0

5.0

0.2

50.0

50.0

5.5

0.2

5.0

95.0

6.0

0.2

5.0

95.0

6.1

0.2

95.0

5.0

10.0

0.2

95.0

5.0

Subunit mass analysis gradient table

Time (min)

Flow rate (mL/min)

0.1% FA/H2O (%)

0.1% FA/CAN (%)

0.5% TFA/H2O (%)

Initial

0.4

88.0

10.0

2.0

1.0

0.4

88.0

10.0

2.0

1.5

0.4

73.0

25.0

2.0

6.0

0.4

66.0

32.0

2.0

8.9

0.4

48.0

50.0

2.0

9.0

0.4

8.0

90.0

2.0

10.9

0.4

8.0

90.0

2.0

11.0

0.4

88.0

10.0

2.0

14.0

0.4

88.0

10.0

2.0

QTof MS Settings

MS system:

Vion IMS Qtof

Acquisition range:

m/z 500–4000 Da

Mode:

ESI positive sensitivity mode

Capillary voltage:

2.75 kV

Cone voltage:

150 V for intact mass analysis and 70 V for subunit analysis

Source offset:

150 V for intact mass analysis and 80 V for subunit analysis

Source temp.:

150 °C for intact mass analysis and 125 °C for subunit analysis

Desolvation temp.:

600 °C

Desolvation gas flow:

600 L/h

Lock mass:

[Glu 1]-Fibrinopeptide B Standard at 320 fmol/μL in 50/50 H2O/ACN, 0.1% FA

Informatics for data acquisition and processing:

UNIFI Scientific Information System 1.8.2

Vion IMS QTof driver pack 2.0

The UNIFI “Intact Protein MS-RT Window Based” analysis method was used with the MaxEnt1 deconvolution algorithm. The total ion chromatogram peak area for the selected retention times was integrated and the full charge distribution from the summed spectrum was used for charge deconvolution of the raw mass spectra.

Both intact and subunit data were processed in UNIFI 1.8.2 using simplified MaxEnt 1 deconvolution parameters.
Figure 3. Both intact and subunit data were processed in UNIFI 1.8.2 using simplified MaxEnt 1 deconvolution parameters. The manual peak widths for intact mAb analysis were measured at FWHM for selected ions at high and low charge states. The FWHM value could change depending on the MS settings and the mAb sample used.

Results and Discussion

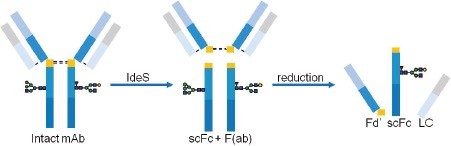
Intact mAb Mass Analysis

The LC-MS-based characterization of an intact mAb is often used alongside peptide mapping to profile modifications such as glycosylation, C-terminal truncation, glycation that can be mass resolved on a high resolution mass spectrometer (HRMS). In mAb characterization, intact mass measurements are often challenged by the extent of user intervention required in data analysis. UNIFI completely automates the analysis by streamlining data acquisition, processing, and reporting into one integrated workflow for both intact mAb and subunits analyses. Data analysis is simplified for the accurate mass measurements, modification confirmation, and relative abundance quantification. In this application, we demonstrate the use of intact protein workflow in UNIFI to profile modifications of the NIST mAb reference material.

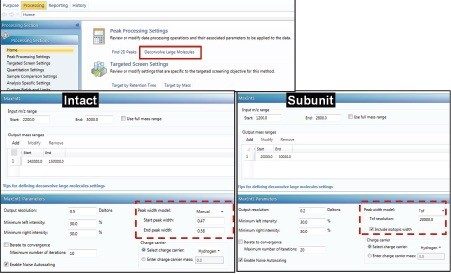
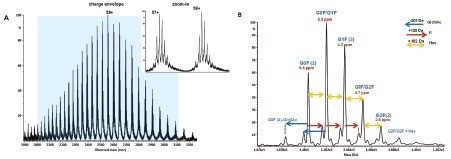
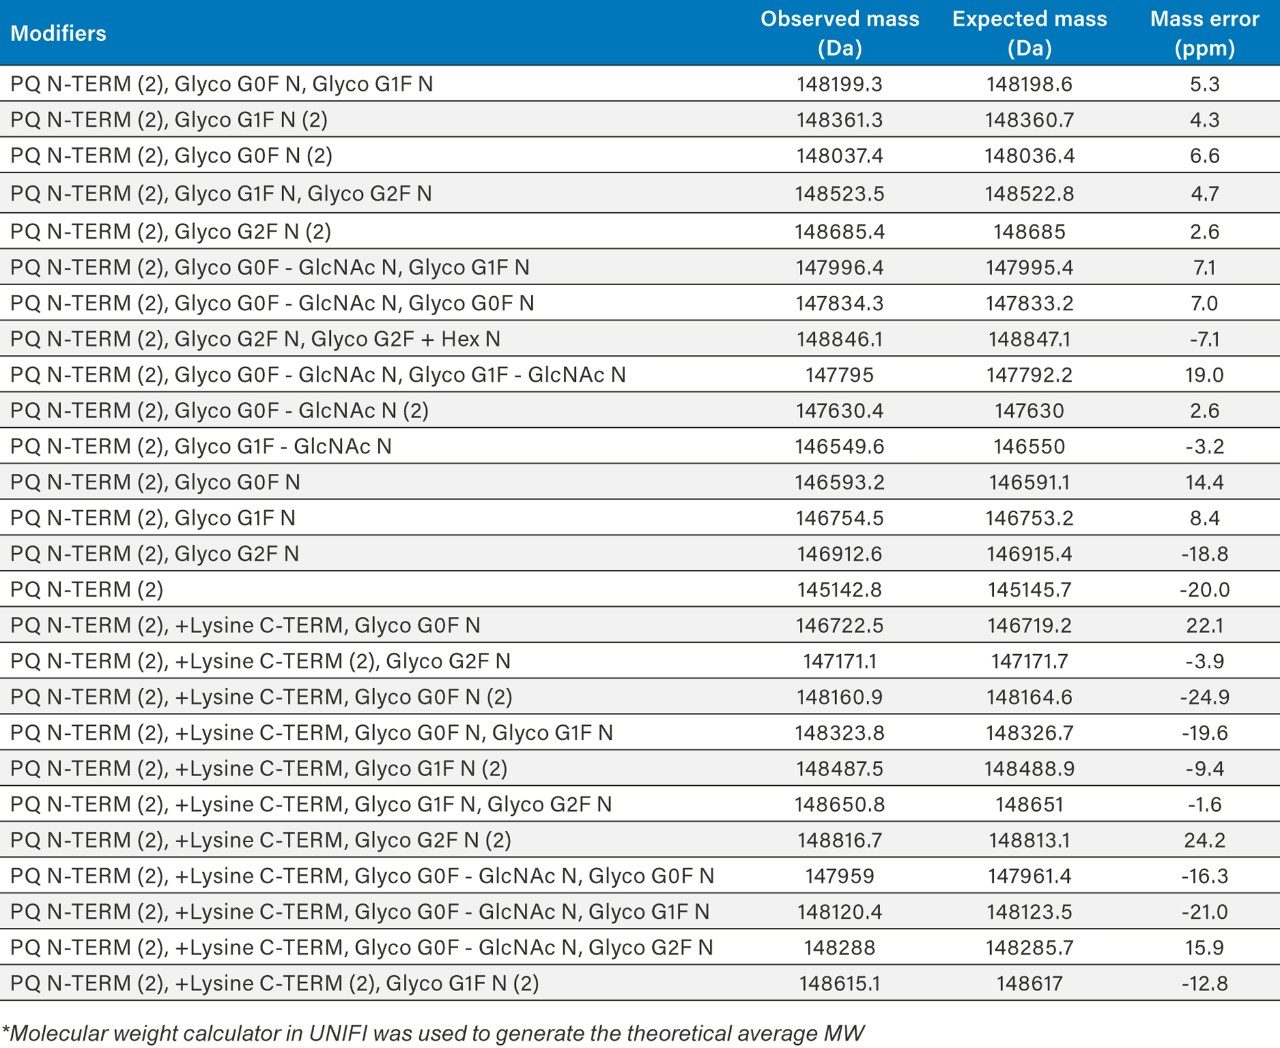
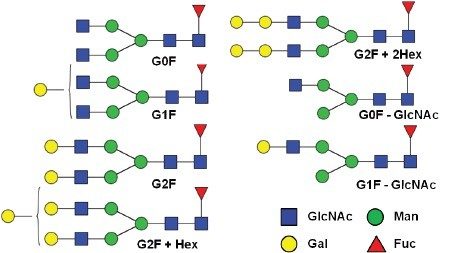
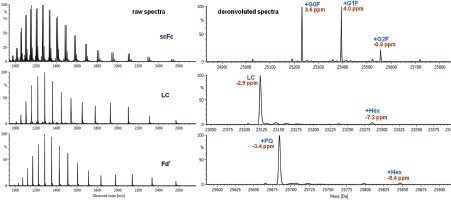
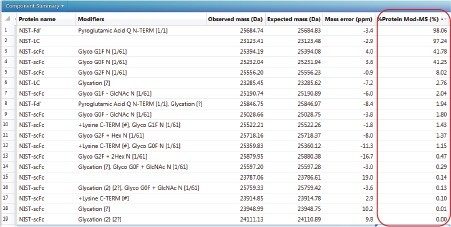
The summed raw spectrum (Figure 4A) presents the charge envelope for 0.1 µg of the intact NIST mAb (on-column) and the inset presents the zoomed-in region to show the peaks representing its five most abundant glycoform combinations. The UNIFI intact protein workflow has a MaxEnt1 charge deconvolution algorithm capable of generating the zero charge spectra using “manual” or “Tof” peak width models for the m/z range of interest. Here, the manual peak width model with user-defined start and end peak widths (full width at half maximum/ FWHM) was used. For an example, the selected peak widths of 0.47 and 0.58 (Figure 3) represent the respective FWHM for the most abundant species at the low and high ends of the charge envelope (m/z 2100–3000 mass window) as given in Figure 4A. The charge deconvoluted intact NIST mAb data and peak assignments are illustrated in Figure 4B. The most abundant glycoforms are bi-antennary structures; however, glycoforms identified by UNIFI also consisted of low levels of galactose-alpha-1,3-galactose containing glycoforms (Table 1). The structures of all glycans were later confirmed and quantified using a released N-glycan assay (data not shown). 

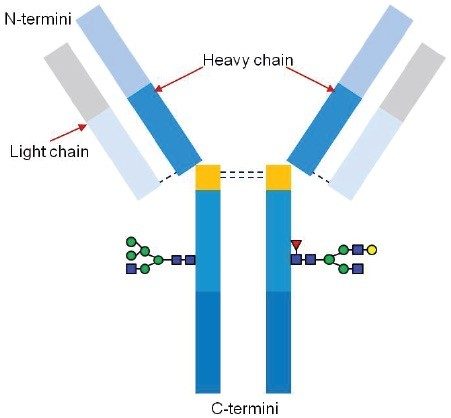
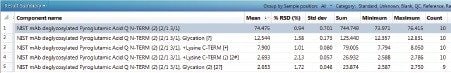
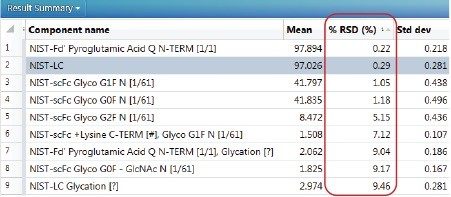
In addition to N-glycans, three other modifications: N-terminal pyroglutamic acid formation, C-terminal lysine truncation, and glycation were also investigated at the intact mAb level. The glycation analysis was performed after treating the mAb with PNGase F to remove all N-linked glycans. The MS response was used for the relative abundance measurements. In summary, we observed 10.5% of C-terminal lysine variants, which correlated very well with the peptide level measurement (data not shown), 14.6% of overall glycation (Table 2 and 3) and N-terminal pyroglutamic acid modification at >99% level. Our measurements are in good agreement with the published data.3

NIST RM 8671 analyzed with a Vion IMS QTof /UNIFI System.
Figure 4: NIST RM 8671 analyzed with a Vion IMS QTof /UNIFI System. A) Raw spectrum and the charge envelope (highlighted) used in charge deconvolution, B) MaxEnt 1 deconvoluted zero charge spectrum and the data presented multiple modifications at the intact protein level with a mass accuracy less than 10 ppm for the five major glycoforms. The high mass accuracy can be obtained consistently using the measured FWHM for low and high charged ions in the processing method setup (Figure 3).
MaxEnt 1 deconvoluted spectra in UNIFI identified multiple glycoforms with N- and C-terminal modifications for the NIST intact mAb RM 8671.

Table 1. MaxEnt 1 deconvoluted spectra in UNIFI identified multiple glycoforms with N- and C-terminal modifications for the NIST intact mAb RM 8671.  UNIFI processed results are summarized in the table. (PQ= Pyroglutamic Acid Q).

*Molecular weight calculator in UNIFI was used to generate the theoretical average MW

C-terminal lysine truncation and global glycation levels of the NIST mAb RM are listed.
Table 2. C-terminal lysine truncation and global glycation levels of the NIST mAb RM are listed. The relative% for the modified components was calculated based on the MS response for each modification as a percentage of the total MS response for the deglycosylated NIST mAb. The mean of relative% calculation and the RDS% for 10 replicated analyses are shown here.
The nomenclature of N-linked glycans identified in the intact protein analysis.
Figure 5. The nomenclature of N-linked glycans identified in the intact protein analysis. “Ga” stands for Gal-Gal configuration.

Subunit Analysis

Enzymatic digestion of the NIST mAb under reducing conditions generates three domains, LC, Fd’, and scFc, (Figure 6) that can be baseline resolved on a BEH C4 Column prior to MS analysis (Figure 7). 

The UPLC separation using an ACQUITY UPLC H-Class Bio System gave symmetric, baseline resolved peaks for all three subunits (Figure 7). Both the TUV and MS data channels were acquired and processed in UNIFI. The TUV peak processing results are often used for a trending analysis for batch-to-batch product comparisons. Although TUV data were not utilized in this study, the in-line TUV detection did provide orthogonal quantification data to MS information.

The “Tof” peak width model is better suited for subunit charge deconvolution due to improved mass resolution in contrast to the use of manual measurements of FWHM of selected charge states used in intact mAb charge deconvolution. Figure 8 presents raw and charge deconvoluted spectra for all three subunits. The modification% levels for the major protein modifications are listed in Table 3. The charge deconvoluted LC and Fd' MS spectra have two distinct peaks: an unmodified form and plus one glycation. The relative quantification data obtained for the identified glycoforms at subunit level subunit data matched well with the released N-glycan assay with RapiFluor-MS labeling chemistry (data not shown).

Endopeptidase, IdeS digestion cleaves the Gly-Gly bond in the hinge region (in yellow) generating F(ab) and scFc fragments.
Figure 6. Endopeptidase, IdeS digestion cleaves the Gly-Gly bond in the hinge region (in yellow) generating F(ab) and scFc fragments. The subsequent reduction of the  disulfide bonds with DTT releases the scFc and Fd’ subunits from the F(ab). 
The TIC and TUV chromatograms of the NIST mAb subunits acquired by an  ACQUITY UPLC H-Class Bio System coupled to a Vion HRMS.
Figure 7. The TIC and TUV chromatograms of the NIST mAb subunits acquired by an  ACQUITY UPLC H-Class Bio System coupled to a Vion HRMS. The UV chromatogram  shows UNIFI integrated peak area for each subunit peak.
The raw mass spectra acquired for scFc, LC, and Fd’ subunits of the NIST mAb and the respective MaxEnt 1 deconvoluted spectra.
Figure 8. The raw mass spectra acquired for scFc, LC, and Fd’ subunits of the NIST mAb and the respective MaxEnt 1 deconvoluted spectra.
NIST mAb subunit, the IgG glycan name, observed mass, expected mass, mass error (ppm), and % protein modification based on the total MS response for each subunit
Table 3. NIST mAb subunit, the IgG glycan name, observed mass, expected mass, mass error (ppm), and % protein modification based on the total MS response for each subunit are shown here. Both the mass accuracy and the protein modification% measurements were automatically generated in UNIFI workflow.
UNIFI generates a results summary for each relative quantification measurement

Table 4. UNIFI generates a results summary for each relative quantification measurement  that reports the reproducibility of the measurements for selected high and low abundance protein modifications.

■ Glyco G1F N [1\61]= one N-glycosylation at residue 61

■ Glycation [?]= site unspecific glycation

Conclusion

Vion HRMS System controlled by the compliant-ready, workflow driven UNIFI Software provides a streamlined analytical solution for mAb analysis. Automated intact mass analysis workflow in UNIFI allows fast and confident mass measurements and product attribute quantifications of intact mAb and subunits. The simplified MaxEnt 1 charge deconvolution processing method is optimized for both intact mAb and subunits without heavy manual adjusting. Users can expect to achieve robust and reproducible mass measurements using the workflow, therefore, improving confidence in  data quality.

References

  1. Shion, H.; Yu, Y.-Q. High-performance Vion IMS QTof for monoclonal antibody intact and subunit mass analysis; Waters Corporation: 720005906EN, 2017.
  2. Fang, J.; Yu, Y.-Q.; Du, M.; Chen, W. Peptide mapping with higher confidence: the application capability of IMS QTof mass spectrometry with four-dimension (4 D) peak detection (RT, m/z, intensity and CCS values); Waters Corporation: 720005905EN, 2017.

720006085, August 2017

トップに戻る トップに戻る