Pesticides have been widely used throughout the world since the middle of the 20th century. The Pesticide Manual Online lists information on more than 1,600 pesticides, with 10,400 product names, 3,100 discontinued products, and information for superseded materials believed to be no longer manufactured, or marketed for crop protection use. This information does set the scene for the challenge of pesticide residue analysis. The number of pesticides listed in the Pesticide Manual far exceeds the 357 pesticides approved for use within the EU.1 In addition, the regulations are constantly changing. For example, the impact of pesticide residues on bee populations has prompted legislation modification. The use of seed products containing the active plant protection substances clothianidin, thiamethoxam, and imidacloprid have been prohibited, within the constraints of approved conditions of use.2
Food commodities are sourced from a global network supply chain, therefore a residue screening strategy should be considered from a global perspective. Alder et al. indicated that there are more than 500 strictly regulated compounds that are routinely used and analyzed using GC-MS and LC-MS.3 With increasing global trade there is a need for qualitative multi-analyte screening strategies that are capable of efficiently detecting residue violations to protect consumer safety. Countries have different regulations concerning authorization of pesticides and Maximum Residue Limits (MRLs) established. The SANCO/12571/2013 guidance document describes the method validation and analytical quality control requirements to support the validity of data used for checking compliance with MRLs, enforcement actions, or assessment of consumer exposure to pesticides in the EU.4
Pesticide residue analysis in food has become a difficult task considering the increasing number of compounds and complex food commodities that need to be monitored at low concentrations with generic extraction procedures. The direct consequences are that complex extracts may include the presence of potentially interfering matrix components for which multiple injections may have to be performed, while achieving a dwell time and duty cycle balance.
Screening methods are a practical alternative, where the focus is primarily aimed towards qualitative detection in which neither requirements for recovery nor linearity are defined. Full scan High Resolution MS (HRMS) offers high specificity with, theoretically, no limitation in the number of compounds detected. Although time-of-flight mass spectrometry (Tof-MS) has provided the benefits of higher sensitivity and resolution, it is still a challenge to rapidly and efficiently identify targeted compounds in the presence of a large number of co-extracted matrix components. The benefits of full spectra acquisition and specificity of accurate mass measurement are well characterized and have been used in combination with retention time tolerances, isotope fits, fragment ions/ratios, and response thresholds to reduce false positive/negative identifications in non targeted screening assays. Also the ability to perform retrospective data review can be advantageous. From the mass spectral data generated, the challenge reverts to minimizing false detections through careful optimization of software screening parameters, while ensuring that when dealing with the impact of such complex matrices, false negative identifications do not result.
Over the last decade LC-MS has become the predominant approach for the analysis of small organic molecules, such as pesticide residues in food commodities. Multi-residue analysis utilizes generic sample extraction and chromatographic methodology; hence the analysis of very complex mixtures remains a challenge that the residue analyst has to deal with on a day-to-day basis. Recent advances in MS and separations technology, such as enhanced MS ion transmission and the increased peak capacity of UltraPerformance Liquid Chromatography (UPLC) have the potential to facilitate complex mixture analysis. StepWave, a unique off-axis ion source technology, provides additional sensitivity and increases the dynamic range required for routine pesticide screening. Such enhancements in Tof technology provide improved precision and accuracy in the data generated, but also necessitate the creation and utilization of more intelligent data processing software packages. Nonetheless, the ability to rapidly and efficiently identify targeted compounds present in a sample with a large number of co-extracted matrix components remains a challenge.
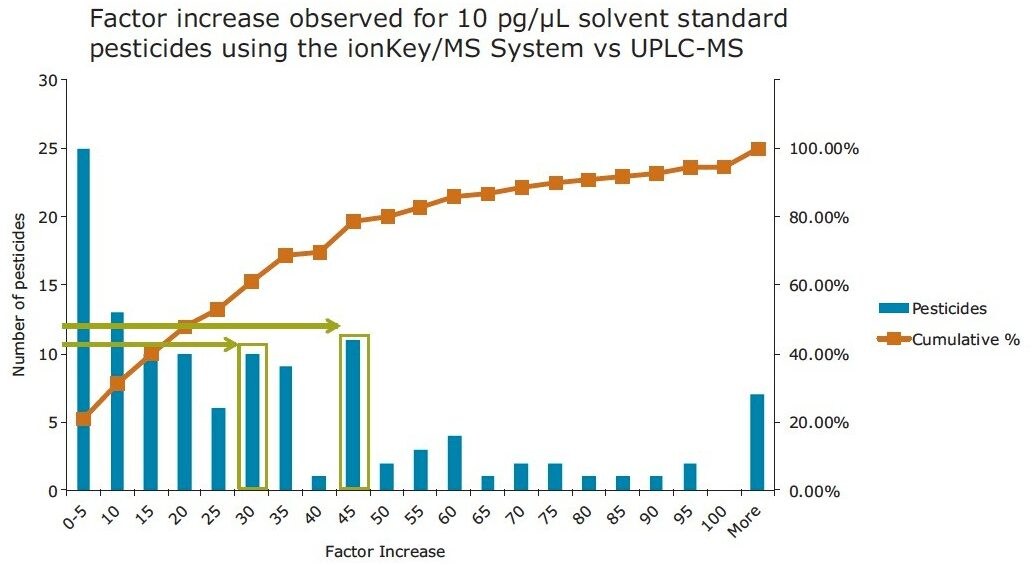
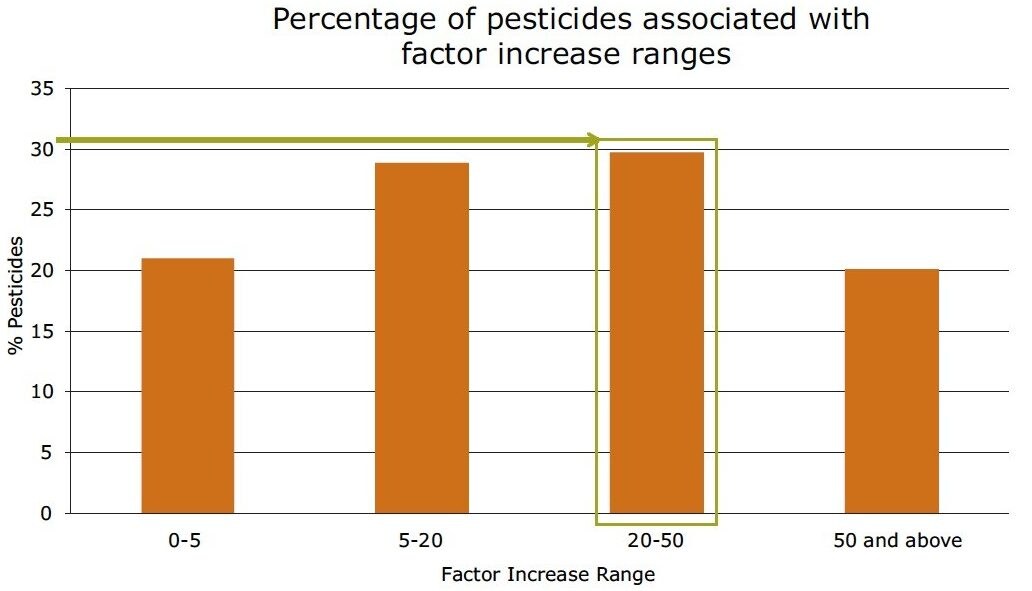
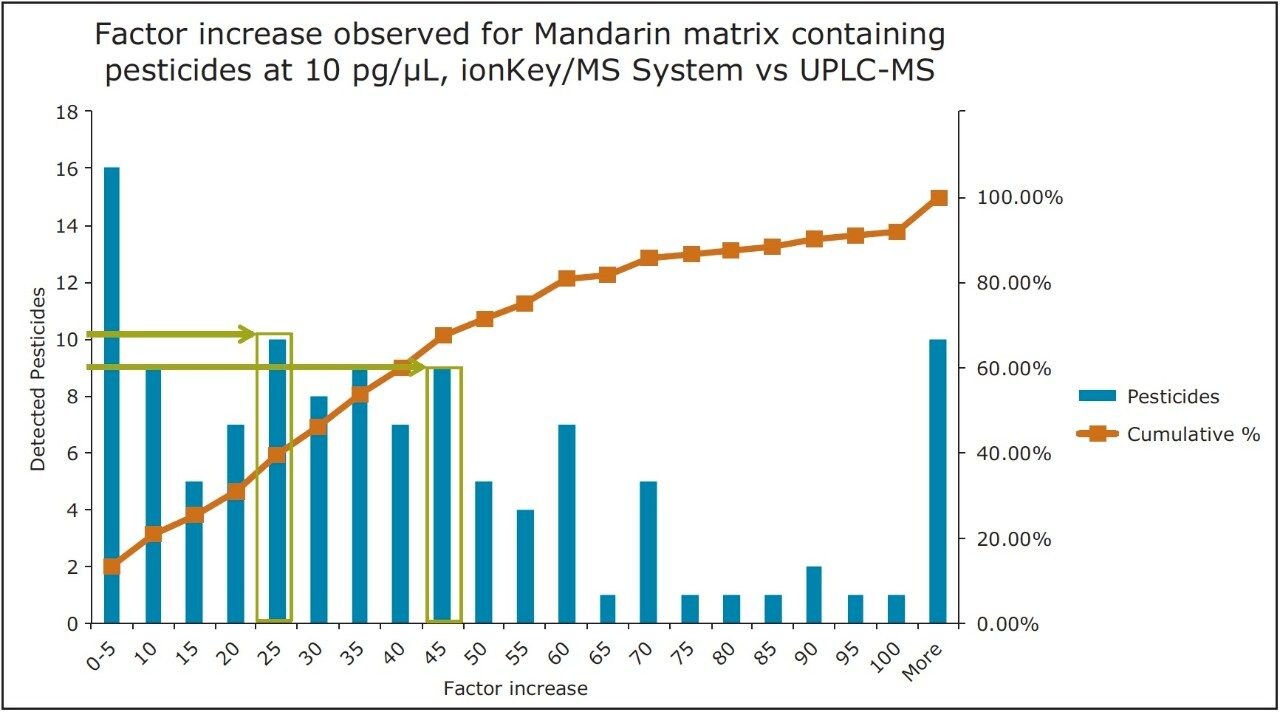
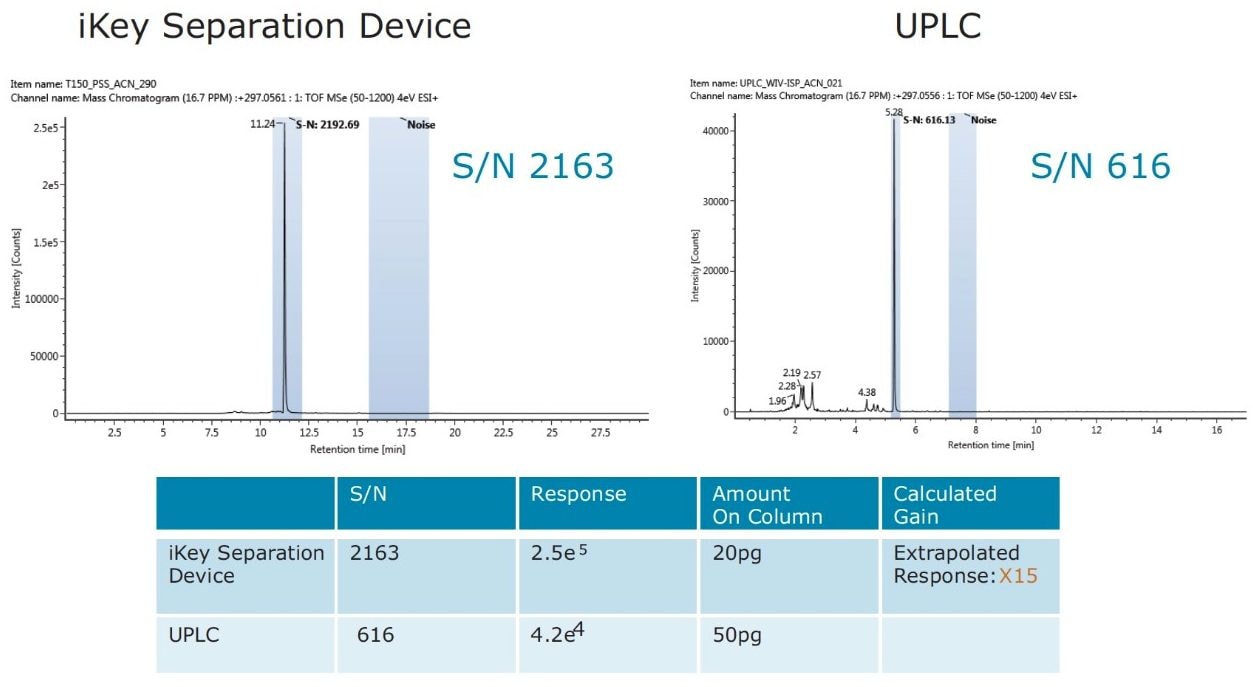
Advances in Waters’ mass spectrometry technology have vastly improved sensitivity for full spectral analysis, enabling Waters to provide the only unique fully validated pesticide screening solution.5 The drive to improve and develop new technology solutions continues in order to meet the ever changing requirements of residue analysis and more stringent regulations. Further sensitivity enhancements would help improve mass spectral data quality, which is especially important in order to avoid compromised precursor ion or fragment ion information and ensure high mass accuracy (≤2 mDa) below the legislated levels.
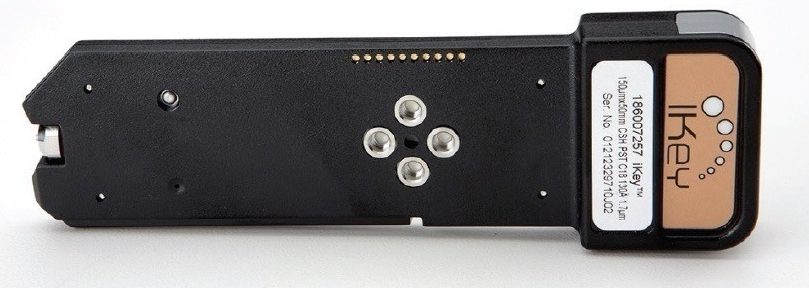
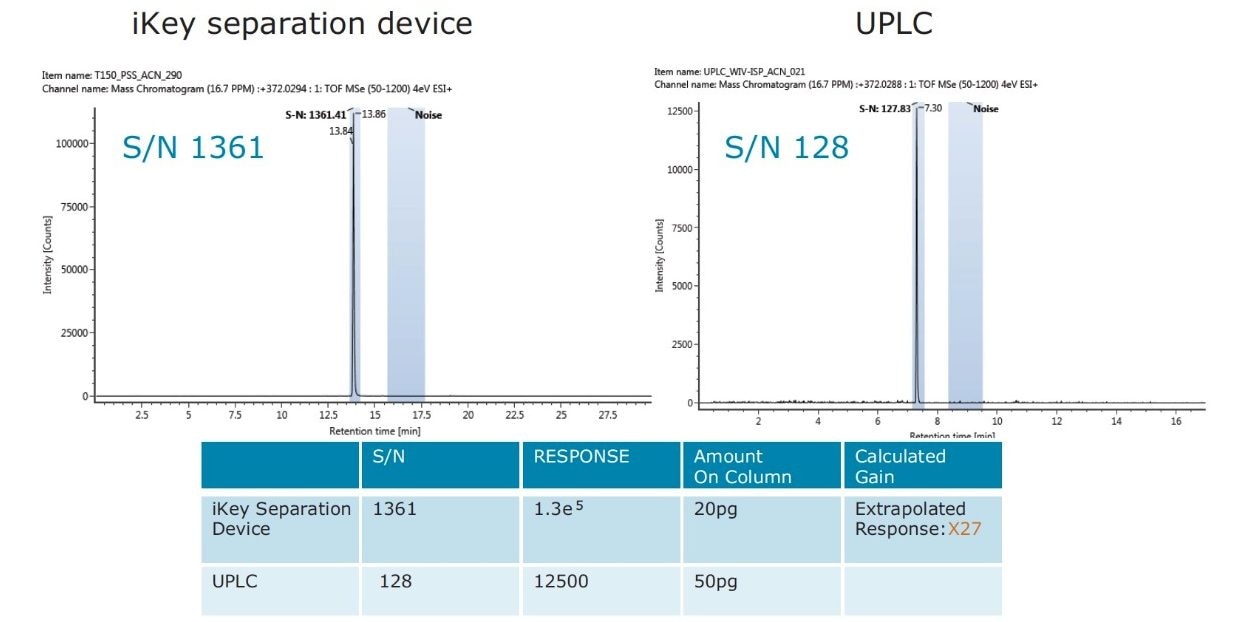
This study aims to characterize sensitivity enhancements and reduction of matrix suppression for residue analysis. The ionKey/MS System was comprised of the nanoACQUITY UPLC System,* the Xevo G2-S QTof Mass Spectrometer, the ionKey Source, and the iKey Separation Device, all controlled with MassLynx Software. Presented in Figure 1, the ionKey/MS System incorporates UPLC separation into the mass spectrometer source, delivering exceptional performance and a simplified user experience.