• アプリケーションノート

Advancing Perfluorinated Compound Analysis Using Simultaneous Matrix Monitoring

Advancing Perfluorinated Compound Analysis Using Simultaneous Matrix Monitoring

  • Paul Silcock
  • Anna Karmann
  • Bert van Bavel
  • Waters Corporation
  • MTM Research Centre, Örebro University

Abstract

This application note demonstrates the importance of monitoring background sample matrix during high sensitivity perfluorinated compound analysis in environmental waters and biota.

Benefits

  • Extraction and analysis of PFCs in water and biological samples
  • Use of Triple Quadrupole Mass Spectrometry in Waters RADAR dual scan – multiple reaction monitoring (MRM) mode to quantify PFCs at low concentrations while monitoring matrix background simultaneously

Introduction

Understanding the occurrence, fate, and impact of persistent organic pollutants (POPs) is a global priority and consequently is undertaken by a diverse range of organizations. Perfluorinated compounds (PFCs) have become increasingly important and perfluorooctane sulphonic acid (PFOS) has been included in the Stockholm Convention on POPs.1 The tracking of PFCs is critical to organizations whose activities might inadvertently facilitate exposure to populations through water, food supplies, and consumer products. This is also a priority for researchers and regulators and is especially true when taking into account the high publicity related to newer contaminants such as PFCs.

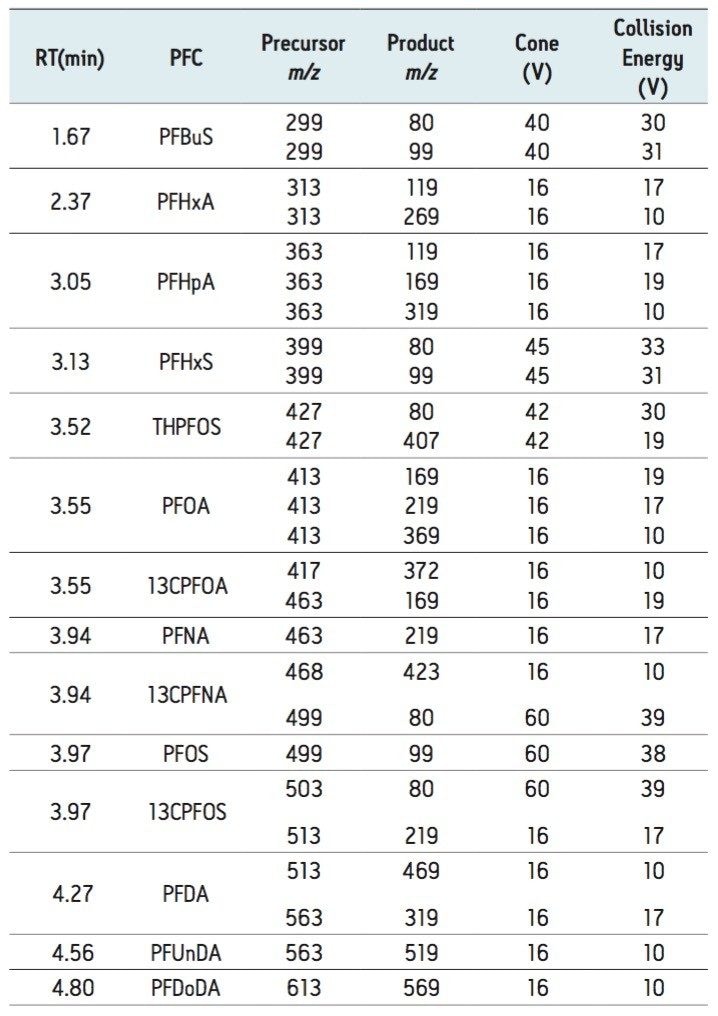
Over the past decade these compounds have been determined in an array of matrices by various techniques with liquid chromatography tandem quadrupole mass spectrometers (LC-MS/MS) featuring heavily.2 The ability of laboratories to successfully measure PFCs in various matrices has improved greatly in recent times, largely due to improvements in labeled standard availability highlighted in recent inter laboratory studies.3,4 These studies also attribute the continuous improvement in data quality to advances in instrumental technology. Advances in LC-MS/MS instrument performance have largely been focused on Multiple Reaction Monitoring (MRM) sensitivity to satisfy the need for increasingly lower detection limits. While this is clearly a priority for this type of instrumentation, there have been limitations previously in acquiring important qualitative information from a sample in a single injection with previous generation instruments.

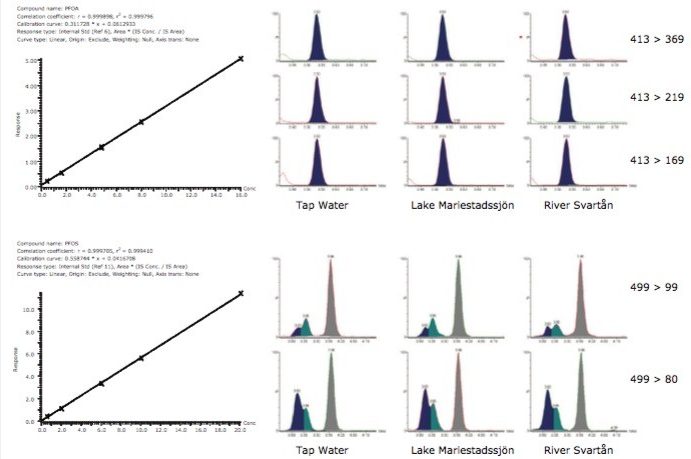
This information can be of high value as a method development tool or intra-sample QC check when analyzing ultra-trace level contaminants in difficult sample matrices such as environmental waters and biological tissues. This ultimately leads to greater confidence in the analytical result.

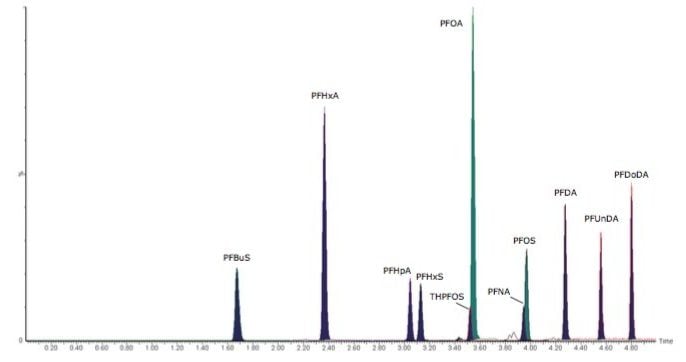
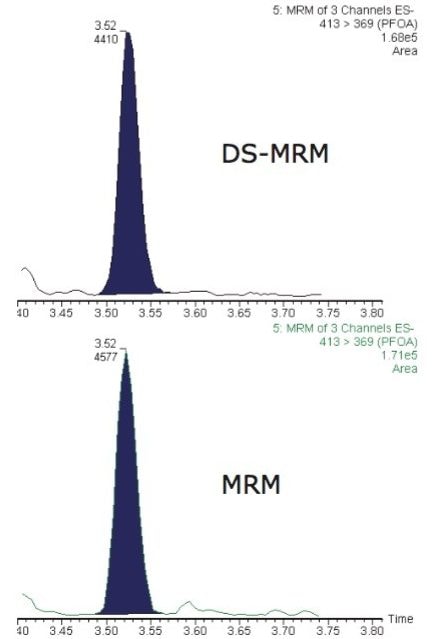
This application note describes advanced high-sensitivity Xevo TQ-MS analysis of PFCs in environmental waters and biota, incorporating Waters RADAR dual scan-MRM functionality to understand the nature of the sample matrix, while simultaneously performing routine quantitation.

Experimental

Sample preparation

Environmental water samples were obtained from Lake Mariestadssjön, River Svartån, and various drinking water sources in Sweden. Fish liver samples were from unknown locations in Norway. 

Water samples were stored at 4 °C until analysis, and filtered through glass microfiber filters before extraction using Waters Oasis WAX 6 cc/150-mg cartridges (substituting Oasis HLB in the PFC Analysis Kit5), according to standard method ISO 25101.6 Both of these sorbents are described as suitable in ISO 25101. An outline is provided below.

Condition:

4 mL 0.1% NH4OH/ MeOH, 4 mL MeOH, 4 mL H2O

Load sample:

Under vacuum between 3 mL/min and 6 mL/min

Dry:

Under vacuum

Wash:

Acetate buffer (4 mL, 0.025 M), 4 mL MeOH

Elute:

4 mL 0.1 % NH4OH/MeOH

Eluant was evaporated and reconstituted to 40:60 MeOH:H2O with 2-mM ammonium acetate. The final extracts were filtered or centrifuged if necessary.

For fish liver samples acetonitrile extraction was followed by cleanup using Oasis WAX and  dispersive carbon. Detailed method description for fish liver extraction can be found elsewhere.7 In brief, approximately 1-g liver was cut into pieces and homogenized using a probe homogenizer. Acetonitrile (10 mL) was added, and the mixture was repeatedly vortex-mixed and sonicated for 30 min. The supernatant acetonitrile phase was removed after centrifugation (10,000 xg, 30 min), and the extraction procedure was repeated. The acetonitrile fractions were combined and reduced to 10 mL after which 25 mL water was added. After mixing and centrifugation the solution was put through an Oasis WAX 6 cc/150 mg-cartridge, and the outline procedure is given below.

Condition:

4 mL MeOH, 4 mL H2O

Load sample:

Under vacuum between 3 mL/min and 6 mL /min

Dry:

Under vacuum

Wash:

Acetate buffer (4 mL, 0.025 M), 4 mL 40% MeOH in water, 8 mL MeOH

Elute:

2 mL 2% NH4OH in MeOH

Elution was placed into a tube with 50 mg graphitized non-porous carbon and 100-µL acetic acid. The carbon solution was vortex-mixed for 30 s, and then filtrated through 0.2-µm GHP membrane.

Sample extracts and standard solutions were prepared so that the solvent composition was 40:60 MeOH:H2O with 2-mM ammonium acetate. The final extracts was filtered or centrifuged if necessary.

UPLC conditions

LC system:

ACQUITY UPLC with PFC Analysis Kit

Column:

ACQUITY BEH C18 Column 1.7 μm, 2.1 x 50 mm

Column temp.:

50 °C

Mobile phase A:

(98:2) 2 mM CH3COONH4 (aqueous): MeOH

Mobile phase B:

MeOH + 2 mM CH3COONH4

Flow rate:

0.65 mL/min

Injection volume:

10 μL

AQUITY UPLC gradient is detailed in Table 1.

Time(min)

Flowrate

%A

%B

Initial

0.65

75.00

25.00

0.50

0.65

75.00

25.00

5.00

0.65

15.00

85.00

5.10

0.65

0.00

100.00

6.60

0.65

0.00

100.00

6.70

0.65

75.00

25.00

Table 1. ACQUITY UPLC gradient.

MS conditions

MS system:

XEVO TQ-MS

Acquisition mode:

RADAR Dual Scan-MRM

Ionization mode:

ESI negative

Capillary voltage:

0.44 kV

Source temp.:

150 °C

Desolvation temp.:

600 °C

Desolvation gas:

900 L/hr

Cone gas flow:

30 mL/min

Collision gas flow:

0.18 mL/min

Xevo TQ-MS setup (mass resolution and mass calibration) was automated by IntelliStart Software. Table 2 shows MRM acquisition parameters and retentions time for each compound. RADAR Dual Scan-MRM full-scan spectra were acquired with mass range of 50 to 650 m/z at 3000 Da/s. 

Table 2. Multiple Reaction Monitoring conditions and retention times for PFCs.

Data acquisition and processing

MassLynx Software v.4.1 was used for data acquisition and spectral processing. TargetLynx Application Manager was used to quantify PFC in samples.

Results and Discussion

Rapid UPLC separations of PFCs were achieved with PFDoDA eluting at 4.8 min. This allowed for the analysis of eight samples per hour when taking into account column equilibration time. The flow rate used in the analysis was 0.65 mL/min, which is within the optimum range for UPLC. This helped reduce chromatographic band broadening and resulting in peak widths (at baseline) of approximately 3 s for all compounds. Source design improvements have enabled optimum UPLC efficiency at higher flow rates to be utilized without adversely affecting instrumental sensitivity. Figure 1 shows overlaid MRM chromatogram of each targeted PFC in a solvent standard with analyte concentrations ranging between 1 pg/µL and 2 pg/µL. The PFC Analysis Kit allowed solvent blanks with undetectable levels of all PFCs, meaning that system blank contribution was removed.

Figure 1. Overlaid MRM chromatograms of each target PFC (solvent standard; concentrations range between 1 pg/µL and 2 pg/µL).

Environmental waters

Quantitation of PFCs in non-fortified tap water, surface water, and river water was performed to determine native concentrations. Comfortable detection of native PFCs was achieved in the range 0.23 to 1.50 ng/L for each sample. Positive detections in each sample included PFOA and PFOS. Calibration curves and extracted MRM chromatograms for each water sample are shown  in Figure 2 for PFOA and PFOS.

Figure 2. Quantitative data for PFOA (top) and PFOS (bottom), including calibration curves and extracted MRM chromatograms. Native concentrations in tap water (PFOA 0.42 ng/L, PFOS 1.50 ng/L), Lake Mariestadssjön (PFOA 1.30 ng/L, PFOS 1.30 ng/L), and River Svartån (PFOA 1.10 ng/L, PFOS 1.40 ng/L).

In addition to high sensitivity MRM detections of native PFCs, sample matrix effects were simultaneously monitored using RADAR dual scan-MRM functionality of the Xevo TQ-MS. DS-MRM allows the simultaneous acquisition of full scan data while performing routine quantitative MRM analysis. High-value information about the background in each sample can be  retained while maintaining good MRM performance. Figure 3 shows 413 > 369 MRM transition for PFOA at ~400 fg/µl acquired in RADAR dual scan-MRM mode (incorporating at 50-650 m/z scan at 3000 Da/s) and traditional MRM mode. Signal-to-noise sensitivity and peak area were not significantly affected when using RADAR dual scan-MRM. 

Figure 3. PFOA 413 > 369 acquired in RADAR dual scan-MRM and MRM only mode.

Figure 4a shows overlaid and normalized RADAR dual scan-MRM chromatograms for detected native PFCs from a Lake Mariestadssjön sample. Dual  scan-MRM acquisitions allowed enough sensitivity for low level detections (0.23 ng/L to 1.30 ng/L) of many of the native PFCs, as well as providing information about the complexity of each sample matrix. Figure 4b is a combined full scan spectrum taken from 0 to 1 min in the chromatogram. This spectrum is characteristic of humic and fulvic substances often found as the principal matrix component common in environmental samples. These substances contribute to the majority of the ion current in the sample and have been shown to cause matrix suppression in electrospray ionization. These humic and fulvic substances also appear to significantly increase the background noise level for PFBuS and could therefore effect detection limits.  

Figure 4a. RADAR Dual Scan-MRM chromatogram overlay of a non-fortified Lake Mariestadssjön sample. Detected PFC MRM chromatograms (normalized) (a) PFBuS 0.23 ng/L (b) PFHxA 0.41 ng/L (c) PFHpA 0.69 ng/L (d) PFHxS 0.42 ng/L (e) PFOA 1.30 ng/L (f and g) PFNA 0.45 ng/L and PFOS 1.30 ng/L, and (h) Full scan 50-650 m/z TIC.

Figure (4b). Combined spectrum 0 to 1 min showing presence of humic and fulvic substances.

The ability to observe the elution region for these substances in each sample at the same time as acquiring high sensitivity MRM transitions for target PFCs allows for greater confidence when good chromatographic separations are achieved and for appropriate action to be taken where problems occur.

RADAR dual scan-MRM for biota samples Salmon and cod liver samples were also analyzed for native PFCs using a RADAR dual scan-MRM approach. These samples are largely considered to be one of the most challenging matrices for low level PFC determination. Retention time shifts and some MRM interference were initially observed for both samples. As full scan data were available from RADAR dual scan-MRM acquisition, the cause of these problems were investigated. 

Figure 5a shows overlaid RADAR dual scan-MRM chromatograms for PFOS present at 2.75 ng/g in salmon liver. Two high concentration matrix components taurocholate and deoxytaurocholate (peaks a and b), were observed eluting at a critical point in the chromatogram. These matrix components were identified as bile acids based upon product ion scanning (Figure 5b) and comparing data with existing references. Deoxytaurocholate co-eluted with PFOS and interfered with the 499>80 transition due to an isotope at 499 m/z fragmenting and sharing the 80 m/z product ion (SO3-). This component is a known interference for human serum analyses and using 499>99 transition allows for more accurate quantitation when using 13C labeled standards. 

Figure 5. RADAR dual scan-MRM data for salmon liver (Figure 5a) with taurocholate (peak a) and PFOS interferent deoxytaurocholate (peak b) also shown is PFOS MRM transitions at 2.75 ng/g. 

Figure 5b. Product ion scans used to aid identification of the two bile acids.

The high concentrations of taurocholate and deoxytaurocholate in the extracts lead to retention time shifting. This could be clearly observed in the RADAR dual scan-MRM data as the retention time shifts regions correlated with the elution region for these matrix components. This is likely due to stationary phase saturation caused by these two bile acids. The RADAR dual scan-MRM data allows a targeted approach to be taken to reduce matrix effects in future analysis with the development of an additional sample cleanup for this matrix.

It is clear that continuously monitoring sample background using a RADAR dual scan-MRM approach can lead to more information about the challenges of each individual sample. This is a novel intra-sample QC check that has the potential to help improve quality within PFC analysis and is a possibility brought by Xevo TQ-MS.

Conclusion

  • ACQUITY UPLC allows fast separations of PFCs to ensure high sample throughput.
  • Xevo TQ-MS used with the PFC Analysis Kit enables high sensitivity PFC analysis in a variety of environmental matrices.
  • RADAR dual scan-MRM allows full scan data to be acquired alongside routine MRM data. This allows continuous monitoring of sample background and can lead to more information about the challenges of each individual sample.
  • The ability to simultaneously acquire quantitative and qualitative information in a single run can lead to reduced method development time and ultimately offers a unique intra-sample QC check when used for routine analysis. This can help drive improvements in the quality of data produced by a laboratory.

References

  1. http://chm.pops.int/Convention/Pressrelease/COP4Geneva8May2009/ tabid/542/language/en-US/Default.aspx 
  2. Jahne A, Berger U. J. Chrom A. 2009; 1216:410-421. 
  3. LindstrÖm G, Kärrman A, van Bavel B. J. Chrom A. 2009; 1216:394-400. 
  4. van Leeuwen S P J, Swart C P, van der veen L., de Boer J. J Chrom A. 2009;1216:401-409. 
  5. Lee P J, Bernier E T, Fujimoto G T, Shia J, Young M S, Di Gioia A. Waters Application Note no.720002813en. 
  6. International Organization for Standardization. ISO/DIS 25101 (www.iso.org). 
  7. Kärrman, A, Domingo, J L, Nadal, M, van Bavel, B, Lindström, G. 2009; Env Science Pollution Research doi:10.1007/s 11356-009-0178-5. 
  8. Pfeifer T, Klaus U, Hoffmann R, Spiteller M. J Chrom A. 2001;926:151-159. 
  9. Steen R J C A, Hogenboom A C, Leonards P E G, Peerboom R A L, Cofino W P, Brinkman U A.Th. J Chrom A. 1999;857:157-166. 
  10. Stroobant V, de Hoffmann E, Libert R, Van Hoof F. J ASMS. 1995; 6; 588-596. 
  11. Benskin J P, Bataineh M, Martin J W. Ana. Chem. 2007; 79, 6455-6464.

720003162, Januray 2014

トップに戻る トップに戻る