• アプリケーションノート

Trace Level Quantification of Pesticide Residues in Mixed Vegetable Juice Using ACQUITY UPLC I-Class Coupled with Ultra-Sensitive Xevo TQ-S

Trace Level Quantification of Pesticide Residues in Mixed Vegetable Juice Using ACQUITY UPLC I-Class Coupled with Ultra-Sensitive Xevo TQ-S

  • Dimple D. Shah
  • Jennifer A. Burgess
  • Waters Corporation
Bottles of juice with fruits and vegetables on table

This is an Application Brief and does not contain a detailed Experimental section.

Abstract

This application brief demonstrates the capabilities of ultra-sensitive MS for the quantitative analysis of pesticides that may be present at very low levels in mixed vegetable juice samples.

Benefits

Rapid detection and accurate quantification of trace level pesticides in mixed vegetable juice samples using the ACQUITY UPLC I-Class System with the ultra-sensitive Xevo TQ-S Mass Spectrometer.

Introduction

Detection of pesticides in food is essential for protecting human health. Due to the low limits of detection required to meet legislation and the complex matrices in which pesticides are present, trace level detection and quantification can be very challenging for food testing laboratories. Liquid chromatography coupled with tandem quadrupole mass spectrometry is one of the most powerful techniques for the analysis of pesticides in food. To detect and quantify low levels of pesticides in the presence of abundant matrix components requires robust and highly sensitive mass spectrometry. The combination of the ACQUITY UPLC I-Class System with the ultra-sensitive Xevo TQ-S facilitates trace level detection and quantification of residues in food and beverage products. This technology brief demonstrates accurate quantification analysis of trace level pesticides in mixed vegetable juice samples.

Results and Discussion

Three mixed vegetable juice samples and a list of 29 possible pesticide residues were provided by the Food Industry Analytical Chemists (FIAC) share group of the Grocery Manufacturers Association (GMA). The samples were prepared using the QuEChERS protocol with the Waters DisQuE Sample Preparation Kit. To separate and detect all 29 pesticides, an LC-MS/MS method with two MRM transitions for each pesticide was created using the QUANPEDIA database which contains optimized method details for over 600 pesticide residues. The samples were analyzed on an ACQUITY UPLC BEH C18 Column using a gradient of 10-mM ammonium acetate at pH 5 in water/methanol. The data were processed using TargetLynx Software.

A targeted screen was performed on the three juice samples for the presence of 29 pesticides. From this screen, it was determined that one of the samples did not contain any of the listed pesticides. This sample was then used to prepare the matrix-matched standards (MMS). First, the sample was spiked at 10 ppb with the 29 possible pesticides and prepared using the same sample extraction protocol to determine the recovery of each of the pesticide residues. The percentage recovery was calculated at 10 ppb with recoveries ranging from 79% to 113%.

To prepare the MMS in order to create a matrix-matched calibration curve, a mix of the 29 pesticides was post-spiked into the blank sample extract from 1 to 500 ppb. Calibration curves with correlation coefficients (R2) above 0.995 were obtained for all of the compounds (data not shown). The matrix-matched calibration curve was used to quantify the pesticides detected in the other two samples.

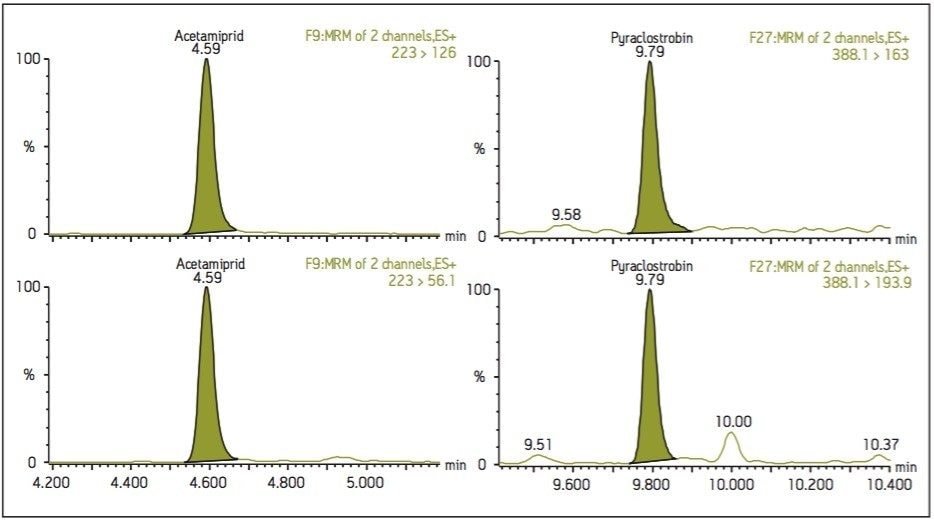
For all detected pesticides, ion ratios from the two MRM transitions were used to confirm a positive identification (ion ratios confirmed within tolerance, in accordance with 2002/657/EC).

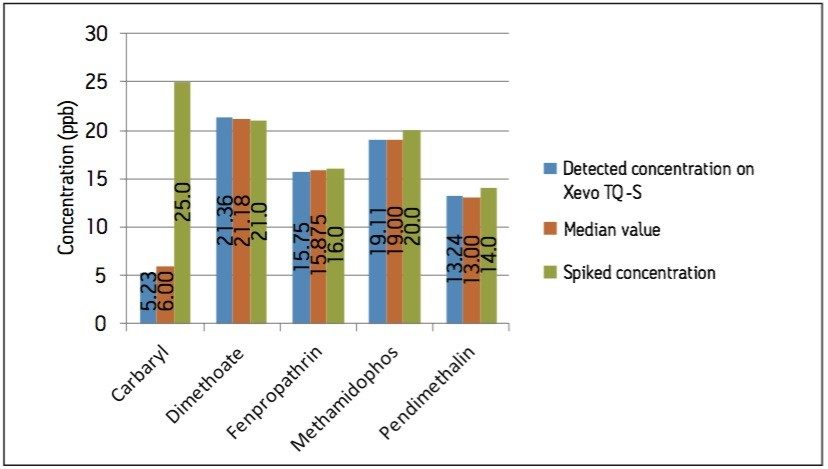
Following submission of the results, the values of the spiked concentrations and (blinded) reported concentrations were provided by FIAC to all participating laboratories. Figure 1 shows the measured concentration obtained for sample one compared to the spiked concentration and median value of reported results from other participating laboratories.

Results showing the spiked concentration, median value and the concentration detected using Xevo TQ-S in mixed vegetable juice sample one.
Figure 1. Results showing the spiked concentration, median value of the results from all participating labs, and the concentration detected using Xevo TQ-S in mixed vegetable juice sample one.

To evaluate results, Z-score values were calculated for all the detected compounds. The Z-score was calculated using, Z = (x-X)/α formula, where x is the result reported by the participant, X is the median value of reported results from all participating labs, and α is the standard deviation. Table 1 shows the Z-score value for samples one and two using the ACQUITY UPLC I-Class System with Xevo TQ-S.

The Z-score values for samples one and two.
Table 1. The Z-score values for samples one and two.

A Z-score of less than or equal to two is considered satisfactory, between two and three is questionable, whereas a Z-score greater than three is unsatisfactory. All Z-score values for both samples were less than two, indicating accurate quantification of the unknown pesticides present in the samples.

As shown in Figure 1 and Table 1, the detected compounds were in close agreement with the median value for the results. Methomyl, however, was not detected in the samples analyzed in our laboratory. In order to determine whether methomyl could be detected using this method, a fresh methomyl standard was spiked into the blank vegetable sample at 10 ppb. This concentration was easily detected with the LC-MS/MS method, indicating that the compound would have been detected. It is known that methomyl readily degrades to methomyl sulfoxide and N-chlormethomyl. Since the samples were stored in the refrigerator for two weeks prior to analysis, it is postulated that the methomyl degraded prior to analysis.

In addition to the pesticides reported in Table 1, ultra-low levels of two additional pesticides were detected in all three mixed vegetable juice samples. Acetamiprid (0.51 ppb) and pyraclostrobin (0.17 ppb) were found to be at the same level in all three samples (concentrations determined by standard addition method). Figure 2 shows MRM chromatograms of acetamiprid and pyraclostrobin in sample one.

MRM chromatograms of acetamiprid and pyraclostrobin in mixed vegetable juice samples.
Figure 2. MRM chromatograms of acetamiprid and pyraclostrobin in mixed vegetable juice samples at ultra-trace levels (acetamiprid - 0.51 ppb and pyraclostrobin - 0.17 ppb).

Conclusion

The combination of the high resolution ACQUITY UPLC I-Class System and Xevo TQ-S offers the ability to detect and quantify contaminants at ultra-trace levels in complex food matrices. This blind study demonstrates the capability for accurate quantification of the spiked pesticides and also shows detection of ultra-low levels of unexpected pesticides in the sample.

Acknowledgements

Waters would like to thank the Grocery Manufacturers Association for the opportunity to participate in the share groups organized by FIAC.

720004733, June 2013

トップに戻る トップに戻る