• アプリケーションノート

Ensuring Seafood Safety with Rapid Screening for Polyaromatic Hydrocarbons Using LC-Fluorescence

Ensuring Seafood Safety with Rapid Screening for Polyaromatic Hydrocarbons Using LC-Fluorescence

  • Mark E. Benvenuti
  • Jennifer A. Burgess
  • Waters Corporation
Fresh raw fish and seafood

Abstract

To demonstrate that the combination of the DisQuE Sample Preparation Kit with UPLC-FLR provides a rapid screening tool for the detection of PAHs in seafood.

Benefits

  • Screen PAHs in seafood in under 4 minutes
  • Achieve accurate results with faster, easier sample preparation
  • Selective measurement through the use of fluorescence detection

Introduction

Major oil spills, such as the Exxon Valdez in 1989 and the April 2010 Gulf of Mexico oil spill, have raised concerns over the quality of seafood harvested from these regions. Fish, crustaceans, and mollusks may come into contact with, or ingest the oil thereby introducing potential health risks to consumers.

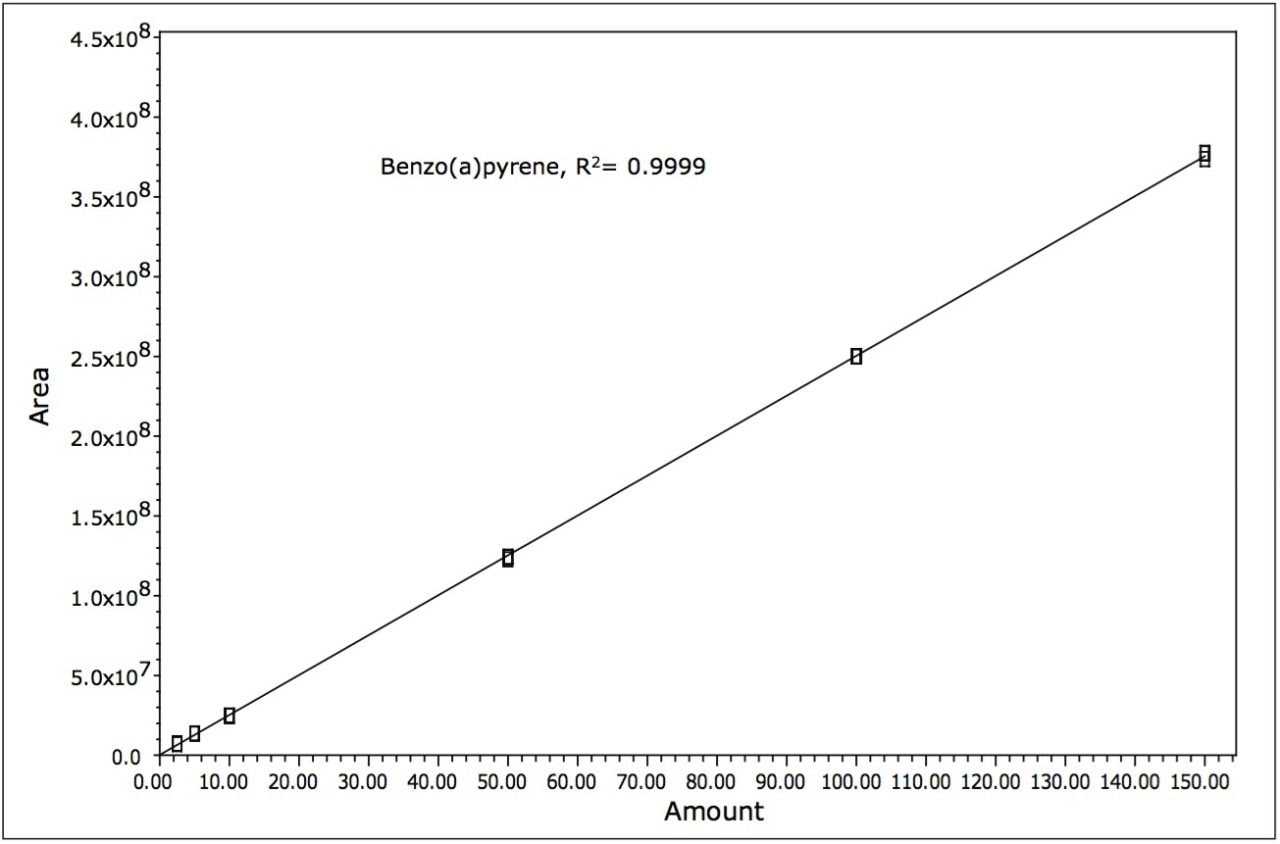
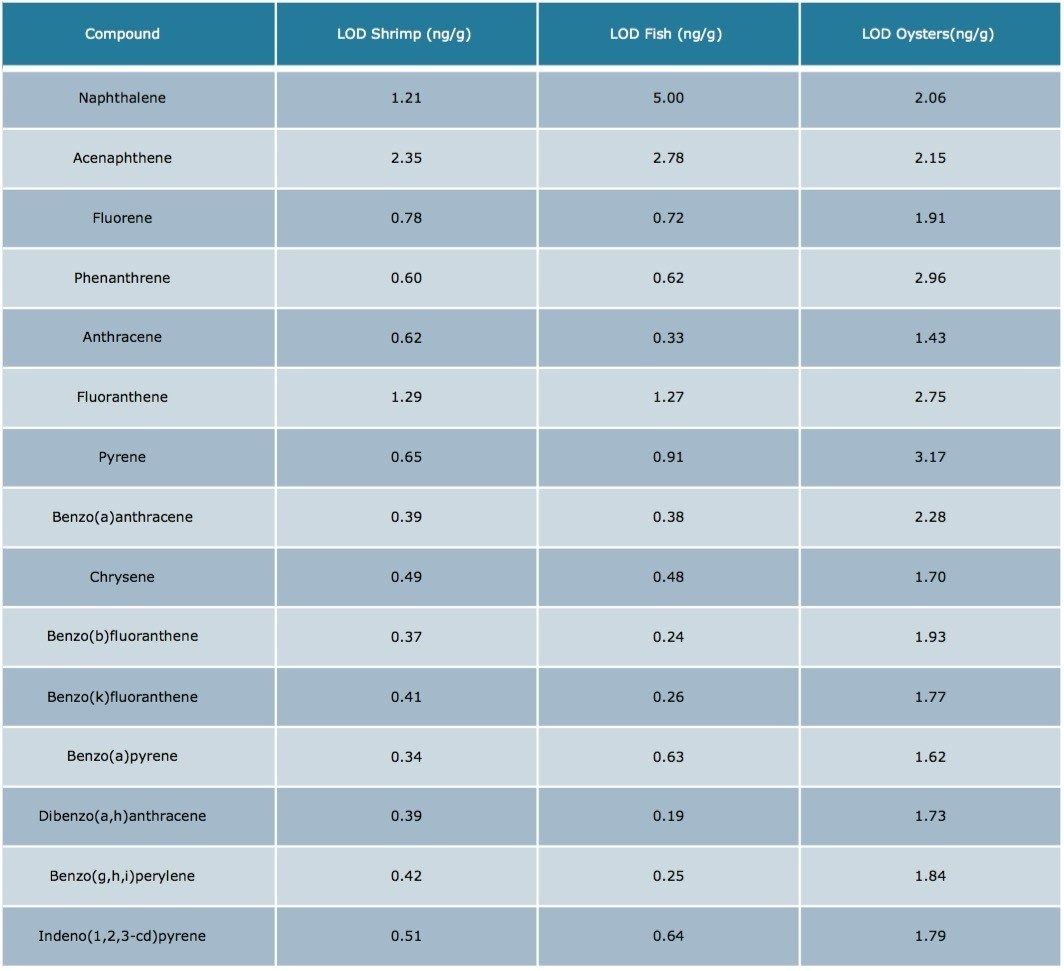
Of the many compounds found in oil, an important subset is the Polyaromatic Hydrocarbons (PAHs). The US Environmental Protection Agency (US EPA) has defined these compounds as priority pollutants.1 The US Food and Drug Administration (US FDA) has also established levels of concern ranging from 3.5 x 10⁻² mg/kg benzo(a) pyrene in finfish, to 2.0 x 10³ mg/kg combined phenanthene and anthracene in oysters.2 Confirmatory analysis is required if any PAHs are detected at half the level of concern.2

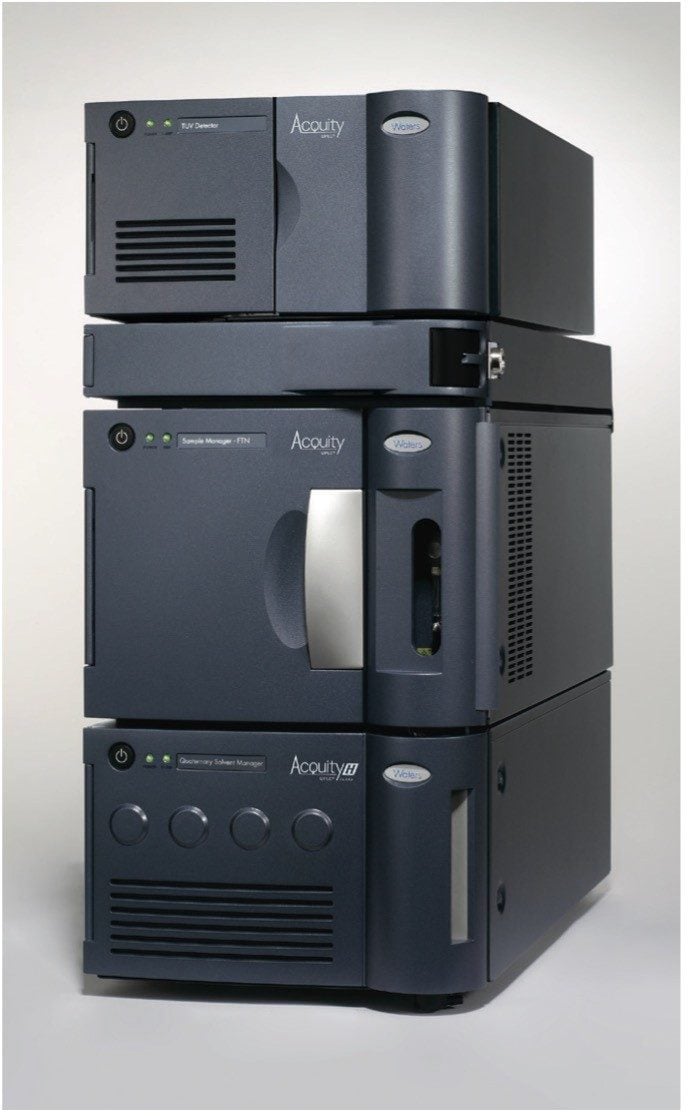
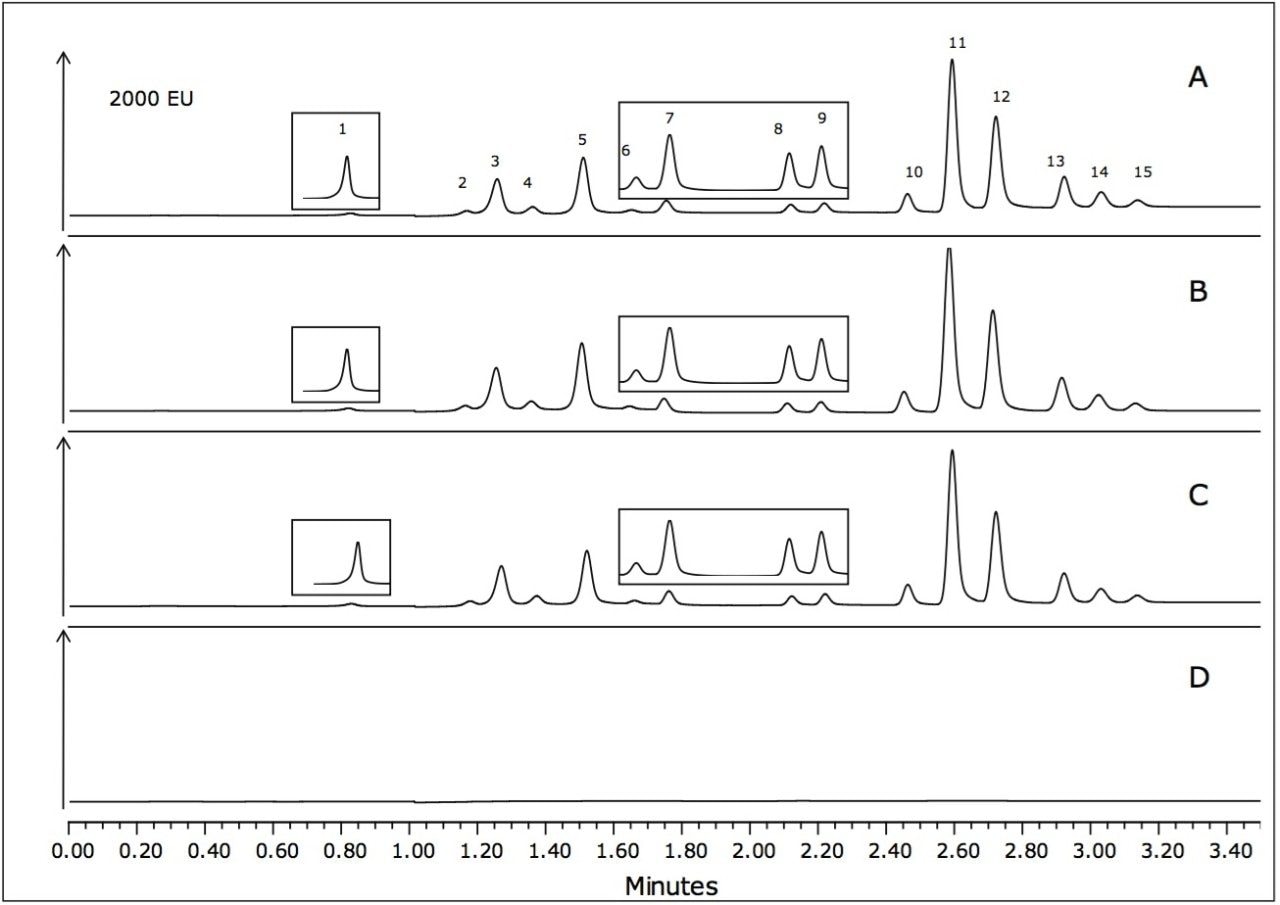
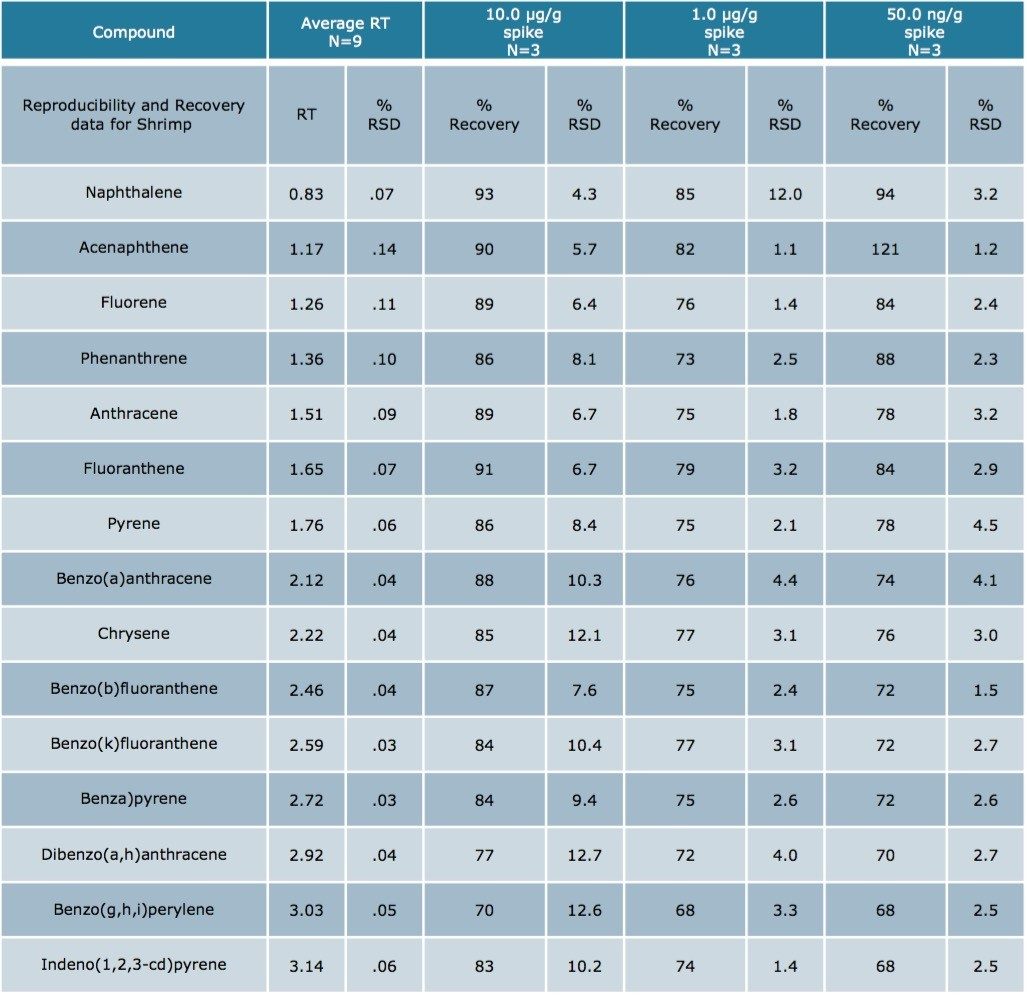
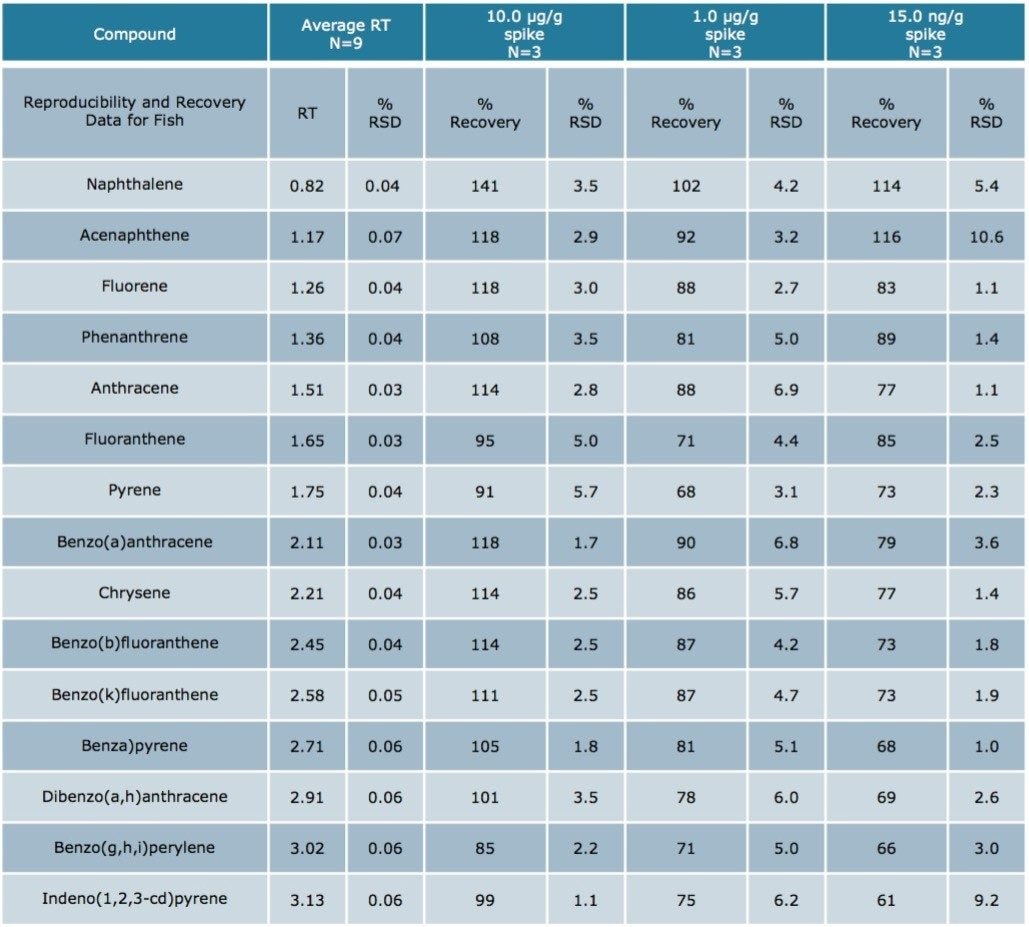
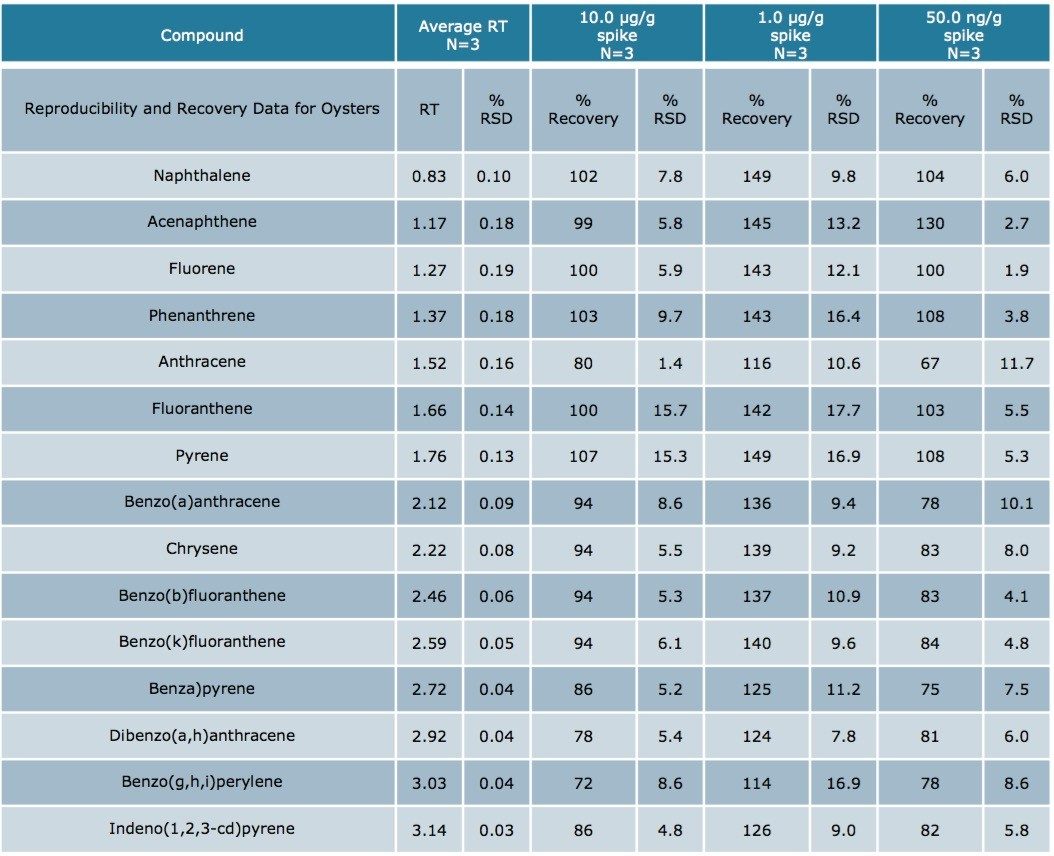
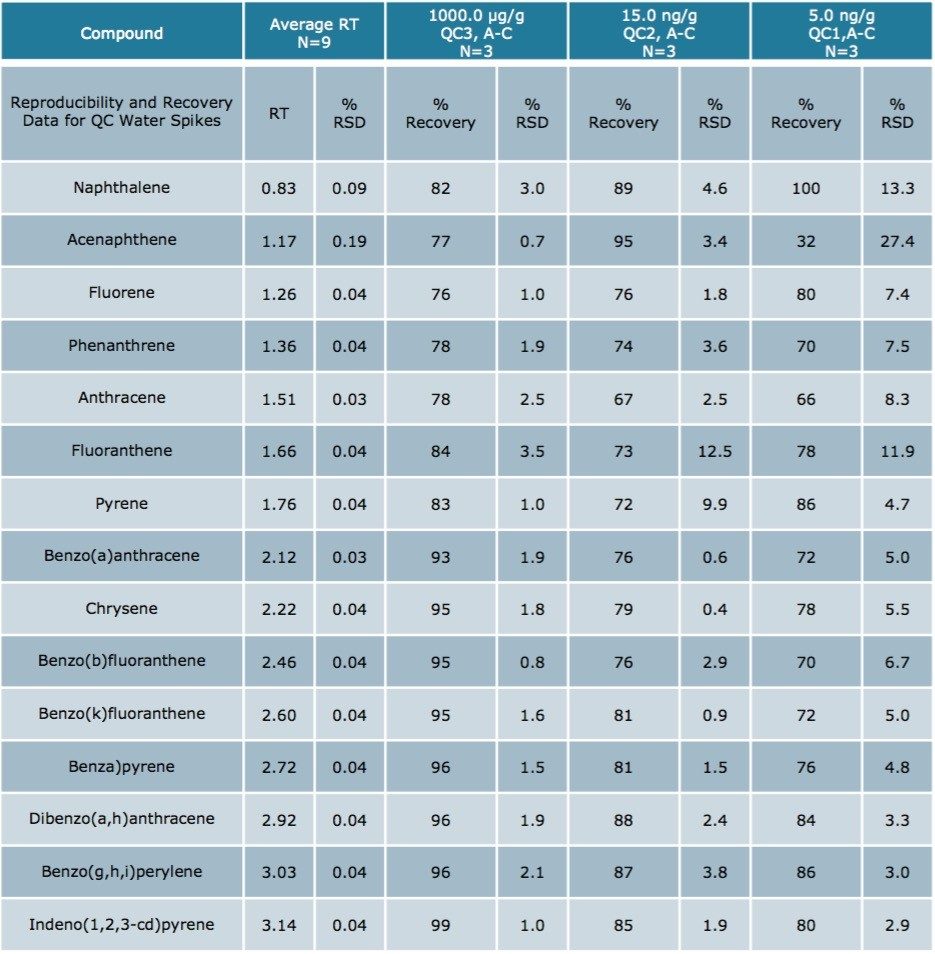
To prevent consumption of contaminated seafood and minimize the impact on the seafood industry, a fast screening method is required to analyze these compounds of concern at the stated levels. Here we demonstrate that, following a simple extraction method using Waters DisQuE Dispersive Sample Preparation Kit (QuEChERS), an analysis of PAHs can be achieved in less than 4 minutes using the ACQUITY UPLC H-Class System with Fluorescence Detection.

ACQUITY UPLC H-Class System with FLR.
Figure 1. ACQUITY UPLC H-Class System with FLR.

Experimental

LC conditions

System:

ACQUITY UPLC H-Class with Large Volume Flow Cell (LVFC)

Column:

PAH 4.6 x 50 mm, 3 μm

Column temp.:

35 °C

Injection volume:

10 μL

Sampling rate:

20 pts/sec

Detection:

Fluorescence using timed programmed wavelength changes

Software:

Empower 2

Mobile phase A:

Milli-Q water

Mobile phase B:

Methanol, Fisher Optima Grade

Mobile phase C:

Acetonitrile, Fisher Optima Grade

Standards:

PAH Certified Standard, AccuStandard M 8310

Flow rate:

2.0 mL/min

Gradient profile

Gradient profile

Sample preparation

Individual samples of fish fillets (flounder), shelled shrimp, and shucked oysters with liquor were homogenized using a food processor per the method described by Ramalhosa et. al.3 15 grams of each homogenized tissue were added to individual centrifuge tubes and spiked at three different levels, 50 ng/g, 1 μg/g, and 10 μg/g for shrimp and oysters, 15 ng/g, 1 μg/g, and 10 μg/g for fish, with a spiking solution prepared from the certified PAH standard. 5 mL of water were added to the fish and shrimp samples to aid mixing. The oysters did not need extra liquid. The spiked samples were thoroughly mixed and allowed to sit at room temperature for an hour.

To each centrifuge tube was added the contents of a DisQuE tube (P/N 186004571), 6 g magnesium sulfate + 1.5 g sodium acetate, and 15 mL of acetonitrile. The centrifuge tube was shaken vigorously for at least one minute to produce an emulsion of seafood tissue, buffer salts and acetonitrile. Here also the procedure of Ramalhosa3 was followed as no acetic acid was added to the acetonitrile, nor was a secondary PSA cleanup step carried out. Initial work in our laboratory confirmed that the PSA step was not required for LC-FLR analysis (data not shown). After centrifuging at 3000 rpm for 5 minutes, a portion of the clear acetonitrile supernatant layer was transferred to an autosampler tube for direct injection. The 1 μg/g and 10 μg/g spikes were diluted with acetonitrile 1:10 and 1:100 respectively. Samples were quantified using a six-point linear calibration curve. Standards were prepared by diluting the certified standard with acetonitrile.

Results and Discussion

Dispersive sample preparation, often referred to as QuEChERS, is a well proven and fast sample preparation method for the analysis of pesticides in food commodities.4 More recently, this method has been used to extract other contaminants from food matrices, including polyaromatic hydrocarbons.3

The separation of the 15 fluorescent PAHs that are listed as priority pollutants by the US EPA was achieved in only 3.5 minutes using the ACQUITY UPLC H-Class System. The separation of the analytes is shown in Figure 2, with the timed programmed wavelength changes indicated by arrows.

Separation of PAH analytes
Figure 2. Separation of PAH analytes (0.1 mg/L) using timed programmed wavelength changes as indicated by arrows. PAH analytes are identified as follows: (1) naphthalene, (2) acenaphthene, (3) fluorene, (4) phenanthrene, (5) anthracene, (6) fluoranthene, (7) pyrene, (8) benzo(a)anthracene, (9) chrysene, (10) benzo(b)fluoranthene, (11) benzo(k)fluoranthene, (12) benzo(a)pyrene, (13) dibenzo(a,h)anthracene, (14) benzo(g,h,i)perylene, (15) indeno(1,2,3-cd)pyrene.

Example chromatograms of the shrimp, fish, and oyster matrices spiked at 10 μg/g are shown in Figure 3. Certain sections of the chromatograms have been magnified to more clearly show the peaks of interest. As shown in Figure 3D, the blank water sample that was also carried through the sample preparation procedure shows a very clean chromatogram.

Chromatograms of PAHs spiked
Figure 3. Chromatograms of PAHs spiked into (A) shrimp, (B) fish, and (C) oysters at 10.0 μg/g (diluted 1:100 with acetonitrile following extraction). Insets show zoomed peaks for (1) naphthalene, (6) fluoranthene, (7) pyrene, (8) benz (a)anthracene, and (9) chrysene. The blank water sample (D) taken through the extraction procedure is also shown.

Samples of unspiked seafood matrices that were used in this sample preparation procedure also showed no matrix interference, as shown in Figure 4.

Chromatograms (A) unspiked shrimp, (B) fish, and (C) oysters carried through the QuEChERS procedure, along with a water blank (D)
Figure 4. Chromatograms (A) unspiked shrimp, (B) fish, and (C) oysters carried through the QuEChERS procedure, along with a water blank (D). Changes in the baseline are a result of the programmed wavelength changes.

Samples were quantified against six point calibration curves of each of the analytes. An example calibration curve is shown for benzo(a)pyrene in Figure 5. Linearity (R2) was > 0.995 for all analytes.

Calibration curve for benzo(a)pyrene
Figure 5. Calibration curve for benzo(a)pyrene (2.5 to 150.0 μg/L).

Using Waters DisQuE Dispersive Sample Preparation Kit, PAHs were extracted from three different seafood matrices. The recoveries and percentage RSDs for shrimp, fish, and oysters are shown in Tables 1 to 3. Recoveries were in the range of 68% to 149%. Table 4 lists the recoveries for a series of QC water spikes, fortified at the levels listed and carried through the sample prep procedure previously described.

Recovery and reproducibility data for spiked shrimp.
Table 1. Recovery and reproducibility data for spiked shrimp.
Recovery and reproducibility data for spiked fish.
Table 2. Recovery and reproducibility data for spiked fish.
Recovery and reproducibility data for spiked oysters.
Table 3. Recovery and reproducibility data for spiked oysters.
Recovery and reproducibility data for QC water spikes.
Table 4. Recovery and reproducibility data for QC water spikes.

The results were excellent for all of the compounds at each fortification level, except the lowest level for acenapthene in water (5 ng/g). At this low level, acenapthene showed more variation owing to the small peak area and a sloping baseline that was only noticeable at this level. Table 5 is an estimation of the Limit of Detection based on seven replicates of each seafood matrix spiked at a 5 ng/g level, and calculated per US EPA 40 CFR, Appendix B to part 136 Rev 1.15.

Limit of Detection (LOD) data
Table 5. Limit of Detection (LOD) data for spiked shrimp, fish, and oysters, calculated per the standard deviation of seven individual spikes at the 5 ng/g level of each seafood matrix per US EPA 40 CFR, Appendix B to part 136 Rev 1.1.

This application note demonstrates that the combination of the DisQuE Sample Preparation Kit with LC-FLR provides a rapid screening tool for the detection of PAHs in seafood.

Conclusion

  • Dispersive sample preparation provides a fast and effective method for extracting PAHs from different seafood matrices.
  • This method demonstrates advantages over other sample preparation techniques as accurate results can be achieved with less sample preparation and in a shorter time.3
  • With sample preparation times reduced, a rapid chromatographic separation is critical to manage the samples, standards, and QCs generated using this approach.
  • The ACQUITY UPLC H-Class System’s separation, which was achieved in less than 4 minutes, is able to address this demand.
  • This solution allows laboratories to screen for PAHs in seafood, providing results in a timely and economical manner, so consumers can be confident that these products are safe.

References

  1. USEPA Method 8310 “ PolyNuclear Aromatic Hydrocarbons “ Rev 0, September, 1986.
  2. Gratz et. al., “Screen for the presence of polycyclic aromatic hydrocarbons in select seafoods using lc-fluorescence”, USFDA Laboratory Information Bulletin, pp. 29, July, 2010.
  3. Ramalhosa et. al., “Journal of Separation Science”, 2009, 32, pp. 3529-3538.
  4. Anastassiades et. al. Journal of the AOAC Int, 2003. 86, pp. 412.
  5. EPA 40 CFR, Appendix B to part 136 Rev 1.1 pp. 566.

720003891, December 2013

トップに戻る トップに戻る