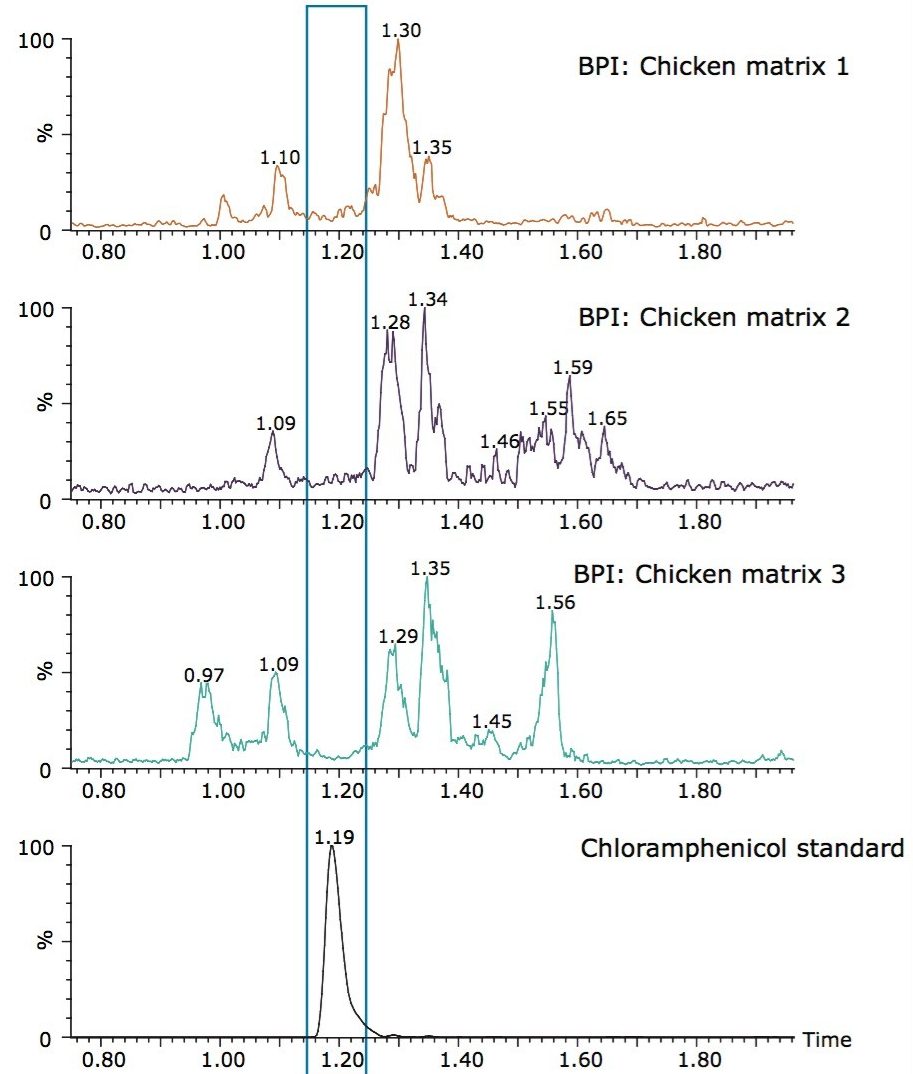
Chloramphenicol, an effective broad spectrum antibiotic, is widely used in medicinal and veterinary practices. Its use in humans is restricted due to potential harmful effects. Chloramphenicol is reported to be a cause of a potentially fatal blood condition called idiosyncratic aplastic anemia, and hypersensitivity to the drug affects around one in 30,000 people, regardless of dosage.1 It is also anticipated to be carcinogenic. As a consequence, chloramphenicol is not approved for use in food-producing animals. However, due to its wide availability and low cost, it is used to prevent bacterial infections in aquaculture, apiculture, and poultry farming. Chloramphenicol levels in animal products are strictly monitored. In Europe, the minimum required performance limit (MRPL) for chloramphenicol is 0.3 µg/kg in any food of animal origin,2 and similar limits have been adopted in other countries, including the United States.
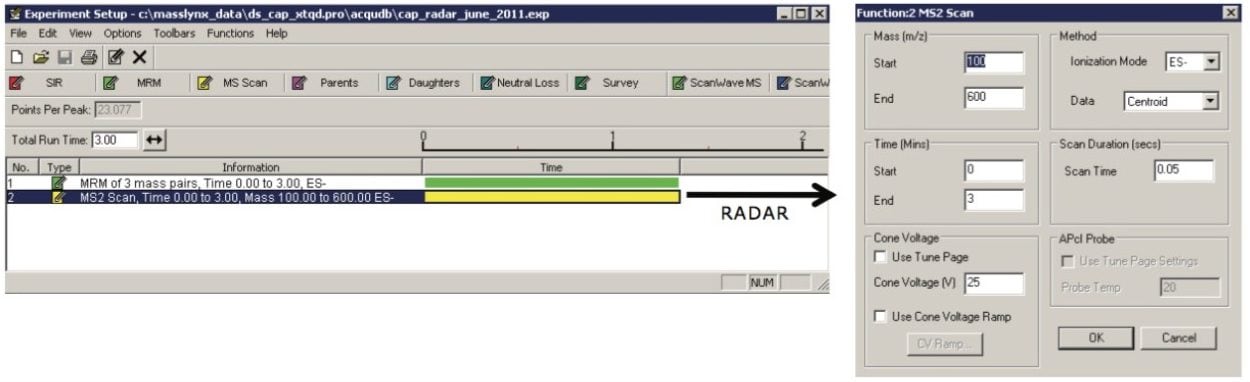
In this application note, chloramphenicol was analyzed with a three-minute runtime using Waters ACQUITY UPLC System, coupled with Xevo TQD and MassLynx Software. The Xevo TQD is a reliable, reproducible, and accessible tandem quadrupole mass spectrometer for routine quantitative and qualitative trace analysis. It incorporates RADAR Technology, which allows for the simultaneous acquisition of multiple reaction monitoring (MRM) transitions and full spectrum data. RADAR was used for method development and background monitoring during the analyses.