• アプリケーションノート

Analysis of Organic Light Emitting Diode Materials by UltraPerformance Convergence Chromatography Coupled with Mass Spectrometry (UPC2/MS)

Analysis of Organic Light Emitting Diode Materials by UltraPerformance Convergence Chromatography Coupled with Mass Spectrometry (UPC2/MS)

  • Michael D. Jones
  • Andrew J. Aubin
  • Peter J. Lee
  • Timothy Jenkins
  • Waters Corporation

Abstract

A rapid and selective method was developed using UltraPerformance Convergence Chromatography (UPC2) coupled with photodiode array detection and mass spectrometry to analyze the purity of iridium complex dye. This UPC2 approach resulted in up to 10X improvements in run time, solvent consumption and waste, compared to previously reported LC-MS techniques.

Benefits

  • Provides an approach to improved profiling of material purity
  • 10X reduction in run time compared to previously published liquid chromatography techniques
  • Significant cost reduction in mobile phase consumption and waste

       -  Approximately $1.91 for HPLC vs. $0.05 for UPC2

  • Compatibility with normal phase diluents and extraction solvents associated with organic light emitting diode (OLED) analysis

Introduction

Organic light emitting diodes (OLEDs) are thin films that exhibit electroluminescence when an electric current is applied. They are used in a variety of everyday electronics such as televisions, mobile phones,  computer monitors, watches, and display screens. The continued development and commercialization of OLEDs is of major interest to companies developing next-generation display technology and their suppliers. 

The raw materials used to construct OLED-based devices require high purity to extend the life of the luminescence and quality of the final product, specifically blue phosphorescent emitters. There is much intellectual property associated with OLED materials, so manufacturing a high quality OLED raw material can also be highly lucrative. 

Intellectual property is a strong driver for the OLED chemical materials business, which limits commoditization and drives high manufacturing costs for OLED-based devices. Market analysis reports point to OLEDs as a key niche market over the next five years, predicted to grow to a $5 billion market by 2016.1 

Typically, OLED materials are analyzed by various microscopy techniques. Interestingly, a limited amount of LC-based methods have been cited in publications analyzing the stability of phosphorescent emitters used in OLED devices.2,3,4 Many of the published methods require an analysis time greater than 30 minutes. 

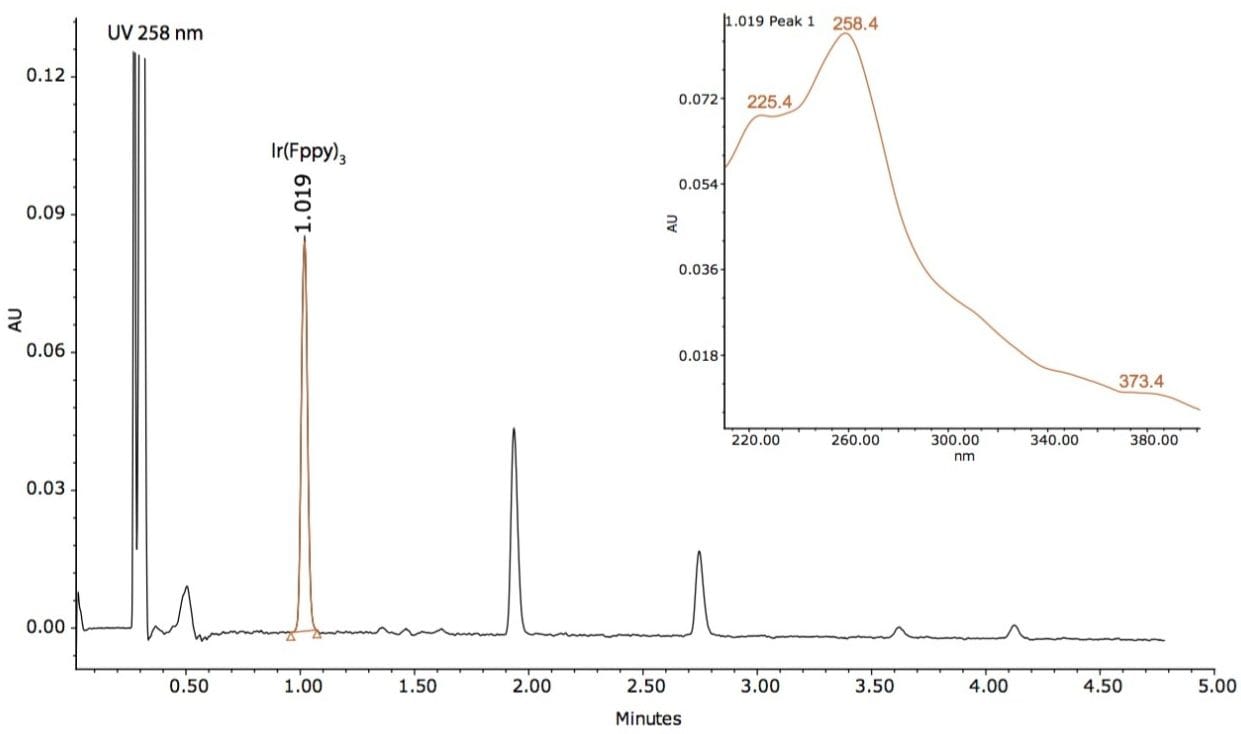
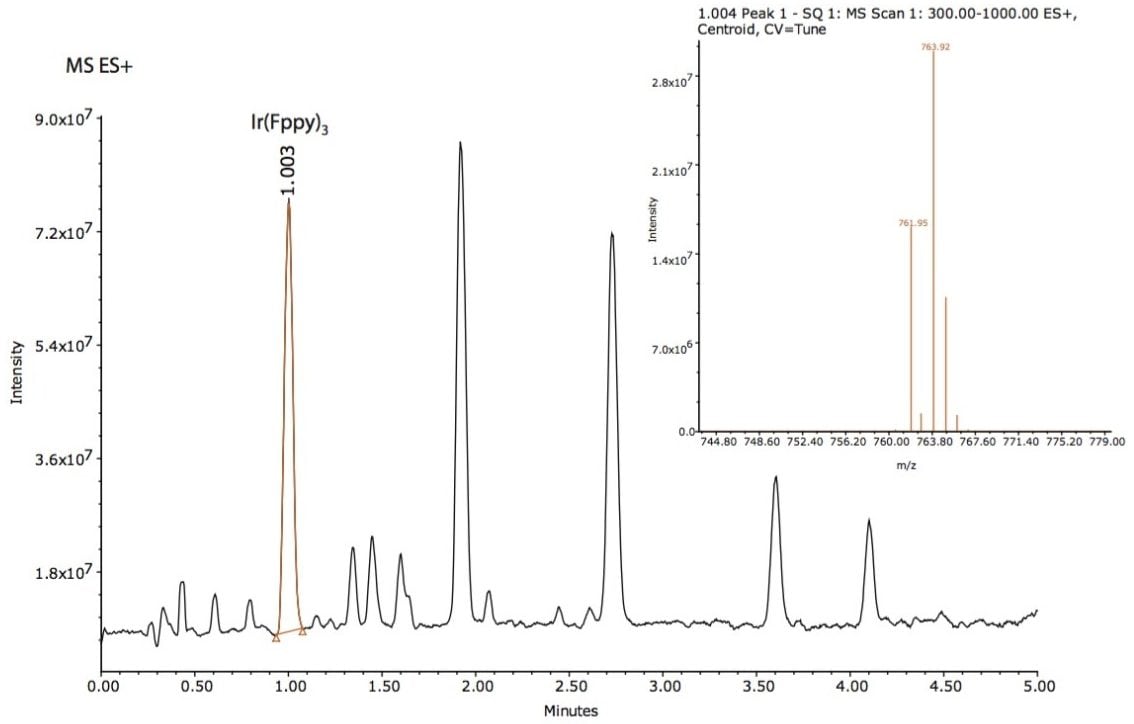
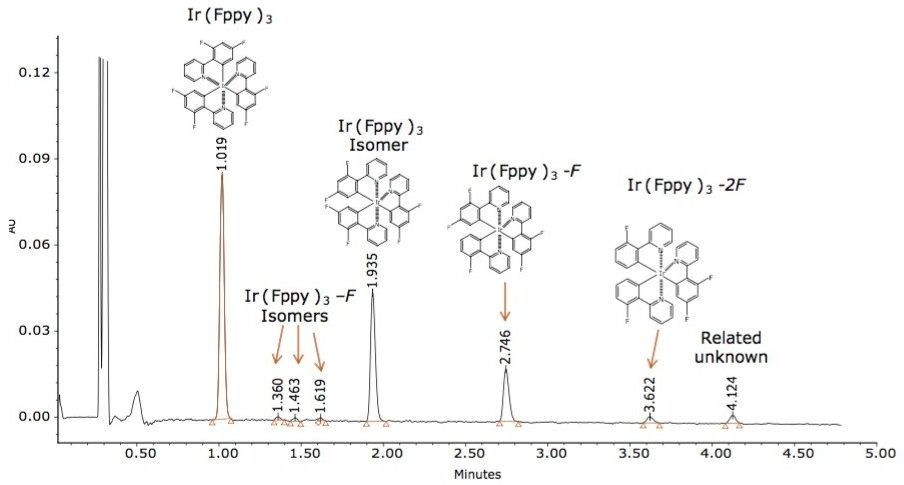
In this application note, a rapid and selective method was developed utilizing UltraPerformance Convergence Chromatography (UPC2) coupled with photodiode array detection and mass spectrometry to analyze the purity of an iridium complex dye, Ir(Fppy)3, shown in Figure 1. Ir(Fppy)3 is a phosphorescent emitter material that is important for providing blue electroluminescence longevity for use in OLED devices. The method specificity was also evaluated in the presence of additional materials used in the construction of OLED devices. 

The developed UPC2 method utilizes supercritical fluid chromatography (SFC) carbon dioxide as the primary mobile phase, and methanol as a modifier acting as the strong solvent to elute the planar organo-metallic based constituents of interest.

Figure 1. The chemical structure of iridium complex Tris[2-(2,4-difluorophenyl)pyridine] iridium(III), referred to as Ir(Fppy)3.

Experimental

Sample Description

Stock standards were prepared by diluting Ir(Fppy)3 reference material in tetrahydrofuran to a concentration of approximately 1.0 mg/mL. Working standards were prepared by dilution of the Ir(Fppy)3 stock standard with tetrahydrofuran to a concentration of 0.1 mg/mL. 

Method conditions

System:

Waters ACQUITY UPC2

Column:

ACQUITY UPC2 BEH 2-EP 3.0 x 100 mm, 1.7 μm

Mobile phase A:

CO2

Mobile phase B:

2 g/L Ammonium formate in methanol

Wash solvents:

70:30 Methanol/isopropanol

Separation mode:

Gradient: 10% to 25% B over 5 minutes; hold at 25% for 1 minute

Flow rate:

2.0 mL/min

CCM back pressure:

1885 psi

Column temp.:

60 °C

Sample temp.:

Ambient

Injection volume:

2.0 μL

Run time:

5.0 minutes

Detection:

ACQUITY UPC2 PDA

3D Channel: 200 to 410 nm; 20 Hz

2D Channel: 258 nm @ 4.8 nm resolution (Compensated 500 to 600 nm)

Mass spectrometer:

ACQUITY SQD

MS settings:

200 to 1200 Da; 10,000 Da/sec; ES PosNeg

Make-up flow:

None

Data management:

Empower 3 CDS Software

Results and Discussion

Method development

Typical SFC system configurations utilize a secondary pump to provide post column addition of proton-rich solvent, such as formic acid, to improve the ionization efficiency for MS analysis. The lack of ionization effectiveness of legacy SFC configurations can be attributed to the high flow of high-percentage liquid CO2 that lacks the protons required for ionization. The need for make-up flow was evaluated for use with UPC2.

The ACQUITY UPC2 System configuration and methodology used for this analysis did not require a secondary pump for make-up flow to increase ionization. The flow to the mass spectrometer was split post-UV detection with an Upchurch zero volume PEEK tee. However, it was determined that using 30 cm of 0.0025-inch I.D. PEEK tubing to the inlet of the MS probe provided enough back pressure after the split to maintain a supercritical CO2 phase state.

A method development scheme was initially designed to investigate three ACQUITY UPC2 Columns providing differences in chromatographic selectivity. The columns utilized were UPC2 BEH, UPC2 BEH 2-EthylPyridine (2-EP), and UPC2 CSH Fluoro-Phenyl stationary phases, specifically designed for use with the UPC2 instrumentation. Injections of the Ir(Fppy)3 degraded sample were performed using a rapid 5-minute gradient screening method. 

Based on this method development scheme and system configuration, it was observed that the ACQUITY UPC2 BEH 2-EP stationary phase provided the most optimal selectivity potential and best peak shape attributes to separate seven unknown impurities, as shown in Figures 2 and 3. The spectra inset in Figures 2 and 3 were used to determine relationship to the Ir(Fppy)3 phosphorescent emitter. The MS data provided added sensitivity to detect trace-level impurities such as the smaller peaks detected between 1 and 2 minutes, shown in Figure 3. By detecting these trace impurities by MS, the spectral information facilitates the determination of origin or possible relationship to the main species of interest.

Figure 2. UV 258 nm chromatogram (compensated 500 to 600 nm) of Ir(Fppy)3 and impurity peaks found in a degraded sample preparation. The integrated peak was determined as the Ir(Fppy)3 analyte. The inset figure is  the UV spectal profile of Ir(Fppy)3 with an observed λmax of 258.4 nm. 
Figure 3. MS ES+ total ion chromatogram (TIC) of Ir(Fppy)3 and impurity peaks found in a degraded sample preparation. The integrated peak was determined as the Ir(Fppy)3 analyte. The adjacent figure is the MS spectral isotopic profile of Ir(Fppy)3 with an observed m/z base peak of 763.9 Da.

Impurity Identification

The peaks found in the UV and the MS data were integrated with spectral information extracted from the 3D data channels in Empower 3 CDS Software. The software provided the ability to extract MS spectra from UV peaks of interest within a single window for efficient data review. 

A total of seven impurity peaks were found after subtraction of the blank injection peaks. Retention time,  UV spectra, and MS spectra are displayed in Table 1. Three of the seven impurities (RT 1.360 min, RT 1.463 min, and RT 1.619 min) were observed to have similar UV spectral profiles to that of the Ir(Fppy)3 phosphorescent emitter. The MS spectral analysis of the seven peaks revealed a distinct relationship to the Ir(Fppy)3 phosphorescent emitter.  

Table 1. Table of retention times, UV observed spectral profile, MS ES+ observed spectral profile, MS ES- observed spectral profile (if present). The MS spectral profiles verify similar isotopic patterns. Combined with the UV spectra, the unknown peaks were determined to be related to Ir(Fppy)3.

The Ir(Fppy)3 MS spectra have a unique isotopic ratio, as seen in the spectra found in Figure 3. All seven impurity peaks possessed isotopic ion ratios similar to the Ir(Fppy)3 phosphorescent emitter. Electrospray negative ion results were observed for three of the four later-eluting peaks. The negative ion information will help further investigations focused on impurity characterization by accurate mass measurements.

Unknown impurity characterization using nominal mass measurements is typically undesirable; however, the impurities observed during this experiment resemble the same isotopic patterns as the parent Ir(Fppy)3 compound. Based on the MS results, it is hypothesized that the unknown peak at retention time 1.94 minutes is an Ir(Fppy)3 isomer. The unknown peaks at retention times 1.330 min, 1.463 min, 1.619 min, and 2.75 min each represents a reduction of a fluorine atom from one of the fluoro-phenyl rings. The unknown peak at 3.622 min represents a reduction of two fluorine atoms from one of the fluoro-phenyl rings. The peak eluting at 4.12 min requires further investigation by MS/MS and accurate mass to better characterize a proposed structure, as shown in Figure 4.

Figure 4. Proposed structure assignments for the unknown impurities found in the Ir(Fppy)3 phosphorescent emitter sample.

Investigation of specificity

The method was investigated in terms of specificity using a mixture of other main ingredients used in the construction of OLED devices. The constituents within the mixture represent the phosphorescent emitter [Ir(Fppy)3], the hole transport material (α-NHP), the host material (TCTA), and the hole blocking material/electron transport material Alq3. The mixture was injected, and the assay method was determined to be specific to analyze all three doped compounds without interference with the Ir[Fppy]3 phosphorescent emmitter. System precision was determined over n=5 injections to assess method reproducibility, displayed in Figure 5.

Figure 5. Method tested for specificity and system precision. Overlay of a mixture of commonly used components in OLED production (n=5). %RSD of retention time and area are reported above each major compound in the mixture. The additional impurity peaks are those impurities related to Ir(Fppy)3.

Conclusion

A rapid 5-minute UPC2/MS method was developed to analyze Ir(Fppy)3 phosphorescent emitter purity, and an approach to monitor long-term stability. The MS data provided by the ACQUITY SQD facilitated characterization of three of the unknown impurity peaks. The UPC2 approach resulted in up to 10X improvements in run time, solvent consumption, and considerably reduced amounts of solvent waste when compared with previously reported LC-MS techniques that used 100% organic solvents during the analysis. The highly selective and unmatched specificity of this UPC2 approach will help chemical material manufacturers better understand and control the performance of these unstable blue phospho-organic light emitting diodes, ultimately leading to better quality OLED-based products and a means to improve protection of intellectual property.

References

  1. Bcc Research Market Report SMC069B, “Organic Light Emitting Diodes (OLEDs): Technologies and Global Markets” July 2011
  2. Sivasubramaniam et al, “Investigation of FIrpic in PhOLEDs via LC-MS Technique”, Cent. Eur. J. Chemistry, 7(4), (2009), 836-845
  3. Baranoff et al, “Sublimation Not an Innocent Technique: A Case of Bis-Cyclometalated Iridium Emoitter for OLED”, Inorg. Chem, 47, (2008), 6575-6577
  4. Kondakov, D., Lenhart, W., and Nichols, W., “Operational degradation of organic light-emitting diodes: Mechanism and identification of chemical products”, J. Appl. Physics, 101, 024512, (2007)

720004305, April 2012

トップに戻る トップに戻る