• アプリケーションノート

Utilizing the Increased Peak Capacity of UPLC Ion Mobility TOF MS and MSE to Overcome Sample Complexity

Utilizing the Increased Peak Capacity of UPLC Ion Mobility TOF MS and MSE to Overcome Sample Complexity

  • Michael McCullagh
  • Kieran J. Neeson
  • Cíntia A M Pereira
  • Janete H Yariwake
  • Waters Corporation

Abstract

This application note investigates the use of UPLC-IMS-CID-MSE using the SYNAPT G2-S, to determine if HDMS can provide a route to specific and unambiguous identification, and to facilitate the unequivocal distinction of flavonoid isomers in complex samples and matrices.

Benefits

  • Multiple identification points can be generated in a single analysis.
  • Accurate mass measurement of <2 ppm provides specific elemental composition information and hence more confidence in the structural elucidation data generated.
  • High Definition Mass Spectrometry (HDMS) enables the individual MSE fragmentation spectra to be distinguished for flavonoid isomers, which typically chromatographically co-elute with other components.
  • 10 times increase in peak capacity.
  • Ion Mobility Spectrometry (IMS) provides higher ion definition and analytical specificity.
  • The orthogonal separation obtained can be viewed seamlessly through the MSE Data Viewer.

Introduction

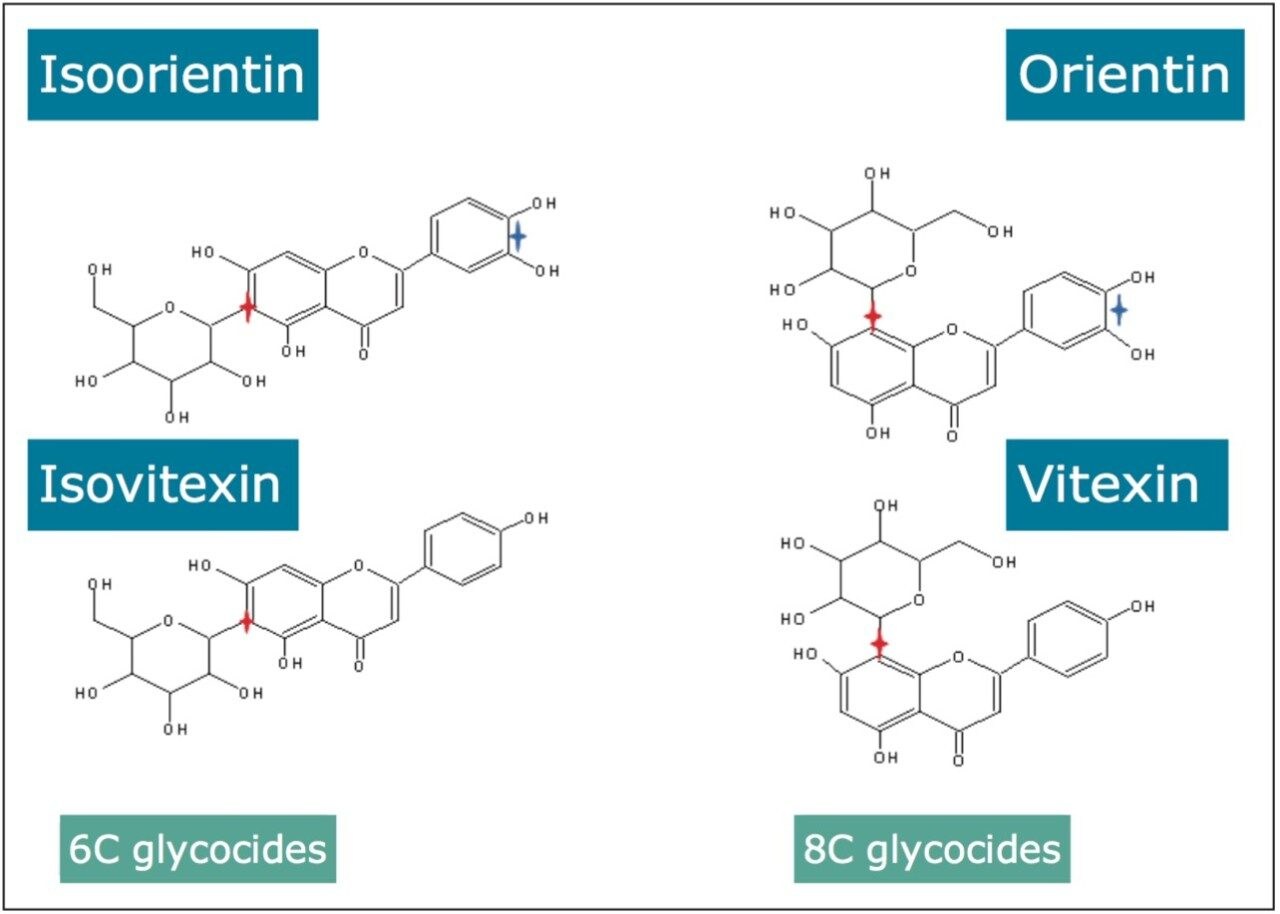
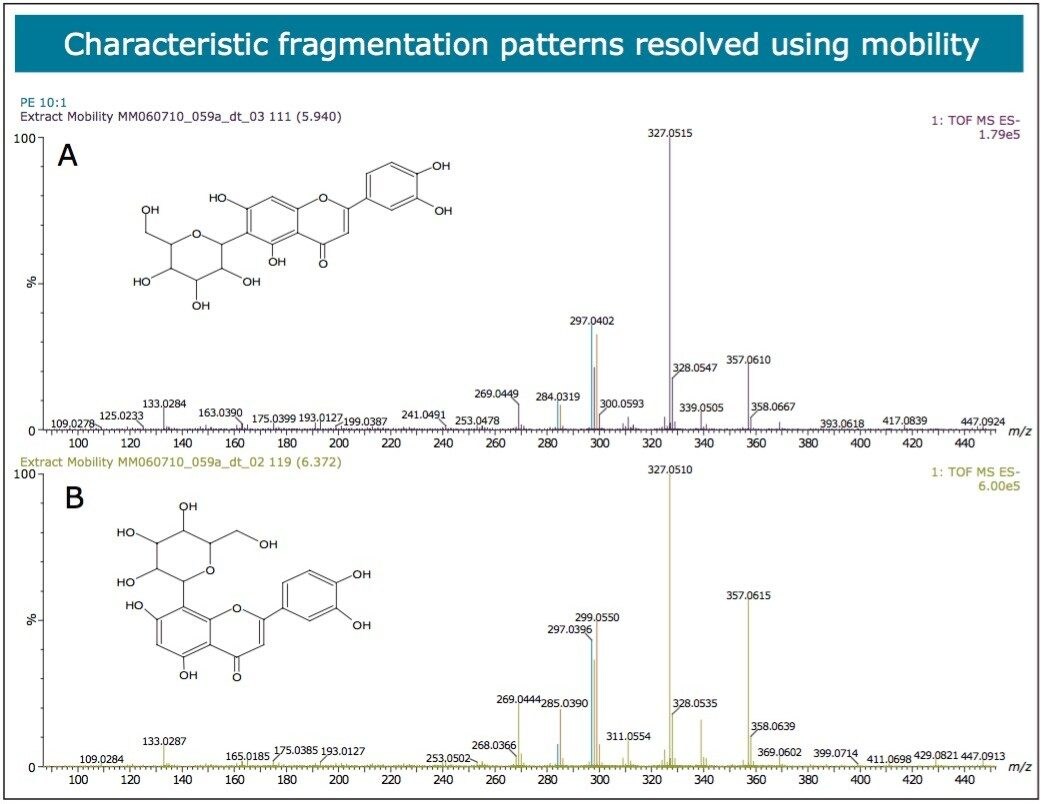
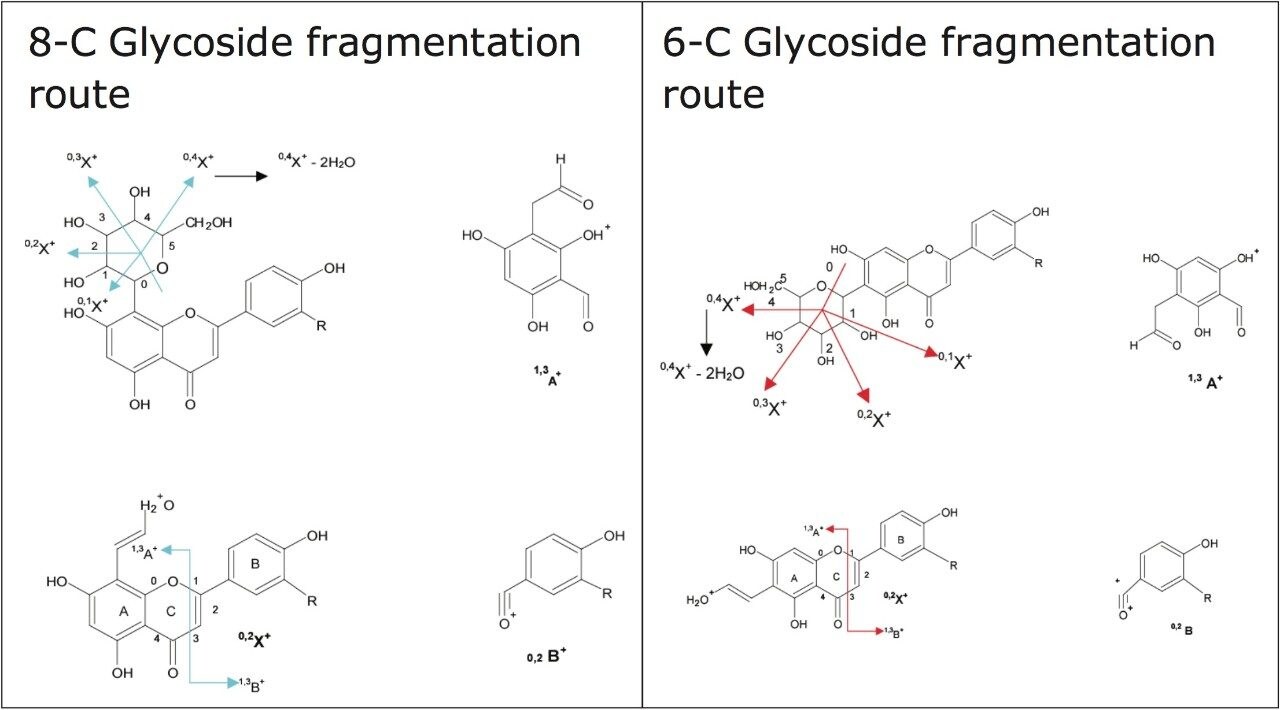
Flavonoids are one of the largest and most widespread classes of compounds that possess diverse pharmacological and biological properties. Such attributes mean many flavonoid-containing plant species may be used in functional foods or phytomedicines.1 Several Passiflora (Passifloraceae) species are utilized as phytomedicines (sedative/tranquilizing). Medicinal Passiflora species contain flavonoids, mainly C-glycosylflavones (apigenin and luteolin derivatives, frequently occurring as isomers). LC-MS techniques, such as MSE combined with accurate mass measurement and ion mobility may be an important tool for unequivocal identification of flavonoid isomers in complex mixtures such as phytomedicines.

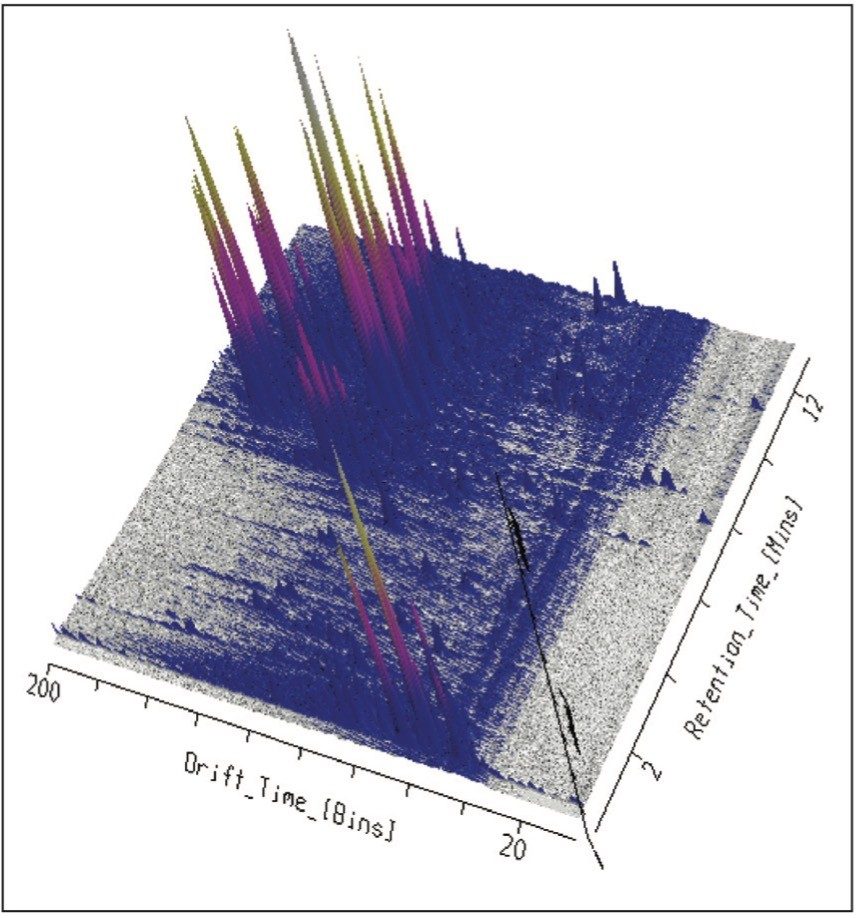
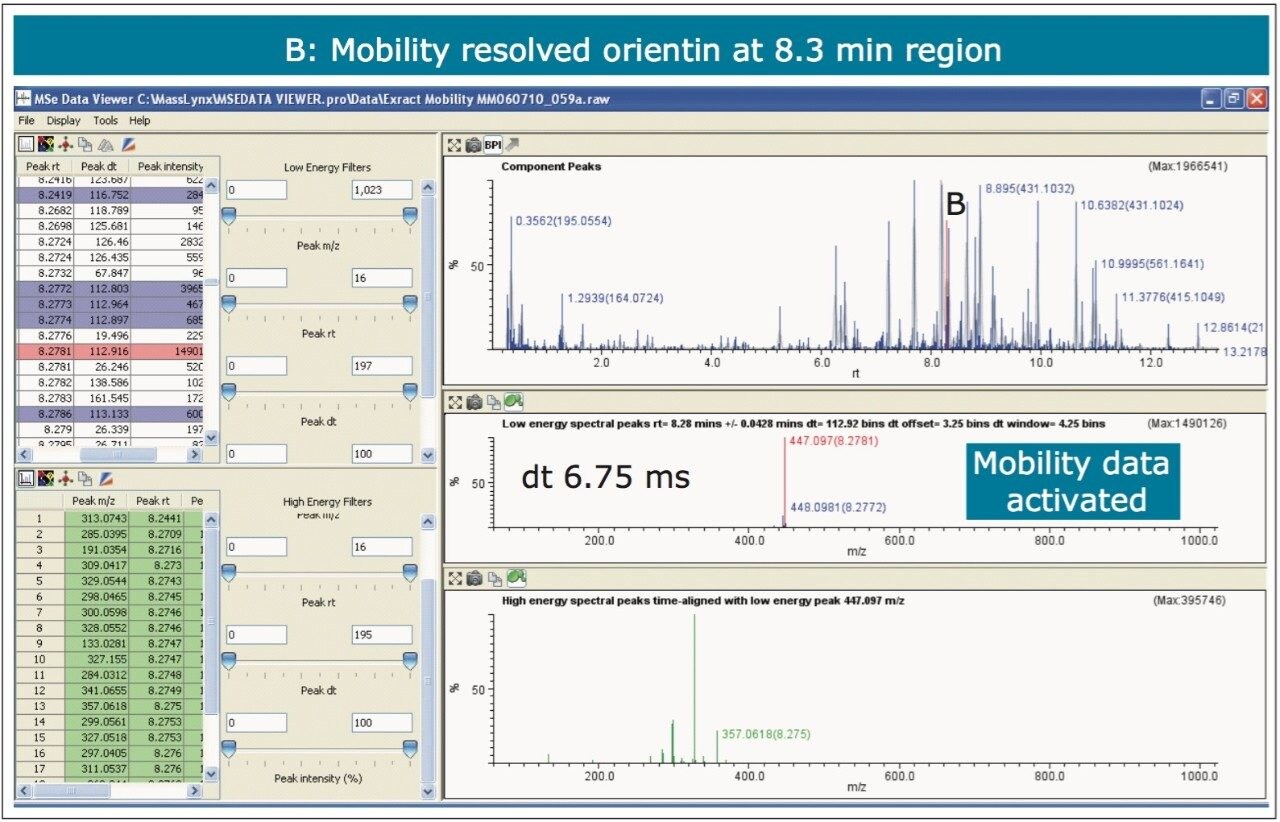
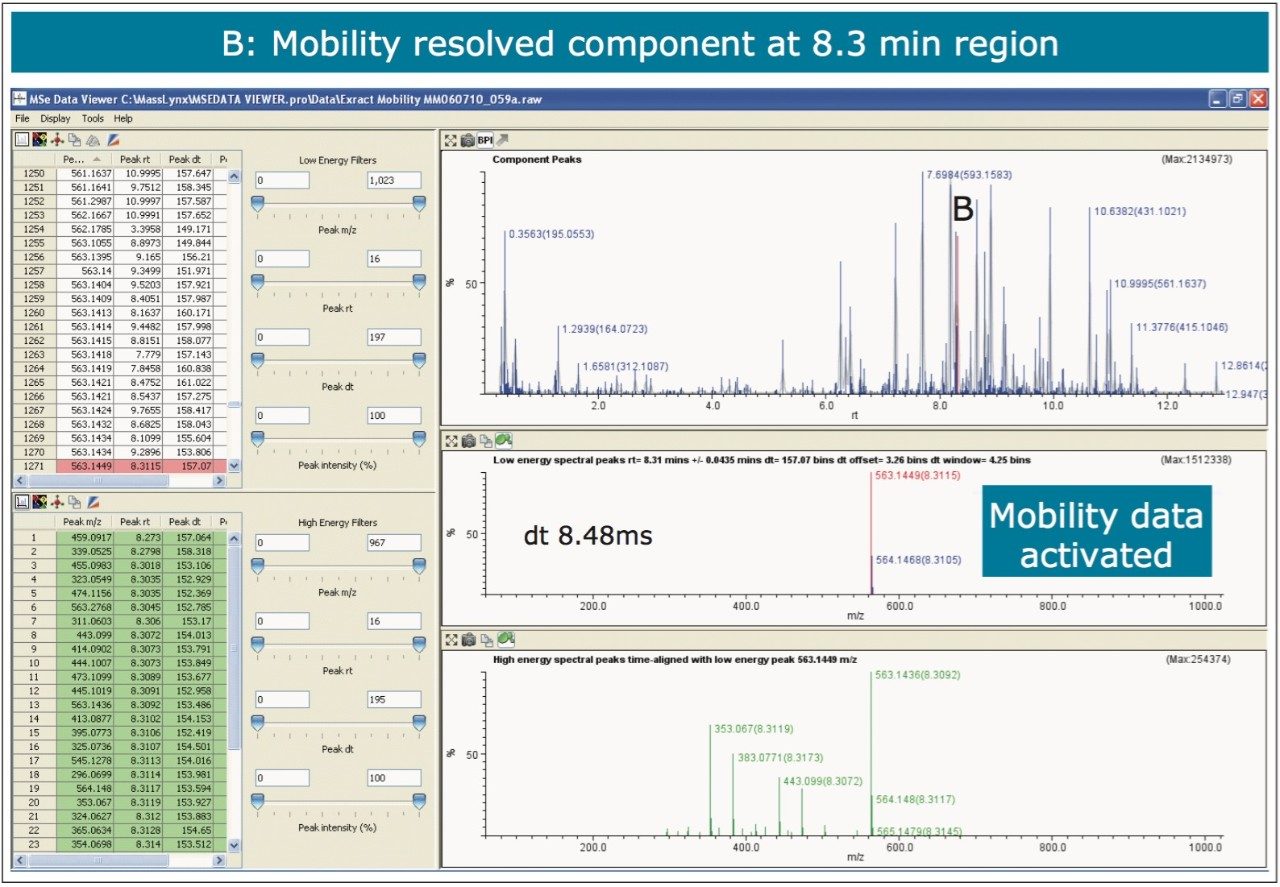
HDMS has been utilized to profile the hydroethanolic extracts of P. incarnata, P. alata, P. edulis, and P. caerulea, all grown in Brazil. This technique offers some unique advantages for profiling complex mixtures. It is a combination of high resolution mass spectrometry and high efficiency ion mobility based measurements and separations. Ion mobility mass spectrometry (IMS) is a rapid orthogonal gas separation phase technique which allows another dimension of separation to be obtained within an LC timeframe. Compounds can be differentiated based on size, shape, and charge.

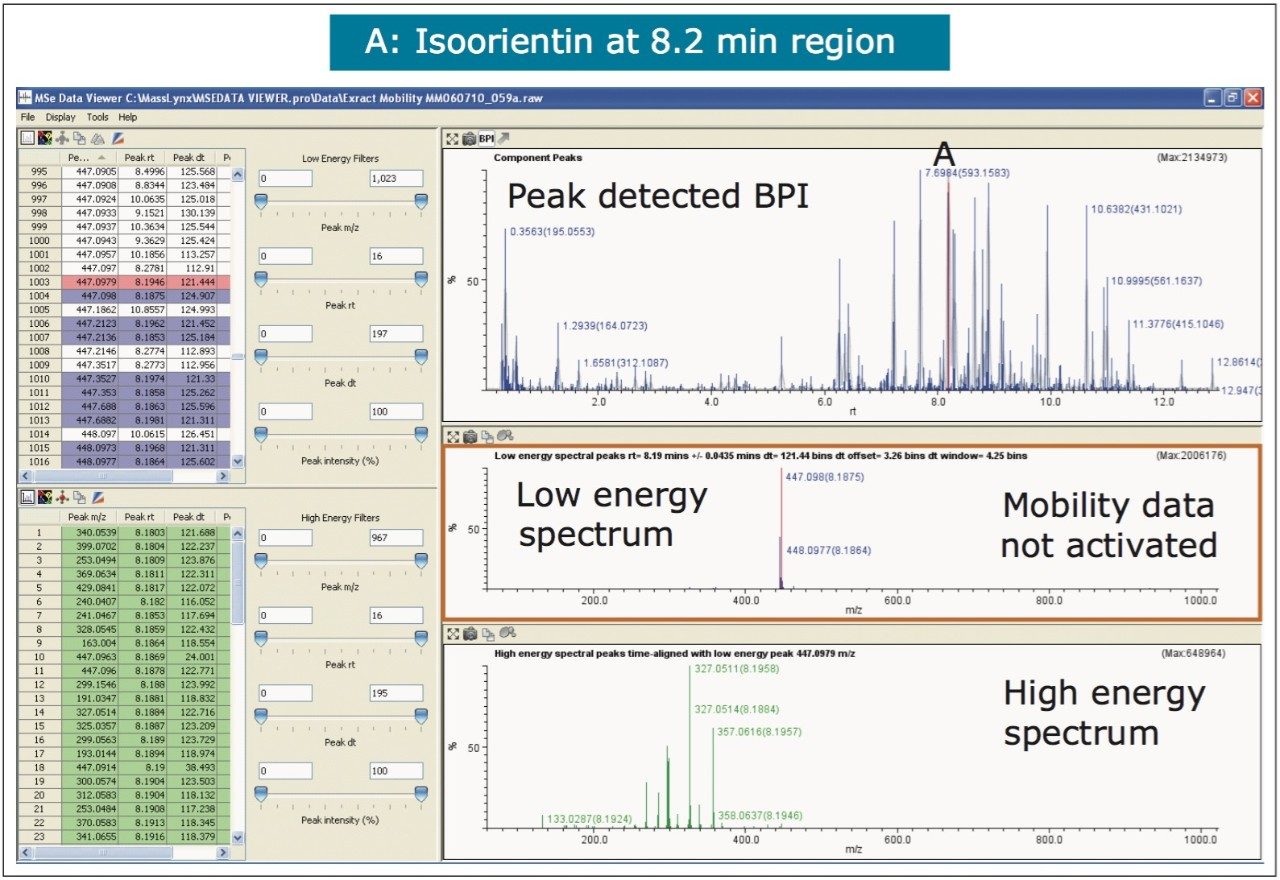
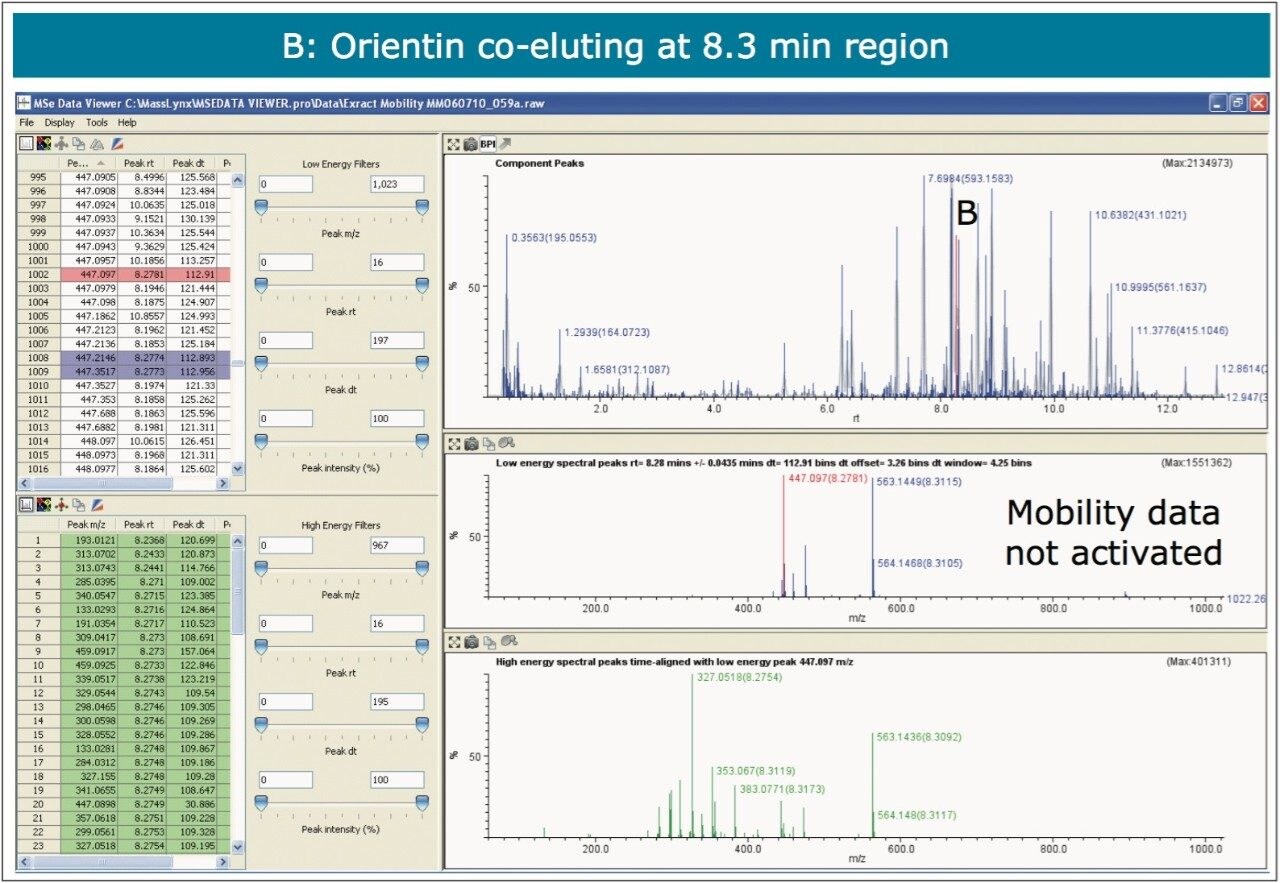
The application note investigates the use of UPLC-HDMSE using Waters SYNAPT G2-S, to determine if HDMS can provide a route to specific and unambiguous identification, and to facilitate the unequivocal distinction of flavonoid isomers in complex samples and matrices.

Experimental

UPLC conditions

UPLC system:

ACQUITY UPLC

Column:

ACQUITY UPLC BEH C18 100 mm x 2.1 mm, 1.7 μm

Column temp.:

45 °C

Flow rate:

0.75 mL/min

Mobile phase:

MeCN (B): H2O (0.1% HCOOH) (A)

Injection volume:

10 μL

Gradient

Time (min)

Flow rate

%A

%B

0.00

0.750

98.0

2.0

1.00

0.750

98.0

2.0

5.00

0.750

95.0

5.0

10.00

0.750

80.0

20.0

13.00

0.750

70.0

30.0

15.00

0.750

20.0

80.0

15.10

0.750

98.0

2.0

MS conditions

MS system:

SYNAPT G2-S

Ionization mode:

ESI - at 2.5 kV

Voltage:

30 V

Desolvation temp.:

650 °C

Reference mass:

Leucine enkephalin, [M-H]- = 554.2615

Acquisition:

50 to 1200 m/z

Acquisition rate:

5 spectra/s

Collision energy:

33 to 55 eV

Resolution:

18,000 FWHM

IMS T-Wave velocity:

600 m/s

IMS T-Wave Pulse height:

40 V

Results and Discussion

Using UPLC-IMS-MSE, four Passiflora species, P.incarnata, P.edulis and P.caerulea and P.alata were profiled using the SYNAPT G2-S From the results obtained, it can be seen that HDMS can provide a route to specific and unambiguous identification, enabling the unequivocal distinction of flavonoid isomers within complex samples. The limitations of previous studies have been overcome, where the isomers vitexin and isovitexin could not be chromatographically resolved.2 In Figure 1 the enhanced peak capacity obtained with mobility separation for MSE profiling of Passiflora edulis is presented, where separation with drift time and retention time can be observed. It is possible to see that chromatographically co-eluting components are orthogonally resolved further.

Figure 1. 3D illustration of enhanced peak capacity obtained for the mobility MSE profiling of Passiflora edulis extract. The 3D display shows the components separated by retention time and drift time.

This profiling study illustrates the advantages UPLC, time-of-flight (TOF), and ion mobility technology. Even with the peak capacity of UPLC in such complex samples co-elution can occur for major and minor components. In the samples analyzed many isomers/conformers may exist. Until this study was undertaken, vitexin and isovitexin had not been separated chromatographically. Even though the challenge of separating all four glycocides has been achieved, in the extracts provided they co-elute with other structurally related components. In previous studies the characteristic fragmentation spectra of 6-C and 8-C glycoside had been determined, but it was not always possible to generate the individual fragmentation spectra of each target component due to sample complexity. Isoorientin, orientin, vitexin, and isovitexin are the target marker flavonoids of interest shown in Figure 2. These have been used to characterize the respective Passiflora species analysed. HDMS Technology has enabled the true complexity of each species to be seen.

Figure 2. Structures of 6C and 8C glycocides.

The nature of the sample complexity being dealt with is demonstrated in Figure 3, where, in the case of Passiflora edulis, 1,557 minor and major components were determined to be present. Using the MSE Data Viewer the components peaks are detected automatically and the mobility separation obtained is accessed seamlessly, allowing the resolution of ion mobility to resolve co-eluting chromatographic components. The conventional peak detected BPI chromatogram can be seen within the MSE data viewer software in Figure 3, where isoorientin at 8.18 mins and MSE spectra are selected, for profiling of Passiflora edulis extract is shown. It can be seen in Figure 4 that at 8.27 mins more than one component has been peak detected and that the high and low MSE spectra are comprised of the two co-eluting components.

Figure 3. MSE data viewer showing the peak detected BPI, isoorientin at 8.18 mins and MSE spectra selected, for profiling of Passiflora edulis extract.
Figure 4. MSE data viewer showing the peak detected BPI, orientin at 8.27 mins and associated co-eluting analyte with MSE spectra selected, for profiling of Passiflora edulis extract.

In Figures 5 and 6 the MSE spectra for orientin and the co-eluting component are mobility resolved. The mobility resolved MSE fragmentation spectra for 6-C and 8-C glycosides, shown in Figure 7, and the corresponding proposed fragmentation pathways for 6-C and 8-C glycosides presented are shown in Figure 8. The results clearly show the benefits of using IMS and that it is possible to separate co-eluting analytes, giving increased peak capacity. This enables single component accurate mass spectra of chromatographic co-eluting components to be obtained. Enhanced peak capacity has enabled more information to be extracted from fragmentation studies. The individual MSE fragmentation spectra have been obtained for flavonoid isomers which are co-eluting, from which structural elucidation has been performed. Characteristic assignment for 6-C and 8-C flavonoid glycosides isomers (vitexin and isovitexin), (orientin and isoorientin) has been made possible using drift time, accurate mass measurement, and elemental composition calculation for precursor and fragment ions produced.

Figure 5. MSE data viewer showing peak the detected BPI and mobility resolved orientin at 8.27 mins with MSE spectra for profiling of Passiflora edulis extract.
Figure 6. MSE data viewer showing the peak detected BPI and mobility resolved co-eluting analyte only, with MSE spectra for profiling of Passiflora edulis extract.
Figure 7. Mobility resolved distinctive MSE fragmentation spectra for 6-C and 8-C glycosides.
Figure 8. Fragmentation routes for 6-C and 8-C glycosides.

Conclusion

  • The use of UPLC-IMS- MSE has overcome the limitations of previous studies.
  • Four Passiflora species, P.incarnata, P.edulis and P.caerulea and P.alata were profiled using SYNAPT G2-S.
  • HDMS can provide a route to specific and unambiguous identification, enabling the unequivocal distinction of flavonoid isomers within complex samples.
  • Individual MSE fragmentation spectra have been obtained for the flavonoid isomers which are chromatographically co-eluting with other components – this has not been achieved in previous studies.
  • For fragmentation studies more specific information can be obtained for numerous components simultaneously.
  • 6-C and 8-C glycoside positional isomers have been separated with ion mobility.
  • Complex sample analysis benefits from the increased peak capacity produced by ion mobility.
  • MSE Data Viewer allows processing and the seamless visualization of ion mobility data.

References

  1. R Colombo, J H Yariwake, M McCullagh. Study of C- and O-glycosylatedflavones in Sugarcane Extracts using Liquid Chromatography Exact Mass Measurement Mass Spectrometry. J.Braz.Chem.Soc. 19:3, 483-490, 2008.
  2. C A M Pereira, J H Yariwake, M McCullagh. Distinction of the C-glycosylated flavone isomers pairs orientin/isoorientin and vitexin/isovitexin using HPLC-MS Exact Mass Measurement and in-source CID. Phytochem Anal. 16, 295-301, 2005.

720004336, October 2012

トップに戻る トップに戻る