• アプリケーションノート

Improved Ion Mobility Separation of Protein Conformations in the Gas Phase with SYNAPT G2 HDMS

Improved Ion Mobility Separation of Protein Conformations in the Gas Phase with SYNAPT G2 HDMS

  • StJohn Skilton
  • Iain Campuzano
  • Kevin Giles
  • Hilary J. Major
  • Weibin Chen
  • Waters Corporation

Abstract

This application note illustrates that the SYNAPT G2 HDMS System, which provides an orthogonal separation technique with ion mobility mass spectrometry, can clearly separate different conformations of equine cytochrome c within minutes, matching that of published work.

Benefits

SYNAPT G2 HDMS achieved equivalent separation on a more compact platform than a previous research instrument and the data was obtained easily and with no special conditions needed.

Introduction

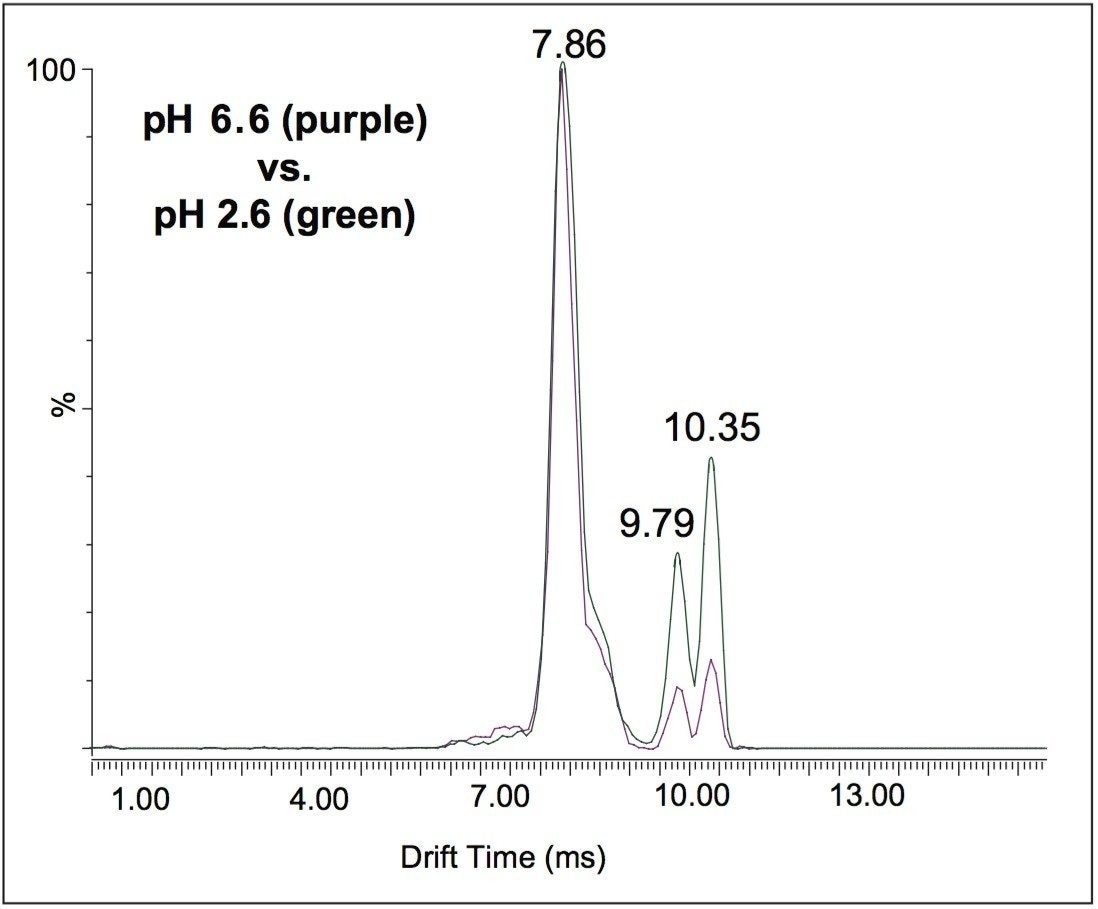
Biomolecules introduced to a mass spectrometer by electrospray ionization (ESI) exhibit a number of different conformations depending on charge states, eluent pH, and size. Understanding the higher order structure of biomolecules is important for the biopharmaceutical industry because different conformations may affect biological activity.

Methods for determining changes in higher order structure are valuable to stability studies and purification development, especially those that can be implemented in a high throughput manner. It is often time-consuming to separate or identify different conformations. Recent work on hydrogen-deuterium (HD) exchange shows how ion mobility separation (IMS) can be used to differentiate conformations of heterogeneous biomolecules such as IgG.1

It is known that specific conformations are preferentially susceptible to biological activity.1,2 The ability to reliably distinguish different forms is vital for organizations that need to discover which conformations of a biomolecule are important. Reducing the need for time-consuming workup for crystallography or NMR work can save an organization valuable time and resources.

Different conformations of isobaric biomolecules cannot be separated by mass spectrometric resolution alone. With the inclusion of IMS in Waters SYNAPT HDMS instruments, an orthogonal separation technique is added to the capability of the mass spectrometer.

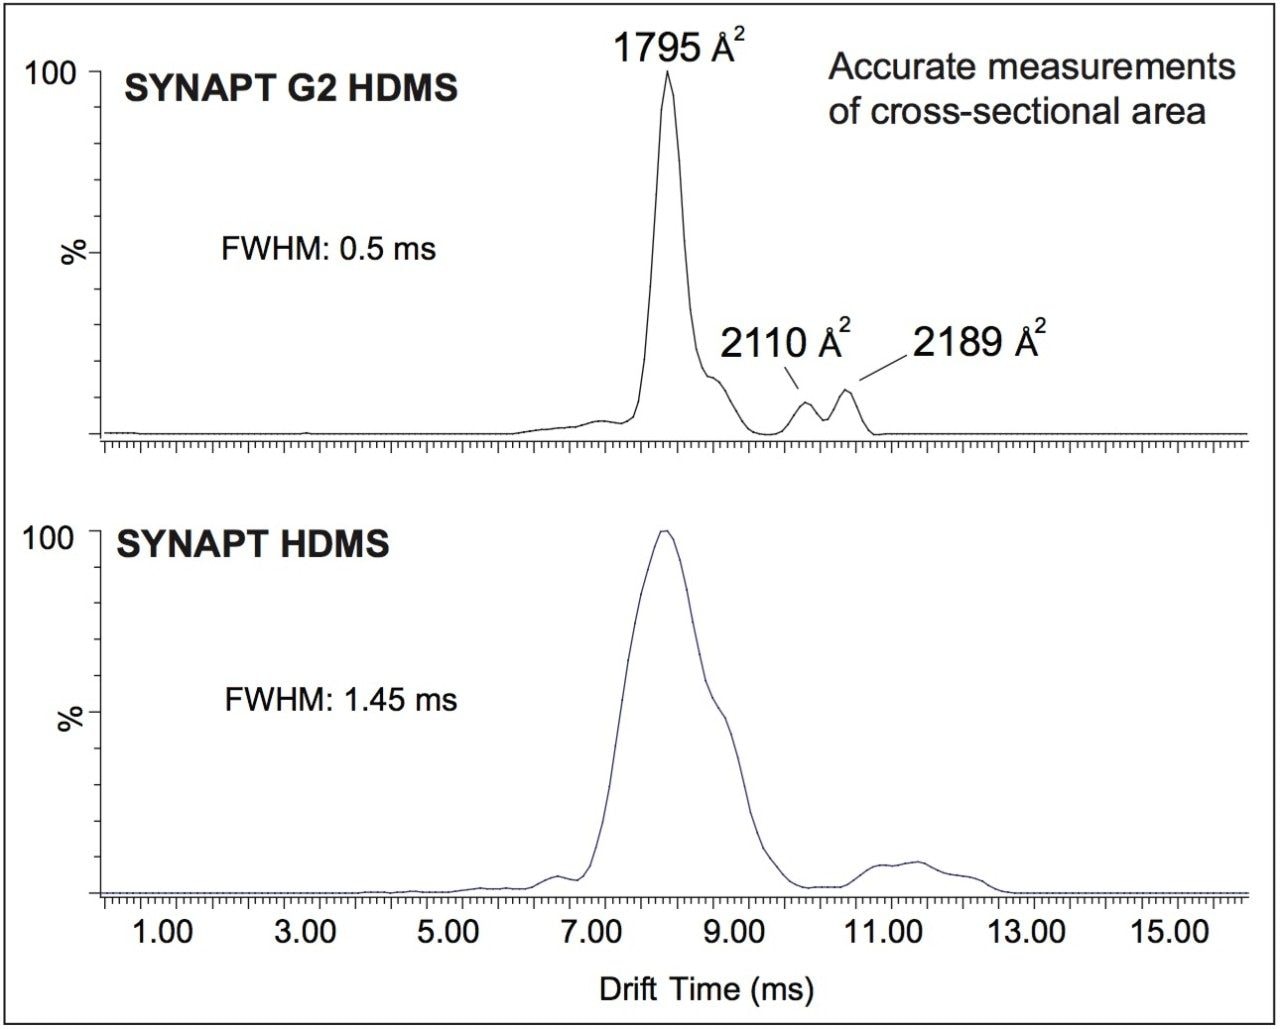
IMS is well-established for analysis of small and large molecules.3-6 In its most recent commercial implementation, the SYNAPT G2 HDMS improves IMS resolution by a factor of three to four. Conformations that were not distinguishable in the first-generation instrumentation become apparent using SYNAPT G2 HDMS. This work describes how different conformations of equine cytochrome c can be clearly separated within minutes.

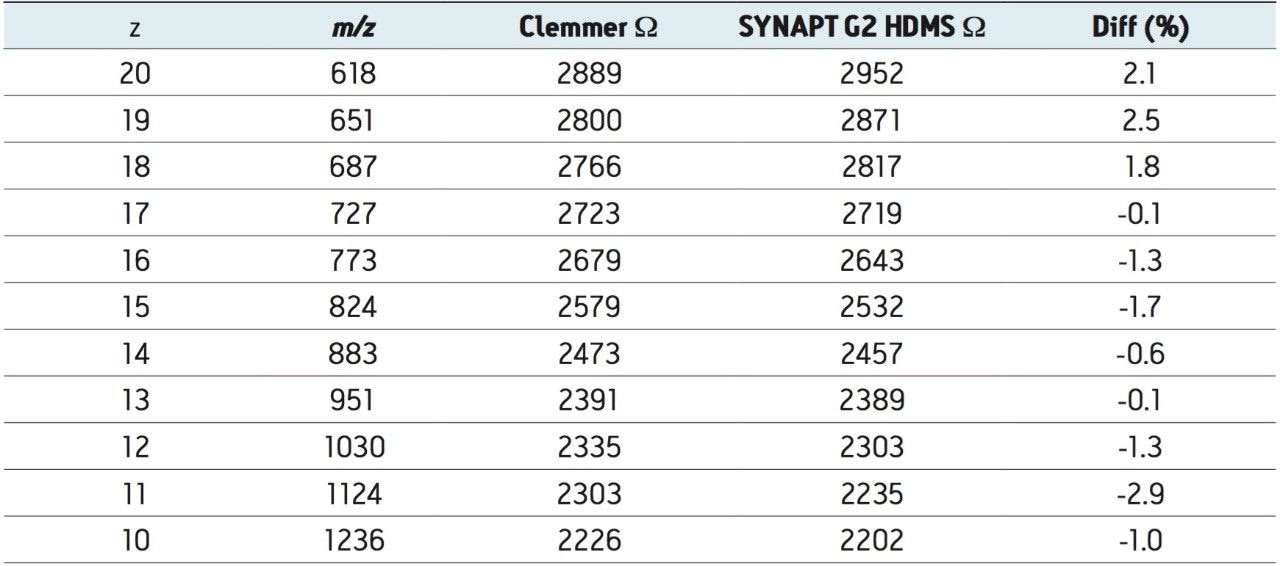
Cytochrome c was chosen as a model compound because multiple conformations have been observed in the published work using a standard drift-tube ion-mobility instrument.6, 7 Here, we demonstrate that SYNAPT G2 HDMS achieves equivalent separation on a more compact platform than a previous research instrument.

Experimental

MS conditions

MS system:

Waters SYNAPT G2 HDMS

Ionization mode:

ESI positive

Nanoflow capillary voltage:

1.0 kV

Cone voltage:

40 V

Extraction cone:

2 V

Trap collision energy (CE):

6 V

Transfer CE:

4 V

Trap/Transfer gas:

2.0 x 10⁻² mbar (Argon)

IMS gas:

N2

IMS gas pressure:

2.7 mbar

Method

Cytochrome c (Bovine heart) was purchased from Sigma. The protein was prepared at a concentration of 2 pmol/μL either in 2.5 mM ammonium acetate (pH 6.6 or 2.6) or in 50:50 MeOH/ammonium acetate (5.0 mM pH 6.6) for mass spectrometric analysis. Samples were introduced to MS directly by infusion using a syringe pump (Harvard Apparatus, Holliston, MA, U.S.) at a flow rate of 10 μL/min. Myoglobin solution (sperm whale, 2 pmol/μL in 50% MeOH/H2O, 0.1% FA) was used for TriWave IMS calibration for cross-section measurement.

Results and Discussion

Ion Mobility Separation (IMS) is a technique that allows the separation of ions in a neutral buffer gas based on their collision cross-section W. IMS in the SYNAPT G2 HDMS is implemented by use of a travelling wave ion guide.3, 8 The technique is therefore orthogonal to liquid chromatography and to mass analysis, providing additional information.

The instrument is a hybrid tandem quadrupole IMS-TOF; ions with different charge states can be readily isolated at the first stage by the quadrupole. By selecting a single charge state of biomolecule ions, ions with different conformations can be separated.

The samples were analyzed on both SYNAPT HDMS and SYNAPT G2 HDMS to ensure comparability between instruments. Figure 1 illustrates that exactly the same charge-state envelope is apparent on each of the instruments, showing the same characteristics and in the same ratios. In the SYNAPT G2 HDMS data, the time-of- flight (TOF) resolution has increased to 40,000 resolution (FWHM), providing monoisotopic resolution of the 9+ charge state.

Figure 1. Comparisons of the most abundant charge states of cytochrome c in ESI mode on SYNAPT HDMS (bottom) and SYANPT G2 HDMS (top). Inset is a zoom of the increased resolution of the 9+ charge state at 40,000 resolution FWHM.

The 8+ charge state ions were selected and transferred to the ion mobility cell, where ions with different conformation were separated. In Figure 2, a comparison is shown between the equivalent data on a SYNAPT HDMS and a SYNAPT G2 HDMS. The same separation time window was compared overall and the extracted mobilograms are comparable. Although the data from the first-generation instrument implies that existence of multiple protein conformers for this charge state, certain conformations (e.g., peaks at 11.0 ms) were not completely separated. In the SYNAPT G2 HDMS, at least three different conformers are clearly resolved with a fourth conformation appearing at the base of the major peak at 7.86 milliseconds of drift time.

Figure 2. Comparative extracted ion mobilograms of the 8+ charge state of cytochrome c in ESI mode on SYNAPT HDMS (bottom) and SYNAPT G2 HDMS (top). The drift time at the half height of the major peak indicates that the mobility resolution has increased by a factor of three on SYNAPT G2 HDMS. The collision cross sections for each resolved peaks are shown on the apex of the G2 peaks.

To probe the different conformations of cytochrome c in aqueous solution, the pH level was adjusted to two different values: pH 2.6 and pH 6.6, reflecting denaturing and native solution conditions. At pH 2.6, the protein is denatured and is therefore expected to produce more open conformations because of the repulsive charge effects. The reverse is expected at pH 6.6 and therefore the conformations are expected to be more compact.

Figure 3 shows the extracted ion mobilograms of charge state 8+ from both pH solution conditions are superimposed on each other. The traces are normalized to the most intense peak at 7.86 ms. In the more acidic state at pH 2.6 the peak heights at a drift time of 9.79 ms and 10.35 ms are proportionally higher relative to the main peak when compared to the trace at pH 6.6. Therefore, as expected, changes in pH change the proportions of conformations.

Figure 3. Comparative extracted ion mobilograms of cytochrome c at different pH values on SYNAPT G2 HDMS.

The result is consistent with ion mobility separation: the more mobile peak at 7.86 ms is the most compact form and therefore migrates earlier because it effectively has less resistance to being moved along the wave guide. In physical terms, the more compact conformation is being subjected to fewer rollover effects than more extended/unfolded conformations.3 The other two peaks are more extended forms (9.79 ms, 10.35 ms) and migrate more slowly (less mobile) in the Travelling Wave Ion Guide (TWIG). There is a greater proportion of the more extended forms at pH 2.6, consistent with the expected effect of acidic solutions producing more denatured forms. Ion mobility is able to make this difference apparent where mass analysis alone would be blind to this effect.

The data indicates that there are at least three forms easily separable according to shape (only). The spectra of all of these forms are the same because they are all isobaric.

Measurement of cross-sectional areas

The increased mobility resolution allows easier measurement of collision cross-sectional area W. Collision cross-section measurements of proteins on the first generation instruments have been shown to match well with mobility separation.9 Additionally, the latest implementation of software that provides visualization of ion mobility separations, DriftScope 2.1, allows for an automatic T-Wave ion mobility calibration to be performed. This enables the W determination of an unknown. In this case, T-Wave ion mobility calibration was performed using the known W values of sperm whale myoglobin. The calibration was validated with equine cytochrome c (Table 1).

Table 1. A comparison of SYNAPT G2 HDMS derived and drift cell W values.7

The T-Wave derived W values match well with published cytochrome c data8 and confirm that the commercially-available instrument provides exactly the same information in a short time frame: The sample introduction was by simple infusion in ESI positive mode with no special instrument conditions. Further increases in the TOF resolution of the instrument mean that even high charge states can be isotopically resolved.

Conclusion

  • The data produced by the SYNAPT G2 HDMS significantly improves what was possible on previous instruments.
  • Bovine cytochrome c conformations and W values were found to match that of previous, published work.
  • The data was obtained easily and with no special conditions needed – these experiments can be performed by non-experts.
  • The implementation of ion mobility on SYNAPT G2 HDMS integrates an orthogonal dimension with a commercially-available, high-resolution, tandem MS instrument.
  • This improvement reduces the risk of missing important tertiary structure information for any organization that needs to characterize biomolecules.

References

  1. Ion mobility adds an additional dimension to mass spectrometric analysis of solution-phase hydrogen/deuterium exchange. Iacob RE, Murphy JP, Engen JR. Rapid Commun. Mass Spectrom. 2008; 22: 2898-2904.
  2. Characterization of IgG1 Conformation and Conformational Dynamics by Hydrogen/Deuterium Exchange Mass Spectrometry. Houde D, Arndt J, Domeier W, Berkowitz S, Engen JR. Anal. Chem. 2009, 81, 2644-2651.
  3. An investigation of the mobility separation of some peptide and protein ions using a new hybrid quadrupole/travelling wave IMS/oa-ToF instrument. Pringle SD, Giles K, Wildgoose JL, Williams JP, Slade SE, Thalassinos K, Bateman RH, Bowers MT, Scriven JH. International Journal of Mass Spectrometry 2007, 261, 1-12.
  4. Evidence for Macromolecular Protein Rings in the Absence of Bulk Water. Ruotolo BT, Giles K, Campuzano I, Sandercock AM, Bateman RH, Robinson CV. Science, 2005, 310, 1658-1660.
  5. Ion mobility mass spectrometry of proteins in a modified commercial mass spectrometer. Thalassinos K, Slade SE, Jennings KR, Scrivens JH, Giles K, Wildgoose JL, Hoyes J, Bateman RH, Bowers MT. International Journal of Mass Spectrometry 2004, 236, 55-63.
  6. Mass spectrometry of macromolecular assemblies: preservation and dissociation. Benesch JLP, Robinson CV. Curr Opin Struct Biol. 2006, 16, 245-51.
  7. Protein Structure in Vacuo: The Gas Phase Conformations of BPTI and Cytochrome c. Shelimov KB, Clemmer DE, Hudgins RR, Jarrold MF. J. Am. Chem. Soc. 1997, 119, 2240-2248. See also http://www.indiana.edu/~clemmer/Research/cross%20 section%20database/Proteins/protein_cs.htm
  8. Special feature perspective: Ion mobility-mass spectrometry. Kanu AB, Dwivedi P, Tam M, Matz L, Hill HH. J. Mass Spectrom. 2008, 43, 1-22.
  9. Ion Mobility-Mass Spectrometry Reveals Long-Lived, Unfolded Intermediates in the Dissociation of Protein Complexes. Ruotolo BT, Hyung SJ, Robinson PM, Giles K, Bateman RH, Robinson CV. DOI: 10.1002/anie.200702161.

720003411, July 2010

トップに戻る トップに戻る