• アプリケーションノート

Determination of Priority Pesticide Residues in Baby Food by Tandem Quadrupole LC-MS/MS and GC-MS/MS

Determination of Priority Pesticide Residues in Baby Food by Tandem Quadrupole LC-MS/MS and GC-MS/MS

  • Peter Hancock
  • Cristiana C. Leandro
  • Brendan J. Keely
  • Richard J. Fussell
  • Waters Corporation
  • University of York
  • Central Science Laboratory, York
Baby food in bowls with spoons

Abstract

The aim was to develop a simple and rapid method suitable for the quantification and confirmation of a total of 25 priority pesticide residues and transformation products in baby foods at a level of 0.001 mg/kg using LC-MS/MS and GC-MS/MS.

Introduction

The European Union Baby Food Directive 2003/13/EC1 designates pesticides as prohibited, in which case they are considered not to have been used if their residue does not exceed 0.003 mg/kg or have maximum residue limits (MRLs) set between 0.004–0.008 mg/kg. Seven pesticides and nine transformation products (e.g. metabolites) listed in the Directive are suitable for LC-MS analysis while nine pesticides and three transformation products are amenable to GC-MS. The other pesticides specified in the Directive, because of their physicochemical properties, must be analyzed by single residue methods. Dimethoate was only included in the compound list as a possible precursor for omethoate. 

To be able to enforce the Directive, laboratories require multiresidue methods with lower limits of detection (LOD) than those currently available. This necessitates improvements in the extraction, clean up, separation, and detection of pesticides in baby food samples. An extraction, with acetonitrile, followed by dispersive SPE clean up was reported for the analysis of a wide range of pesticides in fruits and vegetables2 and fatty samples.3 Acetonitrile extracts are suitable for direct analysis using LC-MS/MS, and by GC-MS/MS using programable temperature vaporization (PTV) in solvent vent mode. 

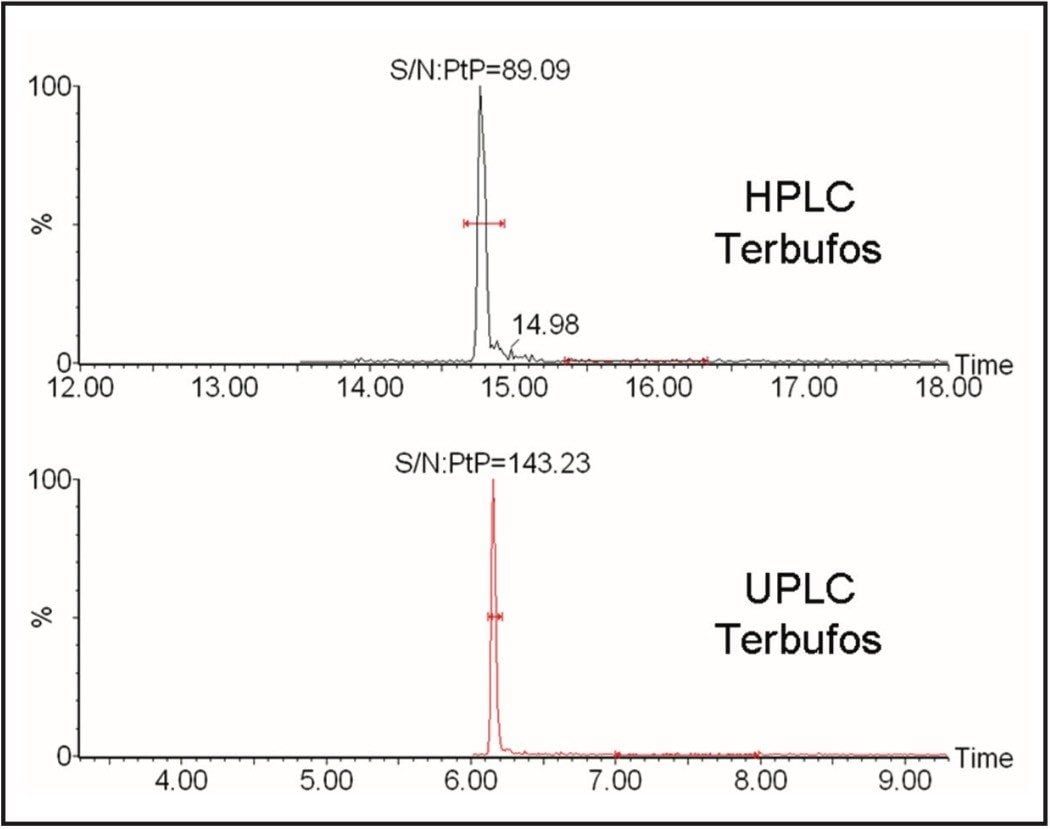
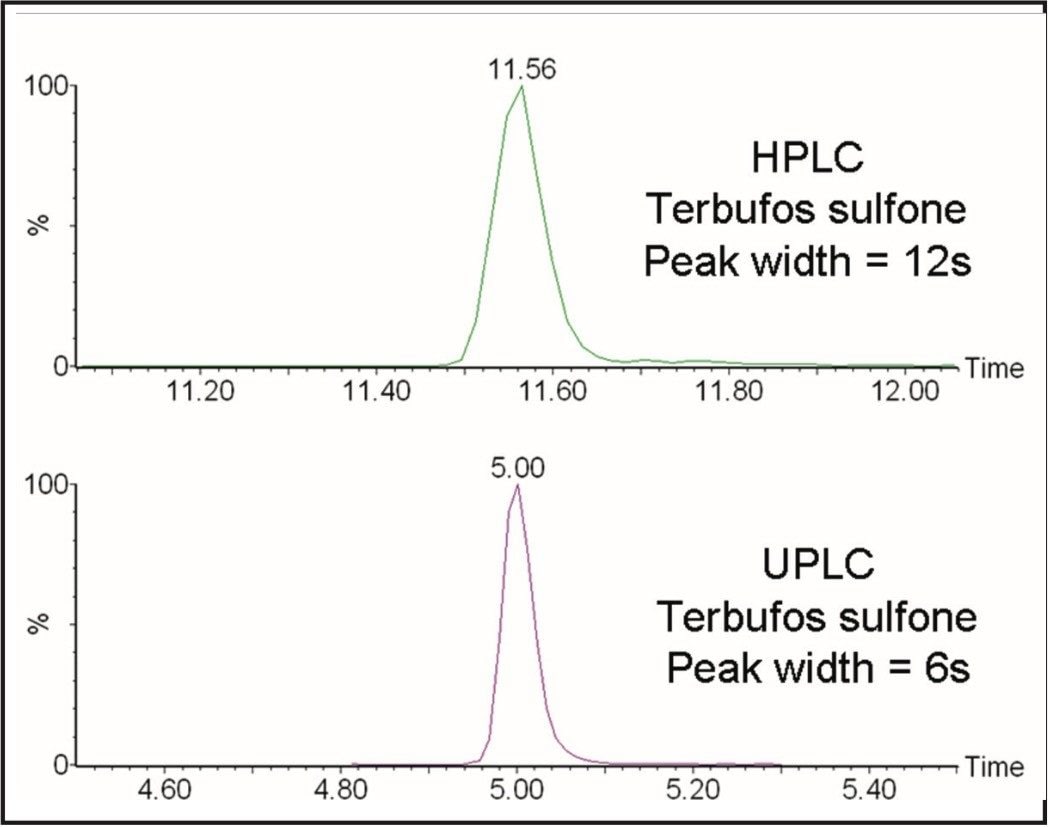
GC and HPLC have both been widely used in laboratories for the analysis of pesticide residues in food. The Waters ACQUITY UltraPerformance LC (UPLC)4 has the potential to provide shorter run times, greater sensitivity and better chromatographic resolution than established HPLC methods. 

Experimental

Extraction Method

10 g of baby food was weighed in a centrifuge tube. For recovery, the samples were spiked at 0.001 mg/kg. Acetonitrile (10 mL), anhydrous MgSO4 (4 g) and NaCl (1 g) were added and the tube was shaken and vortexed immediately. For the GC-MS/MS experiments, 100 μL of 1 μg/mL δ-HCH was added as an internal standard. After centrifugation at 4300 g for 5 minutes, an aliquot (1 mL) of the supernatant was transferred to a microcentrifuge vial containing 50 mg primary secondary amine (PSA) sorbent and 150 mg anhydrous MgSO4. For the GC-MS/MS experiments, 200 mg C18 was also added to the microcentrifuge vial. The contents were vortex mixed for 30 s and centrifuged at 5000 g for 1 minute. The supernatant was analyzed by LC-MS/MS after dilution with water (1:10) or directly by GC-MS/MS. 

HPLC Conditions

System:

Waters Alliance 2795 Separations Module

Column:

SunFire C18, 2.1 x 100 mm, 3.5 μm

Column temp.:

40 °C

Flow rate:

0.3 mL/min

Mobile phase A:

H2O:MeOH (9:1) + 20 mM CH3CO2NH4

Mobile phase B:

H2O:MeOH (1:9) + 20 mM CH3CO2NH4

Injection volume

50 μL

Gradient

Time: 0 min

100% A

Time: 13 min

100% B

Time: 17 min

100% B

UPLC Conditions

System:

Waters ACQUITY UltraPerformance LC System

Column:

UPLC BEH C18, 2.1 x 100 mm, 1.7 μm

Column temp.:

40 °C

Flow rate:

0.3 mL/min

Mobile phase A:

H2O:MeOH (9:1) + 20 mM CH3CO2NH4

Mobile phase B:

H2O:MeOH (1:9) + 20 mM CH3CO2NH5

Injection volume:

50 μL

Gradient

Time: 0 min

100% A

Time: 5 min

100% B

Time: 7 min

100% B

GC Conditions

System:

Agilent 6890 GC with 7683 autosampler

Column:

Varian FactorFour VF-5ms 30 m x 0.25 mm i.d., 0.25 μm

Constant flow:

1.0 mL/min helium

Injection method:

Cyro cooled PTV in solvent vent mode, 5 μL injected

Vent method:

Vent pressure 5 kPa, Vent flow 20 mL/min for 0.5 min

Temp. ramp:

Time: 0 min

50 °C

Time: 1.5 min

50 °C

Time: 9 min

200 °C

Time: 11 min

200 °C

Time: 15 min

280 °C

LC-MS/MS Method

The Waters Micromass Quattro Premier XE Tandem Quadrupole Mass Spectrometer was used in positive ion electrospray mode. The ion source was operated at 120 °C with a capillary voltage of 3.5 kV. The mode of acquisition was multiple reaction monitoring (MRM) at an argon collision gas pressure of 3.0 x 10⁻³ mBar. 

The Quattro Premier XE was tuned so that the precursor and product ions were resolved with a peak width at half height of less than 0.7 Da. The list of pesticide residues and the MRM transitions, along with the cone voltages and collision energies for the method are listed in Table 1. 

LC-MS/MS MRM method parameters
Table 1. LC-MS/MS MRM method parameters. 

GC-MS/MS Method

The Waters Micromass Quattro microTM GC Tandem Quadrupole Mass Spectrometer was used in electron impact (EI+) mode. The ion source was operated at 180 °C with an electron energy of 70 eV and a trap current of 200 μA. The mode of acquisition was multiple reaction monitoring (MRM) at an argon collision gas pressure of 3.0 x 10⁻³ mBar. 

The Quattro micro GC was tuned so that the precursor and product ions were resolved with a peak width at half height of less than 0.7 Da. The list of pesticide residues and the MRM transitions, along with the collision energies for the method are listed in Table 2. 

GC/MS/MS MRM method parameters
Table 2. GC-MS/MS MRM method parameters. 

Acquisition and Processing Methods

The data were acquired using Waters MassLynx Software and processed using the Waters TargetLynx Application Manager. Two MRM transitions were acquired for each residue so that quantification and confirmation could be performed with a single injection assuming that the ion ratio between the two transitions was consistent for standards and samples. The confirmation criteria chosen were dependent on the relative abundance of the two transitions in accordance with EU legislation 2002/657/EC5 usually applied to veterinary drug residues analysis. 

Results and Discussion

HPLC-MS/MS

To test the extraction method described, seven recovery experiments were performed in fruit-based, potato-based, and cereal-based baby foods, spiked at 0.001 mg/kg. The mean recovery and relative standard deviation (% RSD) in parenthesis of each analyte are listed in Table 3. 

Excellent recoveries in the range 85–113% with % RSDs of less than 17% were obtained by HPLC-MS/MS for all the pesticides spiked at the 0.001 mg/kg levels in three different baby foods. 

Calibration curves were linear over the range 0.0005–0.0100 μg/mL with correlation coefficients greater than 0.99 for all analytes using HPLC-MS/MS. 

With HPLC-MS/MS all pesticides except disulfoton and terbufos could be confirmed at the 0.001 mg/kg level with a signal-to-noise (S/N) ratio of at least 3:1. The confirmation of the identity of pesticides was based on the ion ratio statistics for the transitions monitored5. Table 4 shows the ion ratio statistics for 21 recovery experiments across the three matrices. 

Ion ratios using HPLC-MS/MS for 0.001 mg/kg recovery samples in three different matrices
Table 4. Ion ratios using HPLC-MS/MS for 0.001 mg/kg recovery samples in three different matrices (n = 21). 

With the exception of disulfoton and terbufos, the % RSDs indicate good repeatability within the tolerances specified in the EU legislation. For these two compounds, the response for the second transition is not adequate for the confirmation at the MRL level. 

Since they are both late eluting compounds, the confirmation could be achieved by injecting crude extracts (e.g. 20 μL of the total extract prior to dilution) to load more analyte into the column, without compromising the peak shape.

UPLC-MS/MS

To test the extraction method described, seven recovery experiments were performed in fruit-based, potato-based and cereal-based baby foods, spiked at mg/kg. The mean recovery and relative standard deviation (% RSD) in parenthesis of each analyte are listed in Table 5. 

Mean recovery and % RSD using UPLC-MS/MS for 0.001 mg/kg recovery samples (n = 7)
Table 5. Mean recovery and % RSD using UPLC-MS/MS for 0.001 mg/kg recovery samples (n = 7). 

Excellent recoveries in the range 92–119% with %RSDs of less than 11% were obtained by UPLC-MS/MS for all the pesticides spiked at the 0.001 mg/kg levels in three different baby foods. Although the mean recoveries obtained by HPLC and UPLC are very similar, the precision obtained with UPLC is significantly improved, especially for disulfoton and terbufos. 

Calibration curves were linear over the range 0.0005–0.0100 μg/mL with correlation coefficients greater than 0.99 for all analytes using UPLC-MS/MS.

With UPLC-MS/MS all pesticides could be confirmed at the 0.001 mg/kg level with a signal-to-noise (S/N) ratio of at least 3:1. Table 6 shows the ion ratio statistics for 21 recovery experiments across the three matrices. 

Ion ratios using UPLC-MS/MS for 0.001 mg/kg recovery samples in three different matrice
Table 6. Ion ratios using UPLC-MS/MS for 0.001 mg/kg recovery samples in three different matrices (n = 21). 

The % RSDs indicate good repeatability within the tolerances specified in the EU legislation. Notably, the analysis by UPLC-MS/MS overcame the problem of confirming disulfoton and terbufos owing to the improved response. 

The peak width of peaks from UPLC is less than those from HPLC, which typically results in increased S/N. See Figure 1. Consequently, UPLC allows confirmation of all the pesticides according to the maximum permitted tolerances for ion ratios. 

Comparison of S/N obtained for terbufos from HPLC and UPLC
Figure 1. Comparison of S/N obtained for terbufos from HPLC and UPLC. 

Converting the method from HPLC to UPLC has other potential advantages, namely improved speed and resolution. The UPLC analysis is complete in less than 10 minutes against the 25 minutes analysis by HPLC. See Figure 2. 

Comparison of run times between HPLC and UPLC
Figure 2. Comparison of run times between HPLC and UPLC for a cereal-based baby food. 

The high efficiency of the separation using a 1.7 μm particle size results in a reduction of the peak width, e.g. for terbufos sulfone the peak width is reduced. See Figure 3. 

Comparison of peak width for terbufos sulfone from HPLC and UPLC
Figure 3. Comparison of peak width for terbufos sulfone from HPLC and UPLC. 

Previously, the use of small diameter particle sizes has increased the potential for columns to block but this was proved not to be the case for this type of extract using the UPLC column technology. More than 300 injections of acetonitrile extracts from baby food, made up of 64 solvent injections and 244 matrix injections were analyzed in a single sequence without any significant change in column back pressure, retention time, peak shape, or peak area. 

The extraction and analytical methods were further tested for 10 different baby foods ranging from simple, low fat (fruit-based) to complex, high fat (meat-based). The mean recovery, % RSD and ion ratio statistics for each analyte with two determinations in the 10 different baby foods, spiked at 0.001 mg/kg, are listed in Table 7. 

Mean recovery, % RSD and ion ratios using UPLC-MS/MS for 0.001 mg/kg recovery samples in 10 different matrices (n = 20)
Table 7. Mean recovery, % RSD, and ion ratios using UPLC-MS/MS for 0.001 mg/kg recovery samples in 10 different matrices (n = 20). 

GC-MS/MS

To test the extraction method described, seven recovery experiments were performed in fruit-based and potato-based baby foods, spiked at 0.001 mg/kg. The mean recovery and relative standard deviation (% RSD) in parenthesis of each analyte are listed in Table 8. 

Good recoveries in the range 71–105% with % RSDs of less than 19% were obtained by GC-MS/MS for all the pesticides spiked at the 0.001 mg/kg levels in two different baby foods. 

Mean recovery and % RSD using GC-MS/MS for 0.001 mg/kg recovery samples
Table 8. Mean recovery and % RSD using GC-MS/MS for 0.001 mg/kg recovery samples (n = 7). 

Calibration curves were linear over the range 0.0005 - 0.0100 μg/mL with correlation coefficients greater than 0.99 for all analytes using GC-MS/MS. 

With GC-MS/MS, all pesticides could be confirmed at the 0.001 mg/kg level with a signal-to-noise (S/N) ratio of at least 3:1. Table 9 shows the ion ratio statistics for 14 recovery experiments across the two matrices. The % RSDs indicate good repeatability within the tolerances specified in the EU legislation. 

Ion ratios using GC-MS/MS for 0.001 mg/kg recovery samples
Table 9. Ion ratios using GC-MS/MS for 0.001 mg/kg recovery samples in two different matrices (n = 14). 

The robustness of the Quattro micro GC was investigated with this type of extract. Fifty-two injections of acetonitrile extracts from baby food were analyzed in a single sequence without any significant change in the response observed. Figure 5 demonstrates the peak area stability of the internal standard, δ-HCH. The % RSD across the batch was 5.0%. 

δ-HCH response maintained over 52 matrix injections
Figure 5. δ-HCH response maintained over 52 matrix injections. 

Conclusion

LC and GC methods have been described for the determination and confirmation of 25 priority pesticide residues and transformation products in different baby foods. 

The extraction method yielded very good recoveries and precision at the low concentration levels required by legislation in a range of complex food commodities. 

UPLC-MS/MS allows improved confirmation of disulfoton and terbufos in the baby foods tested, due to the enhancement of response and S/N. Another significant advantage with the use of UPLC is the speed of the chromatographic separation, with a 2.5 times increase in throughput compared to HPLC. 

The sensitivity offered by ACQUITY UPLC with Quattro Premier XE for the LC amenable compounds and Quattro micro GC for the GC amenable compounds allows the method to meet the challenges set by the EU Baby Food Directive 2003/13/EC.1 

References

  1. Commission Directive 2003/13/EC amending Directive 96/5/EC on processed cereal-based foods and baby foods for infants and young children, Off J of the European Communities No. L41/33. 
  2. M Anastassiades, S Lehotay, D Stajnbaher, F Schenck, J. AOAC Int. 86 (2) (2003) 412. 
  3. S J Lehotay, K Ma_tovska, S J Yun, J AOAC Int. 88 (2) (2005) 630. 
  4. M E Swartz, LC GC Europe, Separation Science, June (2005) 5. 
  5. Commission Directive 2002/657/EC implementing Council Directive 96/23/ EC concerning the performance of analytical methods and the interpretation of results, Off J of the European Communities No. L221/8. 

720001436, September 2007

トップに戻る トップに戻る