Analysis of Bovine Lactoferrin in Infant Formula and Pediatric/Adult Nutritional Formula – Demonstrating the Benefits of MaxPeak™ High Performance Surfaces (HPS) Technology
Jinchuan Yang, Paul D. Rainville, Stephanie Harden
Waters Corporation, United States
Published on May 26, 2025
Abstract
Bovine lactoferrin (bLF) is often fortified in infant formula, pediatric and adult nutritional products for its beneficial impacts on immune system development and gut health. AOAC Method 2021.10 provides a reliable and accurate solution for the determination of bLF in powdered infant formula and pediatric/adult nutritional formula using heparin affinity column extraction and reversed-phase high performance liquid chromatography (RP-HPLC) with ultraviolet detection. We implemented this AOAC method on an Arc™ Premier System coupled with a 2998 PDA Detector and an XBridge™ Protein BEH™ C4 Column, achieving excellent linearity, precision, and accuracy in the analysis of representative samples. We also evaluated the potential benefits of the MaxPeak High Performance Surfaces (HPS) Technology for this analysis by comparing the results with those from the XBridge Premier Protein BEH C4 Column. We found benefits such as more symmetric peak shapes and more consistent result (less column conditioning need) when using the XBridge Premier Protein BEH C4 Column.
Benefits
- The Waters Arc Premier System with a 2998 PDA Detector has been demonstrated to be an excellent liquid chromatography platform for the determination of bLF using AOAC Method 2021.10
- MaxPeak HPS Technology improves the chromatographic peak shape and reduces the need for extensive column conditioning when compared with traditional stainless-steel surfaces
Introduction
Lactoferrin (LF) is an iron-binding and iron-transporting glycoprotein that is present in human milk at an average concentration of about 1 mg/mL, making up approximately 7% of the total breast milk protein. Due to the iron-binding and iron-transporting capability of LF, it is important for a number of biological activities, including antimicrobial activity, prebiotic activity, antioxidant activity, and immunomodulatory activity.1 LF has a bi-lobed structure, each lobe has a deep cleft within which a ferric ion (Fe+3) binds reversibly with a carbonate ion (CO3-2). LF can exist in an apo-LF (iron-depleted) and a holo-LF (iron-saturated) state. LF has a characteristic salmon pink color, the intensity of which depends on the degree of iron saturation.2 Due to the high level of LF in human milk, the addition of LF to infant formula is of interest to infant formula manufacturers in order to imitate the nutritional properties and biological functionality of human milk.
Various technical approaches have been adopted in the determination of LF in dairy-based products, including spectroscopic, immunochemical, and chromatographic assays.1 AOAC Method 2021.10 provides a reliable and accurate solution for the determination of bovine lactoferrin (bLF) in infant formula and pediatric/adult nutritional formula.3 In this method, samples are dissolved in a sodium phosphate dibasic solution and then centrifuged to separate the whey (middle layer) from the fat (top layer) and casein (bottom layer). bLF is then isolated and purified from the whey using a heparin affinity column. Eluates from the heparin column are then collected for the RP-HPLC analysis using an XBridge Protein BEH C4 Column and detected at UV 280 nm.
This application note demonstrates the analysis of bLF following the AOAC Method 2021.10 on an Arc Premier System coupled with a 2998 PDA Detector. Two types of the XBridge Protein BEH C4 Column, the XBridge Protein BEH C4 Column (conventional column) and the XBridge Premier Protein BEH C4 Column (Premier Column), were evaluated in this study. Guidance for the improved analysis of bLF using the AOAC Method 2021.10, as well as the benefits of the MaxPeak HPS Technology, are also presented in this application note.
Experimental
The chemicals and analytical procedures that are recommended in AOAC 2021.10 were followed in this study except otherwise notified. The key sample preparation procedures and instrument conditions are listed below.
Standard Solutions
bLF stock solution I (10 mg/mL): 90–120 mg of bLF reference material (Certified Reference Material, Cerilliant L-047, Supelco, Bellefonte, PA) was weighed into a 10-mL volumetric flask (recorded to 0.01 mg). 5–8 mL of water was added and mixed gently. The solution was allowed to stand at room temperature for at least one hour until fully dissolved. The solution was diluted to volume and gently mixed. It was stored at 4 °C in a sealed plastic vessel protected from light. The concentration was calculated to 4 significant figures using the mass and purity of the reference material.
bLF stock solution II (~0.5 mg/mL): 1.25 mL of bLF stock solution I was pipetted and diluted to 25 mL with 0.05M Na₂HPO₄-1M NaCl buffer, pH 8.0 (eluting buffer) in a volumetric flask. It was stored at 4 °C in a sealed plastic vessel.
bLF Working Standards: Certain volumes of bLF stock solution II were diluted with the eluting buffer in silanized HPLC vials (Waters, p/n 186000307DV) to make bLF Working Standard solutions at 10, 20, 50, 100, 150, and 250 µg/mL. The solutions were mixed well and filtered into silanized HPLC vials through 0.45 µm, 13 mm wwPTFE Mini syringe filters (Waters, p/n: 186009315) for analysis. Fresh solutions were prepared daily.
Sample Preparation
Table 1 contains the sample identities and descriptions in this study. This group of samples represent various milk-based infant formula, pediatric/adult nutritional formula with different level of bLF content and hydrolyzed proteins.
Sample Hydration
- 0.5–1.50 g sample (or amount to contain 0.5–10 mg bLF) was weighed directly into a 15-mL centrifuge tube (Recorded to 0.0001 g).
- 11.5 mL warm (40 °C) 0.2 M sodium phosphate dibasic solution, pH 8.0 (loading buffer), was pipetted into the centrifuge tube in step 1 and vortexed well.
- The solution from step 2 was continuously mixed using a test tube rocker for at least 60 minutes, with periodic checks and manual vortex as needed.
- The mixture was centrifuged for at least 60 min at 3000 g at 4 °C. Note: 20 min at 8000 g was recommended in the AOAC Method 2021.10.
- The liquid layer between the fat (top) and solid (bottom) layers in the centrifuge tube was carefully transferred to a 25 mL volumetric flask.
- 11 mL warm (40 °C) loading buffer was pipetted into the same centrifuge tube from step 1 and vortexed the tube for 10 seconds or until fully suspended. Continued mixing by rocking for at least 20 minutes on the test tube rocker.
- The solution was centrifuged for 60 minutes at 3000 g at 4 °C (Note: 20 minutes at 8000 g was recommended in the AOAC Method 2021.10). Step 5 was then repeated, using the same transfer pipette from step 5 to transfer the liquid layer to the same 25-mL volumetric flask.
- The solution was diluted to volume with the loading buffer. The combined solution in the volumetric flask was thoroughly mixed and ready for the heparin affinity column purification.
Preparation of the Heparin Affinity Column
A 10-mL syringe barrel was connected to the heparin affinity column (HiTrap Heparin HP affinity column, 1-mL, GE17-0406-01, GE Healthcare, Chicago, IL) using a syringe fitted to the Luer connector. The snap-off end (for a new HiTrap heparin column) was removed, or the cap (for a used column) was unscrewed at the column outlet. The column outlet was tightly connected to a vacuum manifold (Waters p/n: 186008998). The heparin affinity chromatography column was equilibrated by passing 5-mL loading buffer through the column. Note: Each column may be used up to four times. However, if there is difficulty loading, washing, and eluting a sample, do not use the column again.
Sample Purification
- 5 mL of extract solution was pipetted into the syringe barrel. The solution was drained through the heparin affinity column with vacuum (the eluent was discarded). Note: the bLF being loaded onto the column should be at least 0.1 mg.
- The heparin affinity column was washed with 10.0 mL of loading buffer.
- The heparin affinity column was eluted with 4.50 mL of 0.05M Na2HPO4 – 1 M NaCl solution, pH 8.0 (eluting buffer). The eluent was collected and transferred into a 5.0 (or 10.0 mL) volumetric flask.
- The eluent was diluted to volume with the eluting buffer and mix well.
- A portion of the diluted eluent was filtered through a 0.45-µm, 13 mm wwPTFE Mini syringe filter into a silanized HPLC vial for analysis.
- After the final LF eluent was collected from the purification process, the heparin affinity column was washed using the vacuum manifold with 5 mL of 0.05M Na₂HPO₄ – 2 M NaCl solution, pH 8.0 (clean-up buffer), and then with 5 mL of 20% ethanol. The heparin affinity column was stored in 20% ethanol at room temperature for reuse up to four times. Note: The column should be discarded if the sample matrix binds to the column during the purification step, as indicated by significant restriction in flow.
LC Conditions
|
LC system: |
Arc Premier System (Binary Solvent Manager) with 2998 PDA Detector |
|
UV detection: |
UV 280 nm (resolution 4.8 nm) |
|
Software: |
Empower™ 3 Chromatography Data Software |
|
Column: |
XBridge Protein BEH C4 Column (3.5 µm, 4.6 x 150 mm, p/n 186004504); or XBridge Premier Protein BEH C4 Column (2.5 µm, 4.6 x 150 mm, p/n 186010334) |
|
Column temperature: |
35 °C |
|
Inj. volume: |
50 µL |
|
Run time: |
16 min |
|
Mobile phase A: |
0.1% Trifluoroacetic acid solution |
|
Mobile Phase B: |
0.1% Trifluoroacetic acid in acetonitrile solution |
|
Elution program: |
See the table below. Note: A minor modification of this gradient program was discussed in the Results and Discussion |

Calculation
A linear external calibration curve was obtained by the least squares regression of the peak area of bLF standards vs the standard concentration values (µg/mL) with a 1/x weighting. The bLF concentration (mg bLF/100 g) in the sample was calculated as below:
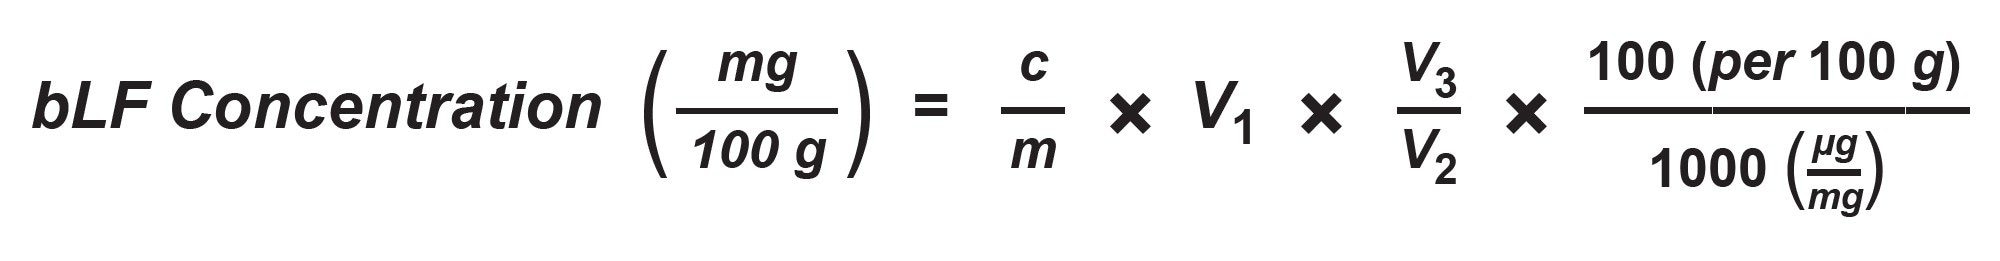
C = bLF concentration derived from the standard calibration curve (µg/mL)
m = Sample weight (g)
V1 = Sample volume after centrifuge steps, combining both liquid layers and diluting to volume (25 mL)
V2 = Volume loaded onto the HiTrap column (5 mL)
V3 = Final collection volume after HiTrap column (5 or 10 mL)
Results and Discussion
Calibration Linearity
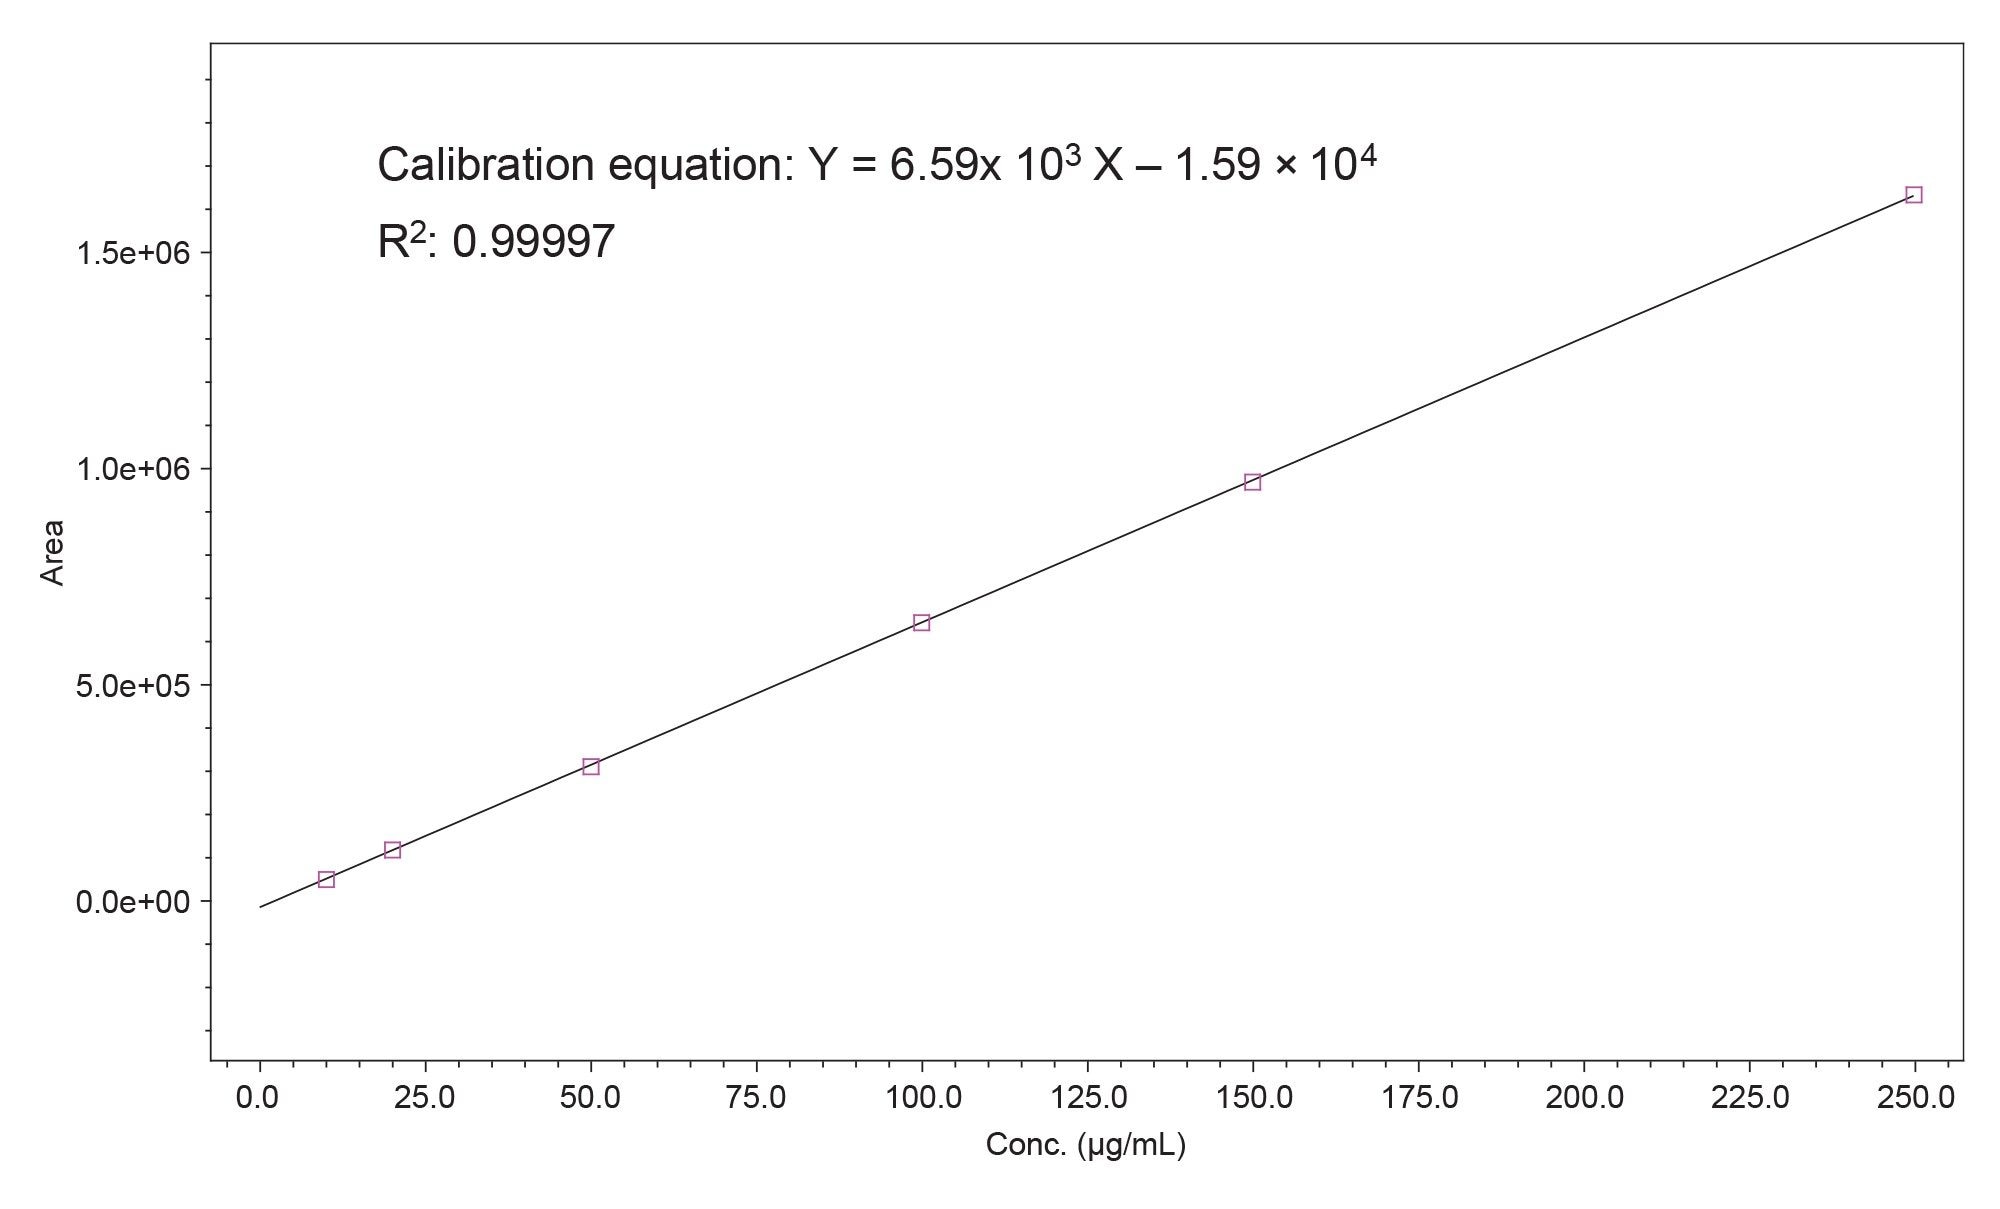
The representative calibration plot of the peak area vs. the bLF concentration (µg/mL), and the fitted linear calibration curve are shown in Figure 1, in which the calibration equation and a coefficient of determination (R2) of 0.99997 are shown. The R2 values obtained in this study were at least 0.9997 with the deviation of data points from the fitted values being less than ±5%, indicating excellent linear relationship between the peak area and the bLF concentration in this analysis.
Sample Analysis
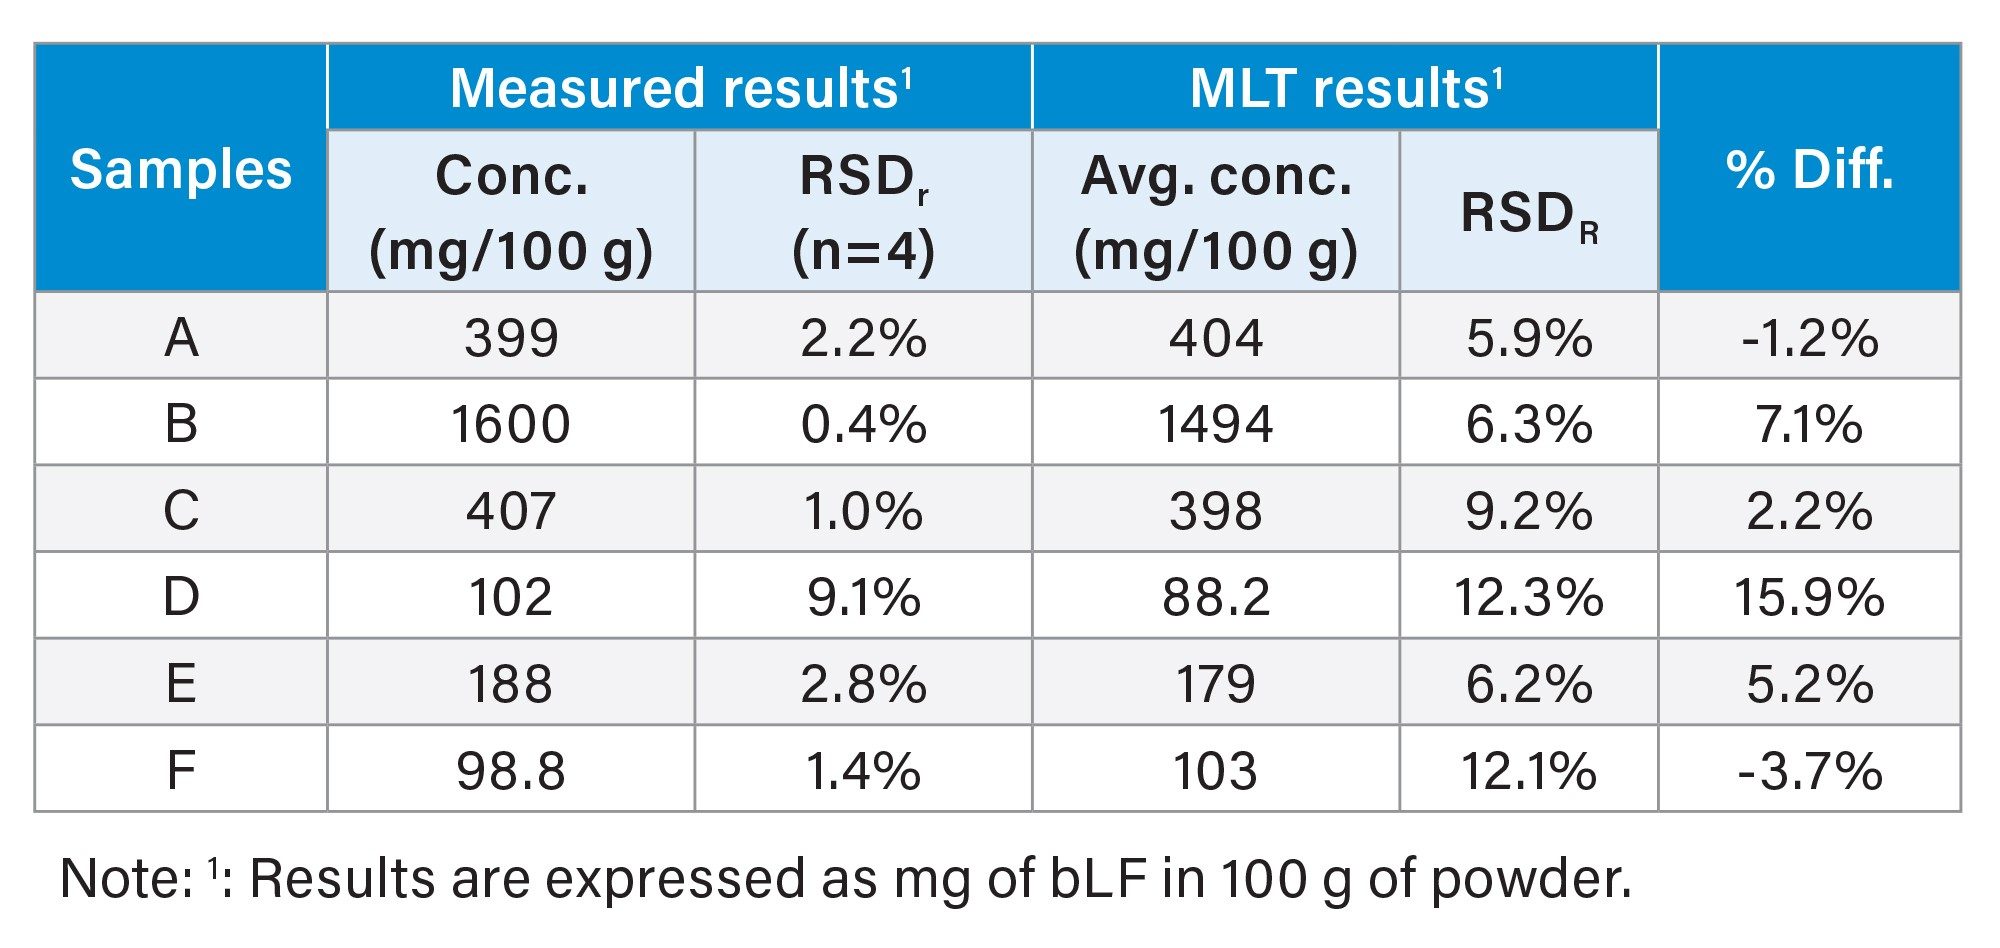
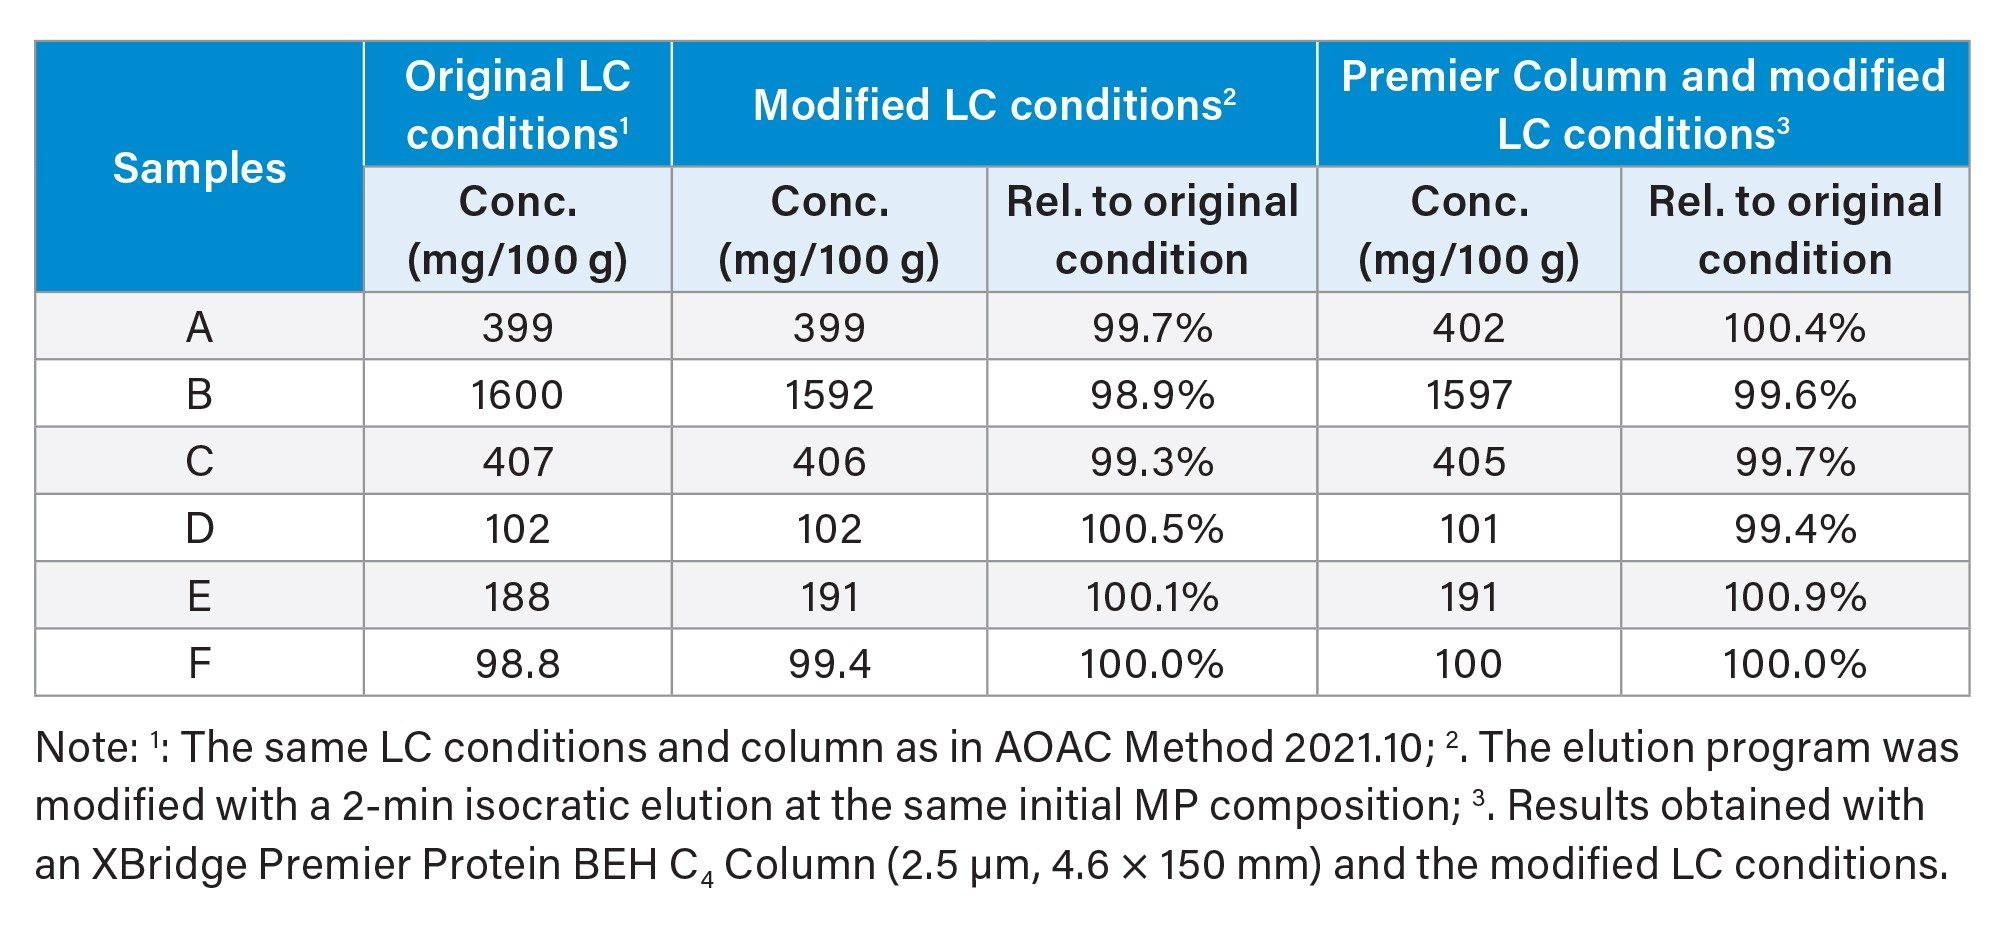
Table 2 shows the sample analysis results. These samples were the representative samples that were also tested in the multi-lab testing (MLT) validation study, in which 12 labs participated, for the AOAC Method 2021.10.4 The average concentrations and the reproducibility (RSDR) in the MLT results were included in this table for comparison. The repeatability (RSDr) in this study ranged from 0.4% to 2.8%, with exception of sample D, which was 9.1%. The relative difference between the measured concentrations in this study and the MLT reference values ranged from -3.7% to 7.1%, with exception of sample D, which was 15.9%. Please note that the relative difference for Sample D (15.9%) was not significantly larger than the RSDR (12.3%) in the MLT results. The relatively large RSDR values for Sample D (12.3%) and F (12.1%) in MLT results might reflect the challenges in measuring low bLF content in samples. Nevertheless, the overall results demonstrated the excellent precision and accuracy in determination of bLF in the MLT samples using the Arc Premier System and the XBridge Protein BEH C4 Column. Also please note that the partially hydrolyzed samples are not currently included in the scope of the AOAC 2021.10 Final Action Method.4
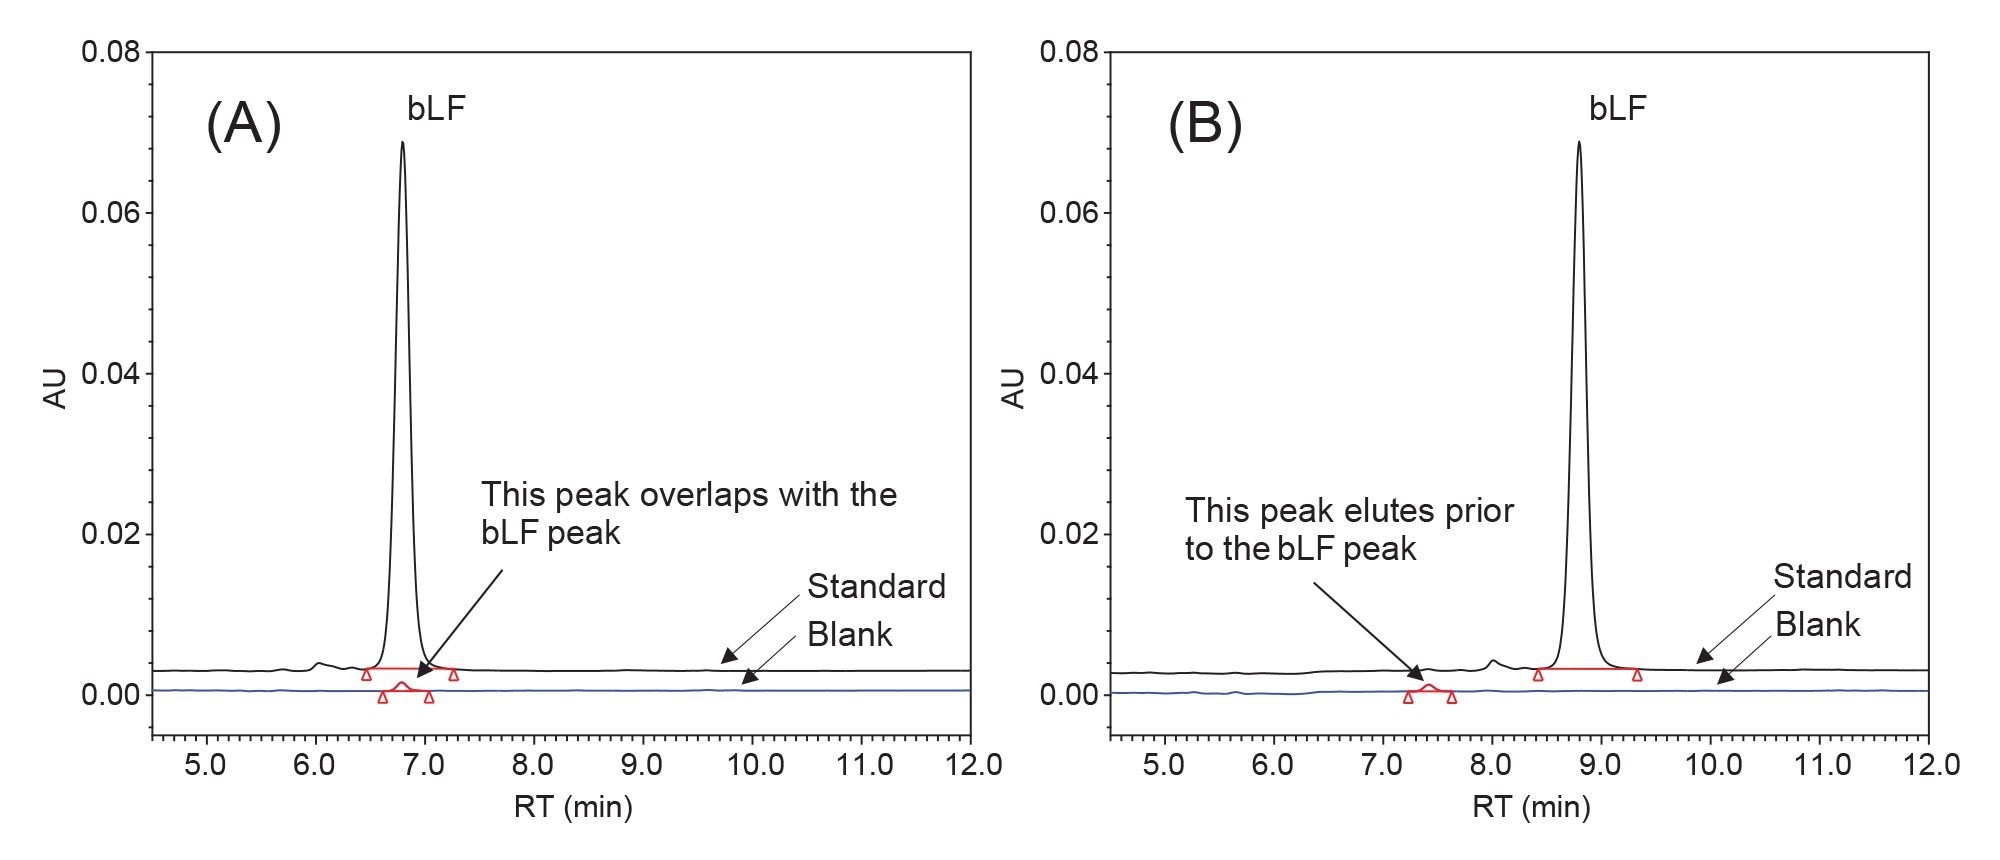
Potential Co-elution
The heparin affinity column purification effectively removed most of the matrix background, with the bLF peak emerging as the only main peak in the chromatogram. However, a small unknown peak in the solvent blank eluted at the same retention time of the bLF peak (see Figure 2A). Adjusting the column temperature (30–45 °C) did not resolve the issue. The problem was eventually addressed by adding a 2-min hold at the initial elution program (Figure 2B). This small unknown peak had minimal impact on the final sample analysis results in this study (see Table 3). The relative difference between the results obtained using the modified LC conditions (with a 2-minute initial hold) and those obtained using the original LC conditions were within ±1.1% (Table 3). We also compared the XBridge Premier Protein BEH C4 Column under the modified LC conditions, and similar results were obtained (Table 3). The comparison was performed to investigate the effects of the MaxPeak HPS Technology, as discussed next.
Benefits of MaxPeak HPS
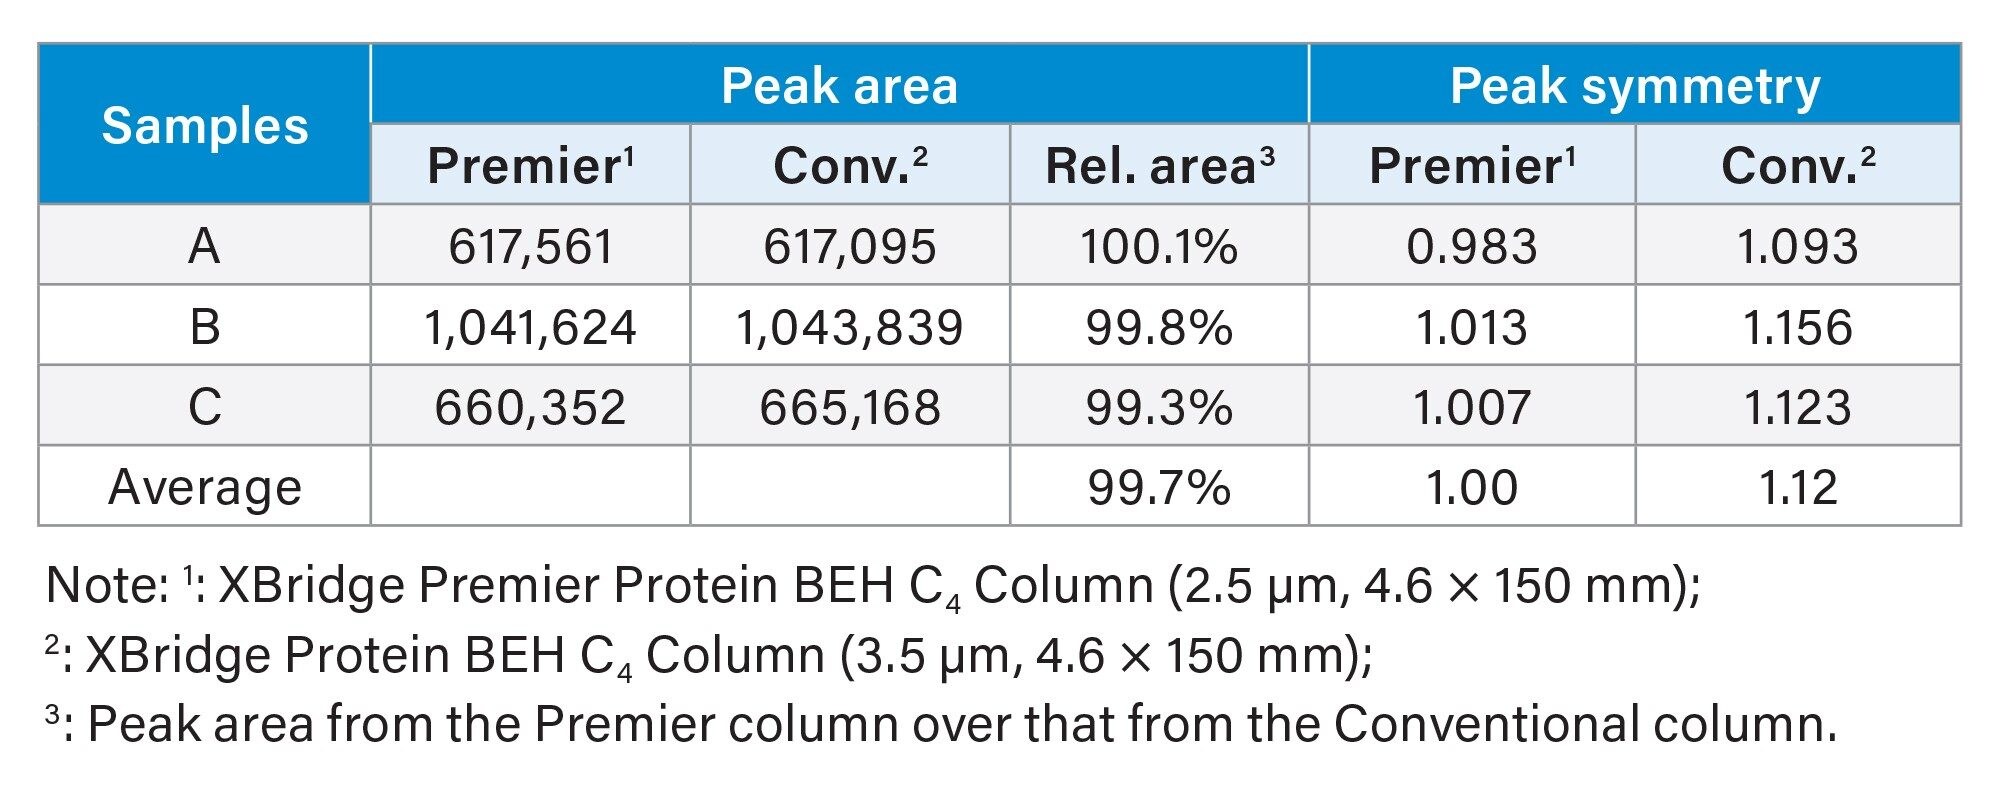
MaxPeak HPS Technology has been proved very useful in mitigating chromatographic issues that were related to metal analyte interactions.5–10 MaxPeak HPS Technology has been incorporated in Waters Premier Solutions (systems and columns). To investigate the potential impact of MaxPeak HPS Technology in the bLF analysis, the XBridge Premier Protein BEH C4 Column (2.5 µm, 4.6 x 150 mm) was employed in the sample analysis under the same conditions, and the results were compared with those obtained on the XBridge Protein BEH C4 Column (3.5 µm, 4.6 x 150 mm). Due to the lack of columns with the same particle size for these two types of columns, columns with different particle sizes (2.5 µm and 3.5 µm) were used in comparison. Table 4 is the comparison results in peak area and peak symmetry between the Premier Column and the conventional column. The peak areas from both columns were the same. However, the peak symmetry from the Premier Column were better than those from the conventional column.
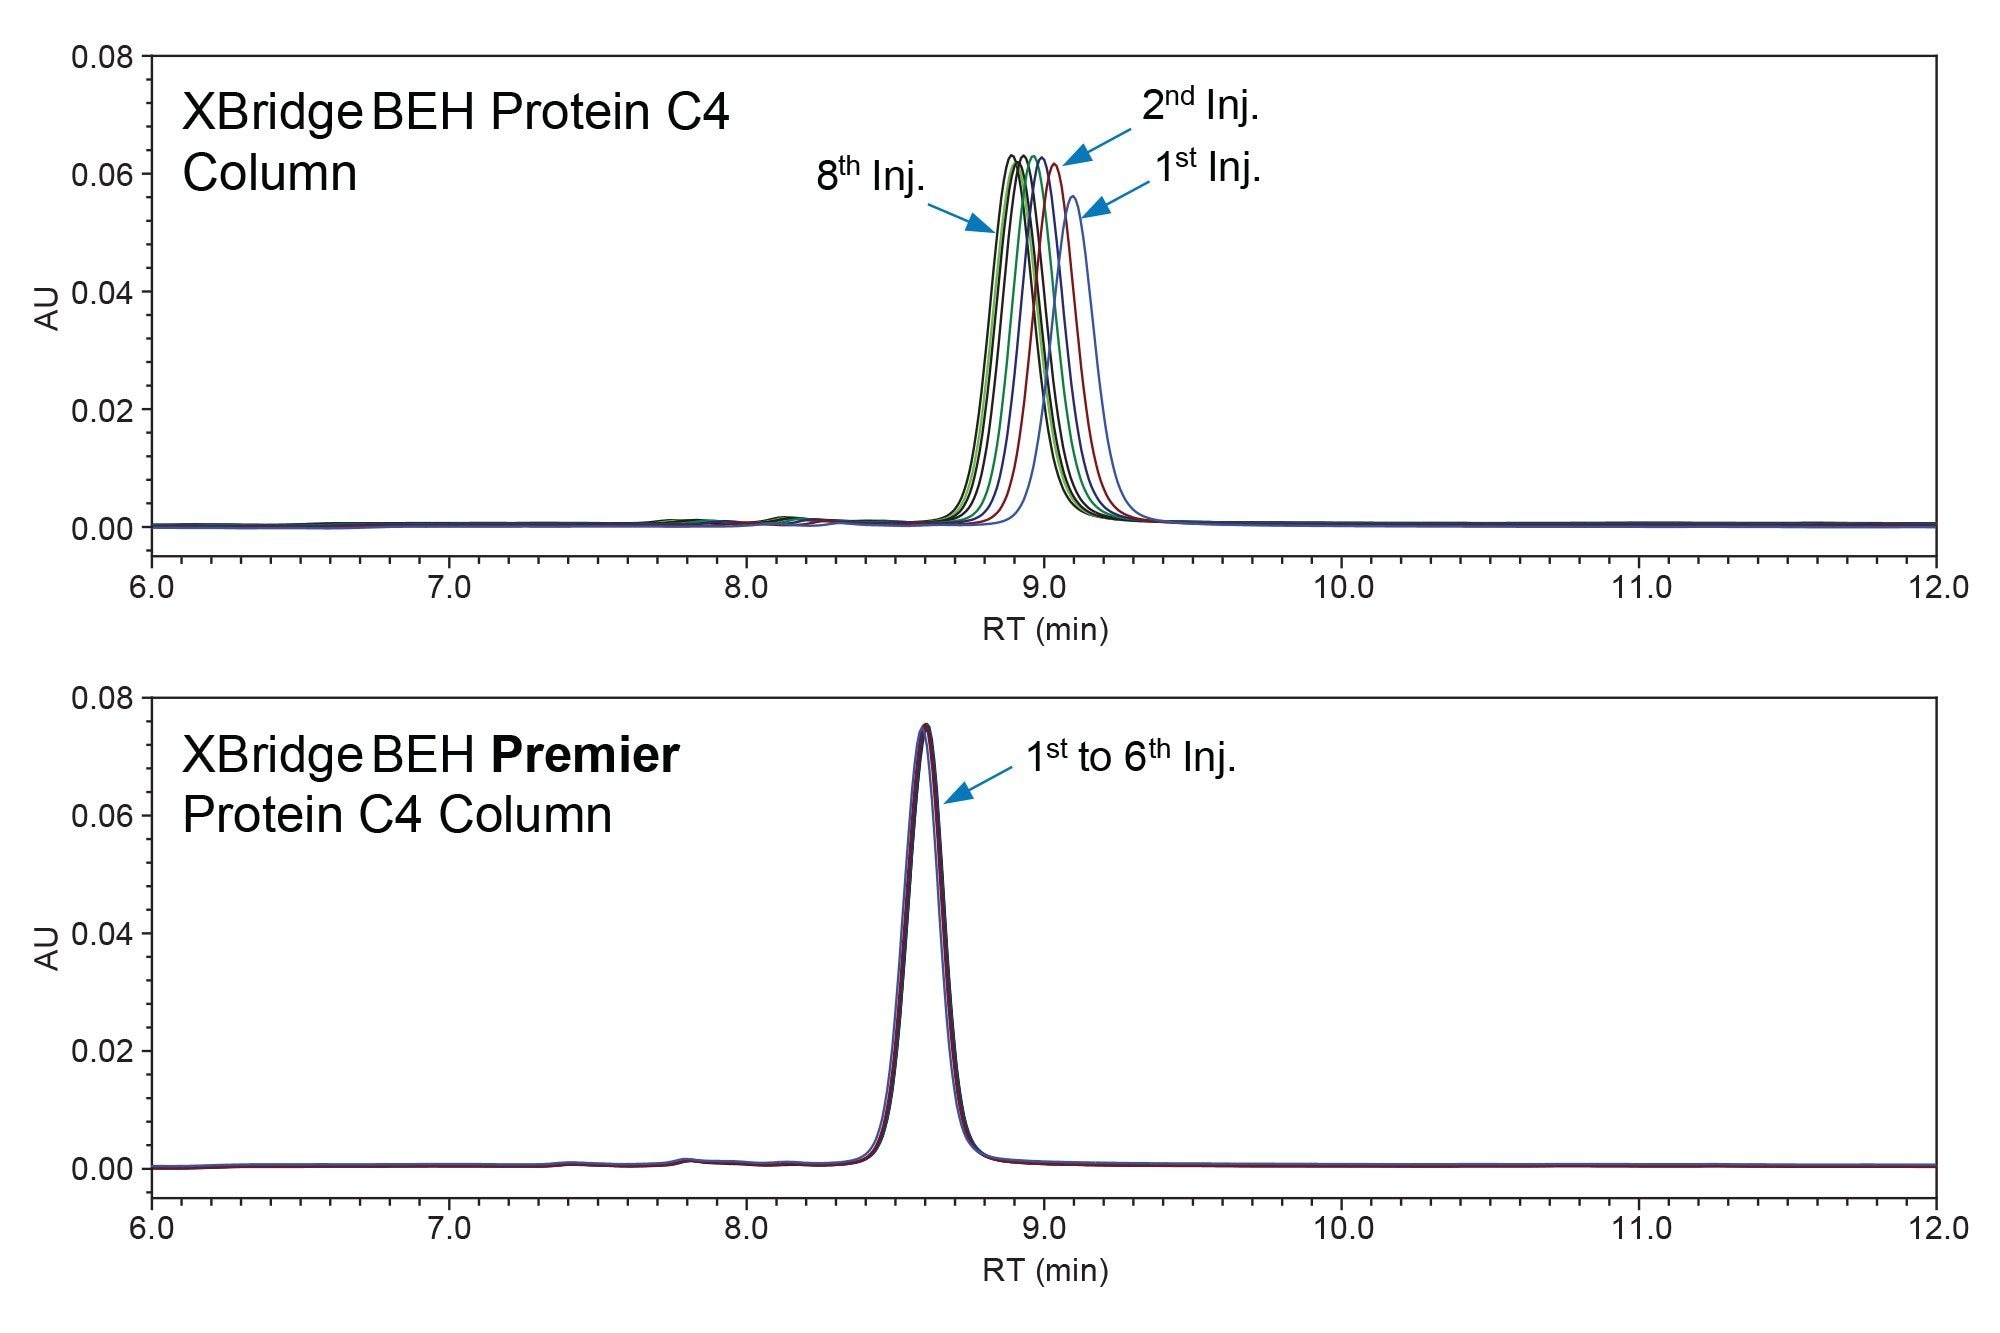
We also compared the chromatographic performance of these two types of columns when they were in their new, out-of-the-box, state. This comparison was conducted before the columns were exposed to any analytes to assess the kinetic aspects of the metal-analyte interaction, which also played a critical role in chromatographic performance. Figure 3 highlights significant differences in the performance of these two new columns. The conventional column showed inconsistent results in the initial repeated injections of a bLF standard, while the Premier Column showed consistent results from the very first injection. This difference indicated that the MaxPeak HPS Technology was extremely effective in mitigating the adsorption of bLF onto the column hardware surfaces, which include the column frits and the internal surface. In contrast, the conventional column required more than eight injections to reach a stable performance, in terms of both retention time and peak area. This may lead to a much shorter column conditioning time for the Premier Columns compared to the conventional columns. Note: It is still prudent to check the column performance consistency prior to the sample analysis. However, the chance of lengthy column conditioning is much lower for the Premier Column compared to the conventional column. Please also note that higher and narrower peaks were observed on the Premier Column compared to the conventional column, but these were believed to be most likely attributed to the smaller particle size in the Premier Column, not necessarily to the MaxPeak HPS Technology.
Conclusion
We successfully implemented AOAC Method 2021.10 for the determination of bLF in infant and pediatric/adult nutritional formulas in our lab using an Arc Premier System coupled with a 2998 PDA Detector. Excellent linearity, precision, and accuracy were demonstrated in the analysis of bLF in representative samples. We also identified a potential co-elution issue and addressed it by developing a modified elution program. The potential benefits of MaxPeak HPS Technology were also evaluated. While the overall sample analysis results were comparable between the conventional column and the Premier Column, the Premier Column exhibited improved chromatographic performance in terms of peak shape and consistency (required less column conditioning). Based on these observations, the Arc Premier System coupled with the XBridge Premier Protein BEH C4 Column provides an optimal and reliable solution for the determination of bLF in infant and pediatric/adult nutritional formulas.
Acknowledgement
Authors would like to express our sincere gratitude to the AOAC MLT Study Director, Jennifer Frueh from Reckitt Nutrition (Parsippany, NJ), for the guidance in setting up the bLF analysis in our lab, for providing the samples and standards, and for permission to use the MLT average results for comparison.
References
- Ellingson, D. J., Shippar, J. J., Vennard, T. R., Moloney, C., O’Connor, D., O’Regan, J., McMahon, A., & Affolter, M. (2019). J. AOAC Int. 102, 915–925. doi: 10.5740/jaoacint.18-0226.
- Steijns, J.M., & van Hooijdonk, A.C. (2000) Br. J. Nutr. 84, 11–17.
- Frueh, J. L., Shu, P., Vennard, T. R., Gray, M. A., & Phillips, S. C. (2024). J. AOAC Int, 107, 693–704. doi:10.1093/jaoacint/qsae038.
- Frueh, J., Vennard, T., Gray. M., and Phillips, S. AOAC 2021.10 Multi-laboratory testing validation study report (manuscript in preparation for submission to J. AOAC. Int.). Please note that the partially hydrolyzed products have been suggested not to be included in the applicability scope of AOAC 2021.10 Final Action Method for inconclusive recovery brought to light in the MLT study.
- Lauber, M.; Walter, T. H.; DeLano, M.; Gilar, M.; Boissel, C.; Smith, K.; Birdsall, R.; Rainville, P.; Belanger, J.; Wyndham, K. Waters White Paper. 720006930. 2020.
- Birdsall, R. E.; Kellet J.; Ippoliti, S.; Ranbaduge, N.; Shion, H.; Yu, Y. Q. Waters Application Notes. 720007003. 2020.
- Boissel, C.; Walter, T. H. Waters Application Notes. 720007014. 2020.
- Smith, K. M. and Rainville, P. Application Notes. 720006721. 2020.
- Brennan, K.; Lame, M. L.; Donegan, M.; Rainville, P. D. Waters Application Notes. 720007019. 2020.
- Yang J., Wilson I., Rainville P. Evaluation of hybrid surface technology for the analysis of the B-group vitamins by LC-ESI-MS/MS. J. Chromatogr. B Analyt. Technol. Biomed. Life. Sci. 2022;1204:123336. doi: 10.1016/j.jchromb.2022.123336.
720008773, April 2025