This is an Application Brief and does not contain a detailed Experimental section.
Standard methods for isoflavones in dietary supplements have been established by organizations such as USP and AOAC. These methods use reversed-phase LC with C18 columns and ultraviolet and visible light (UV-Vis) spectroscopy for separation and quantitation. Because of the close structural similarity of these compounds, the chromatographic run times of these methods are typically over 70 minutes long. It is highly desirable to develop a more rapid isoflavone analysis method.
This application note (Part 1 of 3) demonstrates the transfer of the USP method onto an ACQUITY Arc UHPLC System. The analysis time with the ACQUITY Arc System is only 18 minutes, including column wash and equilibration. The ACQUITY QDa Mass Detector was used to expedite the method transfer described in this study.
Benefits of this method include:
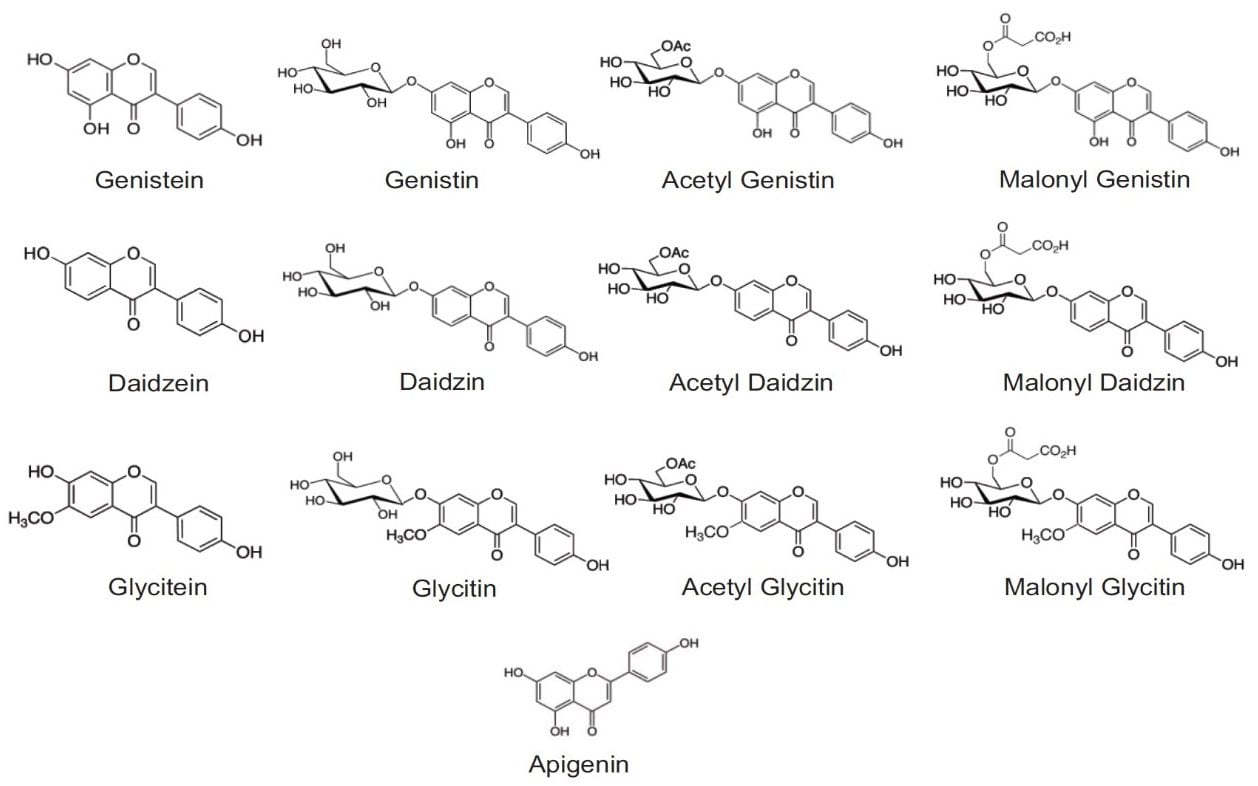
Isoflavones are found primarily in plants of soy (Glycine max), red clover (Trifolium pretense), and Kudzu (Pueraria lobata). The 12 major isoflavones found in these plants are daidzein, glycitein, genistein, and their respective glucoside and malonyl- and acetyl- glucoside derivatives. The structures of 12 isoflavones and an internal standard, apigenin, are shown in Figure 1. These hormone-like compounds are often used in remedies to reduce menopausal and post-menopausal symptoms. They are even associated with low breast cancer rate in Asia and the retarded progression of Alzheimer’s disease.
Standard methods for isoflavones in dietary supplements have been established by organizations such as USP1 and AOAC.2 These methods use reversed-phase LC with C18 columns and ultraviolet and visible light (UV-Vis) spectroscopy for separation and quantitation. Because of the close structural similarity of these compounds, the chromatographic run times of these methods are typically over 70 minutes long. It is highly desirable to develop a more rapid isoflavone analysis method.
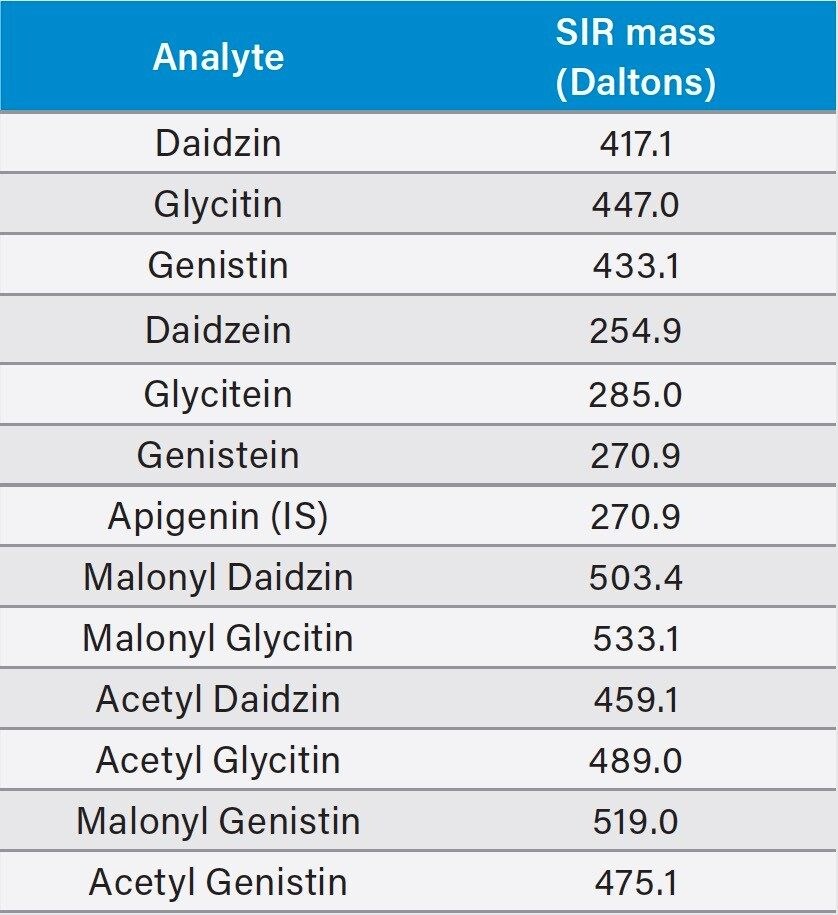
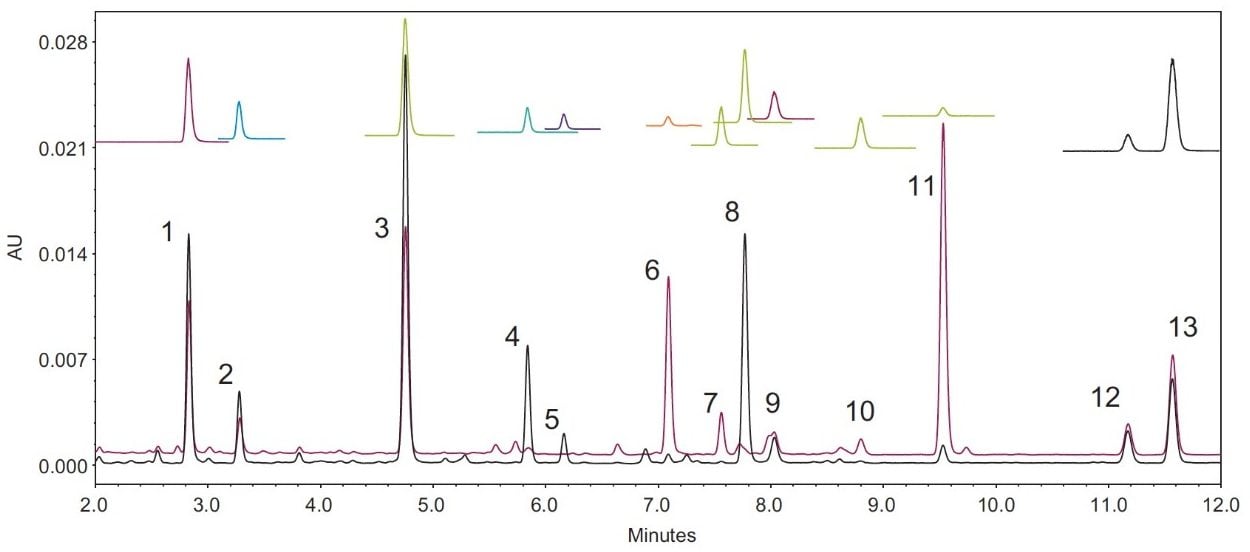
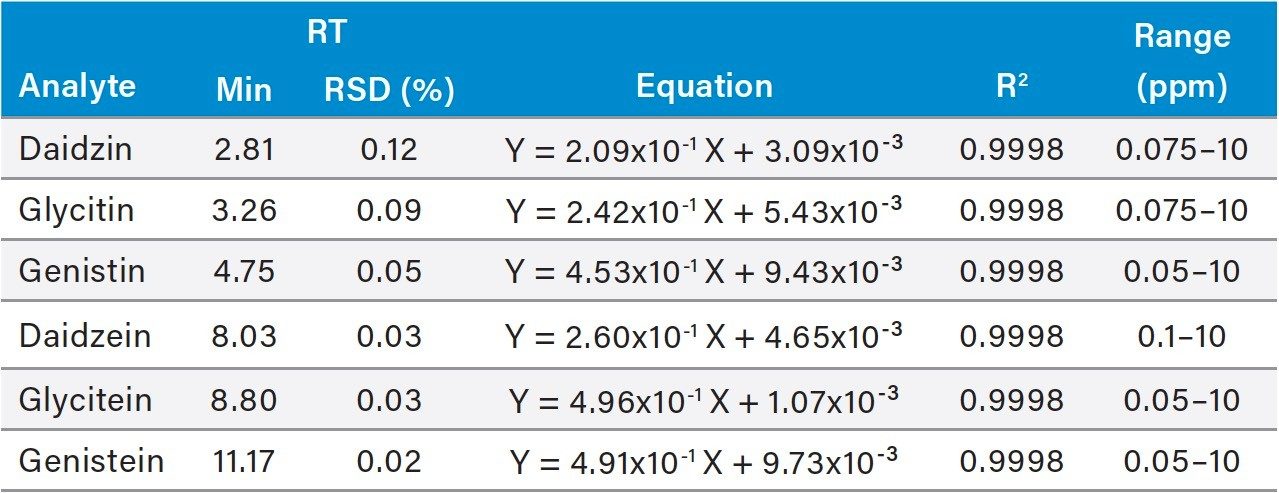
This application note demonstrates the transfer of the USP method onto Waters ACQUITY Arc UHPLC System. The analysis time with the ACQUITY Arc System is only 18 minutes, including column wash and equilibration. Waters ACQUITY QDa Mass Detector was used to expedite the method transfer described in this study. The benefits of mass detection in peak identification and method optimization are also highlighted.
Sample preparation
The standards, daidzin, glycitin, genistin, daidzein, glycitein, genistein, and apigenin, were purchased from ChromaDex (Irvine, CA) and INDOFINE Chemical (Hillsborough Township, NJ). Defatted powdered Soy RS was purchased from US Pharmacopeia (Rockville, MD). NIST SRM 3238 was purchased from NIST (Gaithersburg, MD). Isoflavone dietary supplement samples from major brands were purchased from online retail stores.
The standard and sample solutions were prepared the same way as in the USP isoflavone method.1 Sample solutions were further diluted with an acetonitrile water mixture (2/3 by volume) to various levels to fit the calibration range. The concentration of internal standard was always kept constant at 4 ppm.
UHPLC system |
ACQUITY Arc |
Detector |
2998 PDA |
Software |
Empower 3 |
Column |
CORTECS C18 2.7 μm, 3.0 x 100 mm |
Column temp. |
30 °C |
Mobile phase A |
Water with 0.1% formic acid |
Mobile phase B |
Acetonitrile with 0.1% formic acid |
Injection volume |
2.0 μL |
Flow rate |
1.08 mL/min |
Run time |
18.0 min |
UV detection |
260 nm |
UV resolution |
1.2 nm |
|
Time (min) |
Flow rate (mL/min) |
%A |
Curve |
---|---|---|---|---|
1 |
Initial |
1.08 |
90 |
6 |
2 |
14.40 |
1.08 |
70 |
6 |
3 |
14.50 |
1.08 |
10 |
6 |
4 |
15.20 |
1.08 |
10 |
6 |
5 |
15.40 |
1.08 |
90 |
6 |
6 |
18.00 |
1.08 |
90 |
6 |
MS system |
ACQUITY QDa (Performance) |
Ionization mode |
ESI+ |
Capillary voltage |
0.8 kV |
Cone voltage |
15 V |
Probe temp. |
600 °C |
SIR masses |
Stated below |
The USP method (isoflavones powder extract)1 was transferred to an ACQUITY Arc UHPLC System with a CORTECS C18 Column (2.7 μm, 3 x 100 mm), p/n: 186007372. The CORTECS Column’s 2.7 μm packing material is solid-core particle, which provides higher separation efficiency and lower back pressure than a fully porous particle column of equivalent particle size. The USP method gradient elution program was converted to a new gradient elution program using Waters ACQUITY UPLC Column Calculator.3 The column parameters in the USP method (5 μm, 3.0 x 250 mm) and the parameters of the CORTECS C18 Column (2.7 μm, 3.0 x 100 mm), as well as the USP method's 74 minutes gradient elution program were entered in the column calculator, and a 18 minutes gradient elution program that is equivalent to the USP method was calculated. The mobile phase additive was changed from 0.05% phosphoric acid to 0.1% formic acid, which is a more MS friendly additive.
The factory default ACQUITY QDa Detector instrument parameters were used without any modification. The column temperature of 40°C was tested, but was later optimized to 30°C to meet the USP suitability criteria on peak resolution. Figure 2 shows the chromatograms of the USP defatted powdered soy RS, unheated and heated, and their Single Ion Recording (SIR) traces that were obtained using the ACQUITY QDa Mass Detector. Mass detection was used to confirm the peak identities.
Since the acetyl and malonyl isoflavone standards were not commercially available, the peak assignment of these compounds were carried out using a reference material and a pattern matching method as described in the USP standard. Heat treatment of defatted soy (DFS) can convert the malonyl forms to the acetyl forms. By comparing the chromatograms of the unheated DFS and the heated DFS and their reference chromatograms, one can assign the peak IDs to those acetyl and malonyl isoflavones. However, this pattern matching approach is not reliable, especially when LC conditions, such as the column, the mobile phase additives, or the LC system are changed. The ACQUITY QDa detects the ions that are formed in electrospray ionization (ESI) at unit mass resolution (0.7 Da). Table 1 lists the molecular ions of these isoflavones. Using mass detection, we were able to selectively detect these compounds and eliminate any possible interference from closely eluting compounds.
Genistein and apigenin have the same mass, but their peaks were well separated by chromatography (see Figure 2). The addition of mass detection (ACQUITY QDa Detector) enabled unambiguous assignment of peak IDs to the correct acetyl and malonyl isoflavones without resorting to individual standards.
The ACQUITY QDa Detector also sped up the method optimization because the selective detection of every compound allowed us to monitor the retention time (RT) changes of all compounds simultaneously with high confidence. This greatly saved the number of injections in method optimization. More details on how the QDa detector benefits the method transfer are discussed in a separate application note.4
Table 2 shows the UV calibration results of the standards. Apigenin was used as the internal standard for calibration and quantitation of all compounds. The square of the correlation coefficients (R2) between the relative responses (peak area ratio) and the concentration of standards in solutions (ppm) for all compounds were better than 0.999. The retention time relative standard deviations for all compounds were less than 0.12%.
Table 3 shows the isoflavone results for the NIST 3238 SRM and the comparison to its certified and reference values. A relative difference of <11% was obtained for the genistin, glycitin, daidzin, genistein, and glycitein. The result of daidzein was 15% higher than the NIST value. A literature search found that a high daidzein value was also reported elsewhere.5 The accuracy for the daidzein, genistein, and glycitein were also evaluated by a spiking experiment (Table 4). Recoveries of 98% to 101% were obtained for these compounds.
The isoflavone content in four isoflavone dietary supplement samples were measured by the fast 18-minute UHPLC-UV method described above. Sample types included tablets, capsules, and soy powder. The USP calibration and quantitation protocols1 were followed in the data processing.
The same conversion factors for the acetyl and malonyl derivatives that are specified in the USP HPLC-UV method were used in the analyses. Table 5 shows the determined individual and the total isoflavones, as well as the label claimed total isoflavone contents. For easy comparison, the label claim values were converted to concentration (mg/kg). Two of the three samples (C and D) showed good agreement between the determined values and their label claim values, while one sample (B) contained much less measured total isoflavone content then claimed on its label. The reason for such low total isoflavone content is unknown.
The USP method for isoflavones was successfully transferred to an ACQUITY Arc UHPLC System with a 2998 PDA Detector. The total analysis time per injection on the UHPLC system was 18 minutes, which was significantly shorter than the 74 minutes for the USP method. This corresponds to a three times increase in the analysis throughput, and a 75% cost savings for solvents used. The ACQUITY QDa Mass Detector provided excellent detection selectivity, which is a great asset in method transfer and development, as well as in the isoflavone analysis of unknowns and challenging samples where potential interference risk is high. Analysis of isoflavones in three dietary supplements showed compliance in the label claims for two samples. Low isoflavone content was found in one of the three tested samples for unknown reason.
720005858EN, December 2016