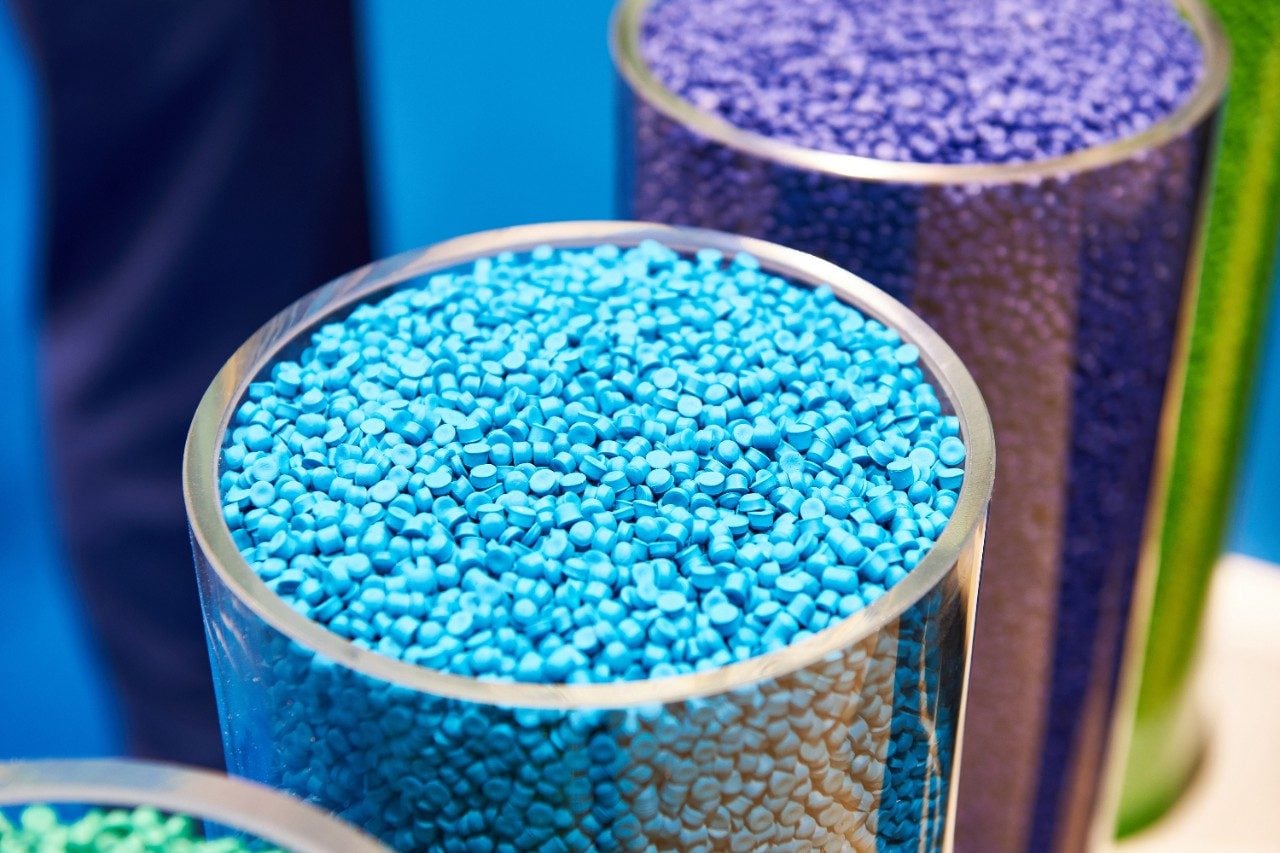
Polymer additives protect and enhance the performance of polymer and plastic products throughout the cycle of manufacturing, processing, storage and final applications. Products used every day such as fibers, textiles, furniture, sports equipment, packaging, wire and cable, consumer electronics, telecommunication equipment, automobiles, and airplanes are all made entirely or partially of polymers and plastics. Their widespread use results not only from the development of new polymer chemistry and resins but also from the advancement of polymer additives. A variety of additives are used in polymer resin processing to generate products with specific processing characteristics and functional properties (color, shape, mechanical strength) as well as resistance to heat, flame, oxidation, aging, and light degradation.1-2
In manufacturing, a synergistic blend of polymer additives is incorporated into polymer and plastic products; small differences in the mixture can dramatically affect the characteristics of the products. To ensure that the intended amount of additive is in the polymer solution, accurate, reliable, and robust analytical methods are needed in QC and Central Analytical labs. Chromatographic techniques are the most widely used methods for the analysis of polymer additives. The typical separation time using conventional HPLC is approximately 20 to 40 minutes.2-6
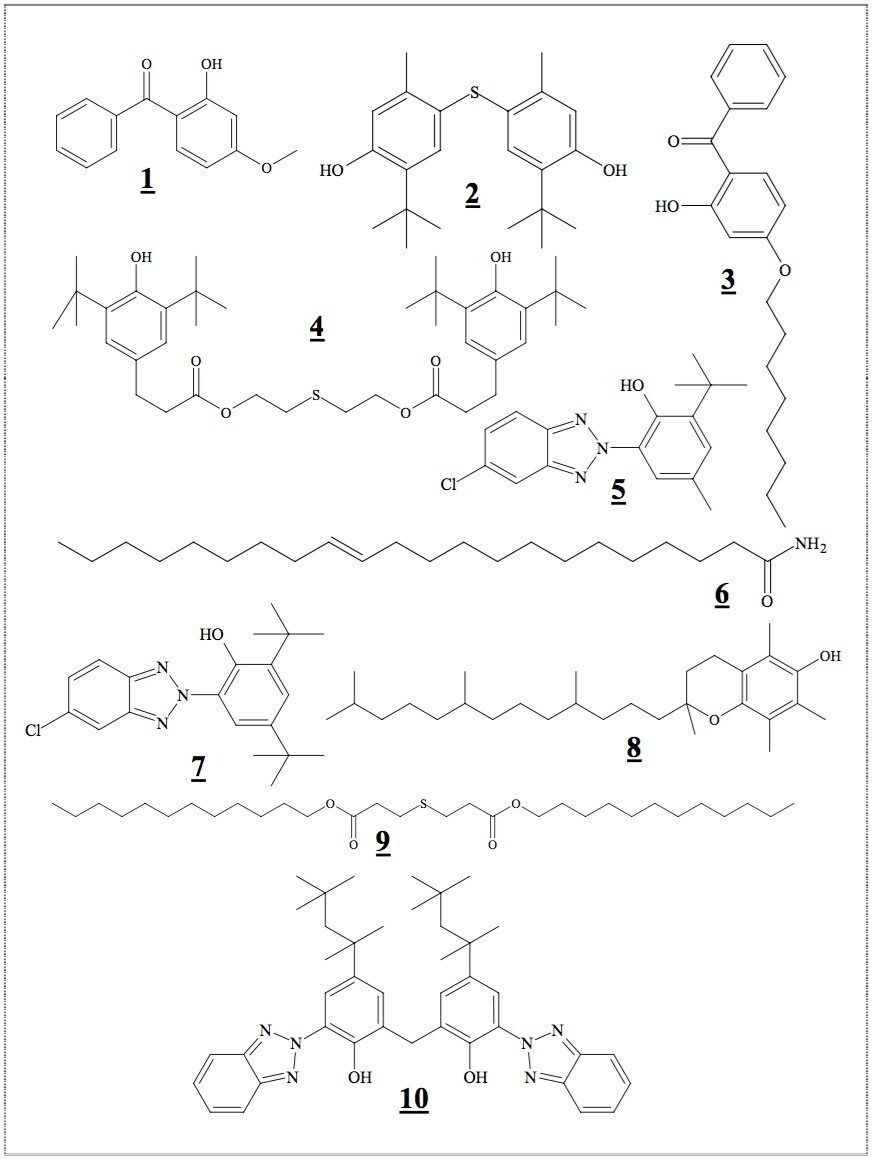
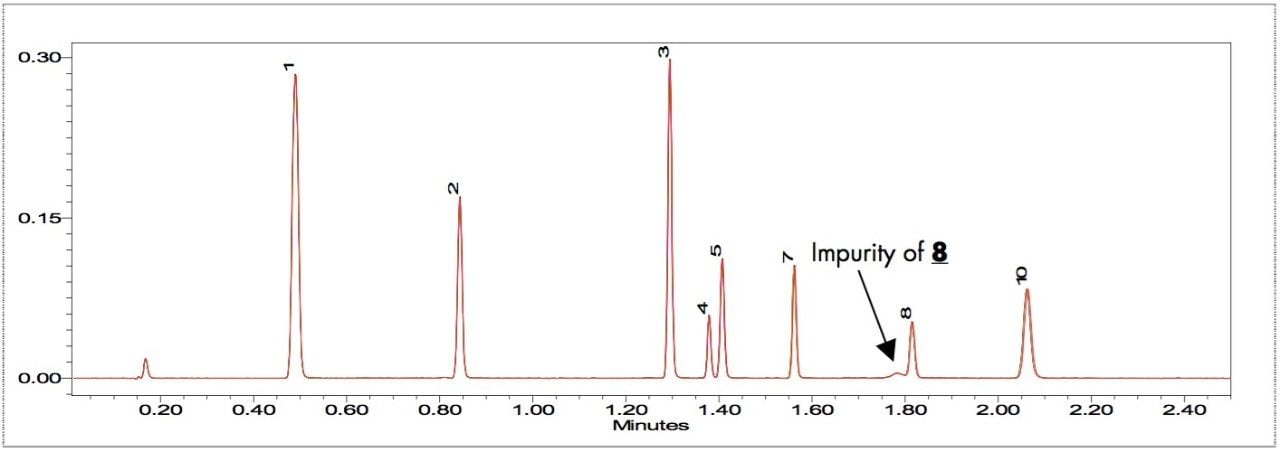
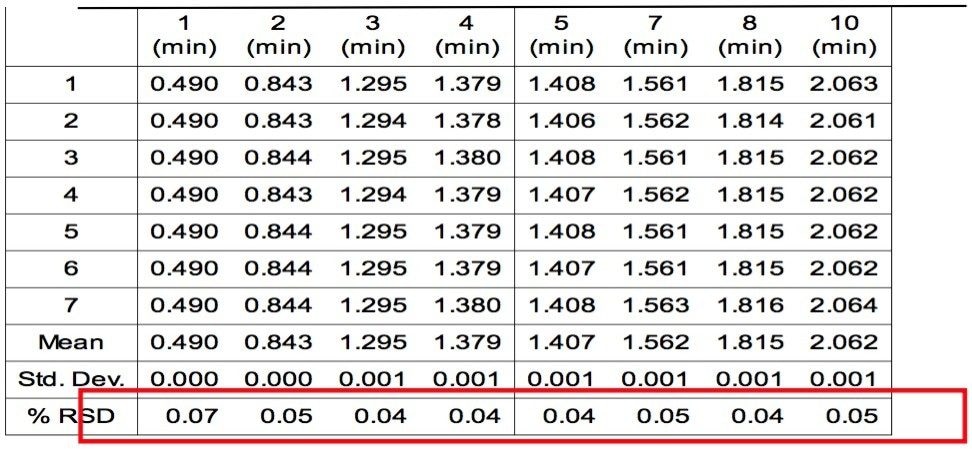
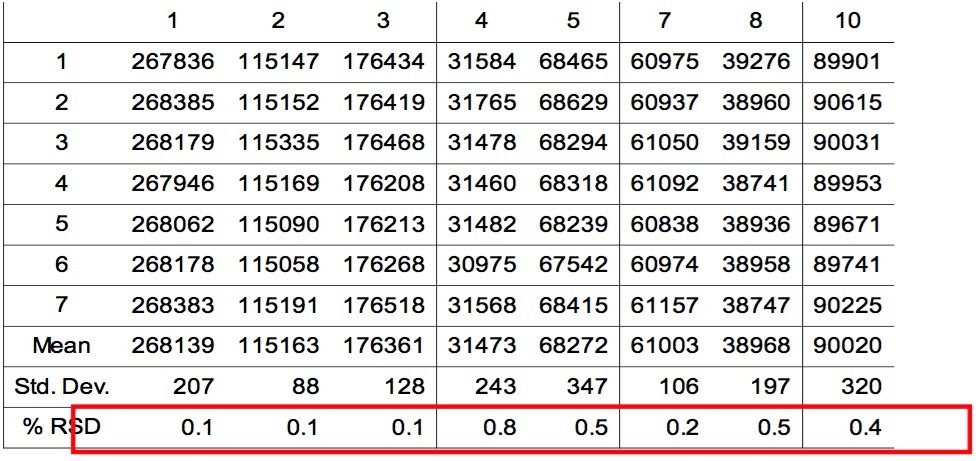
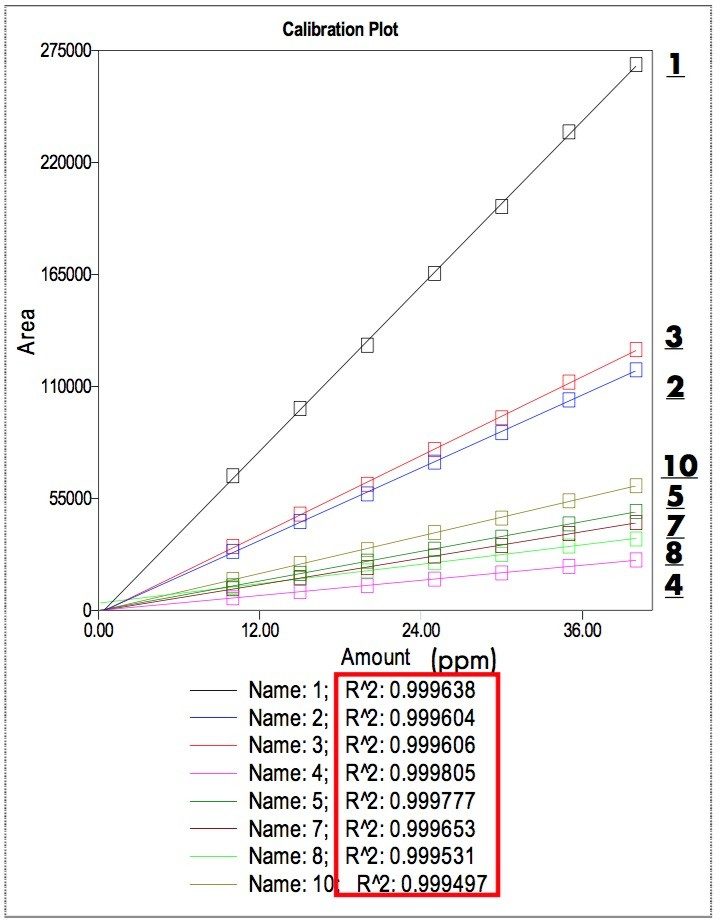
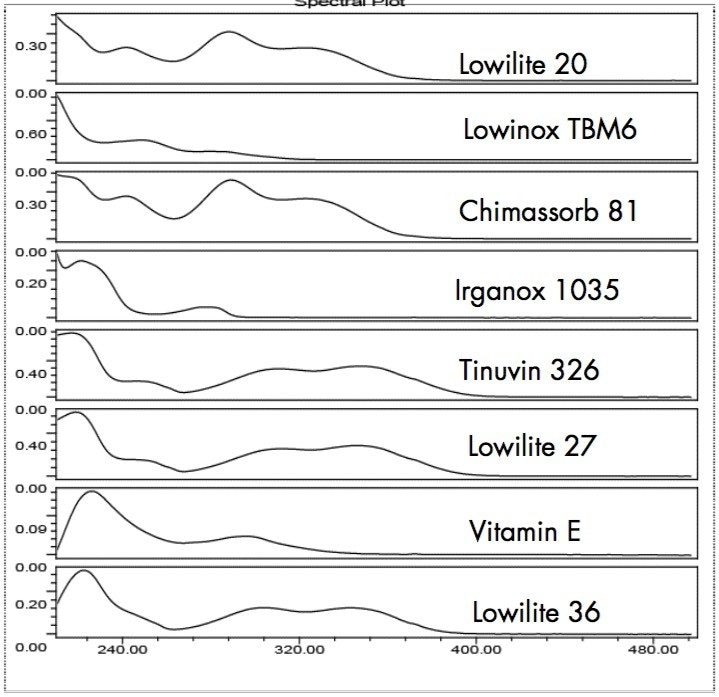
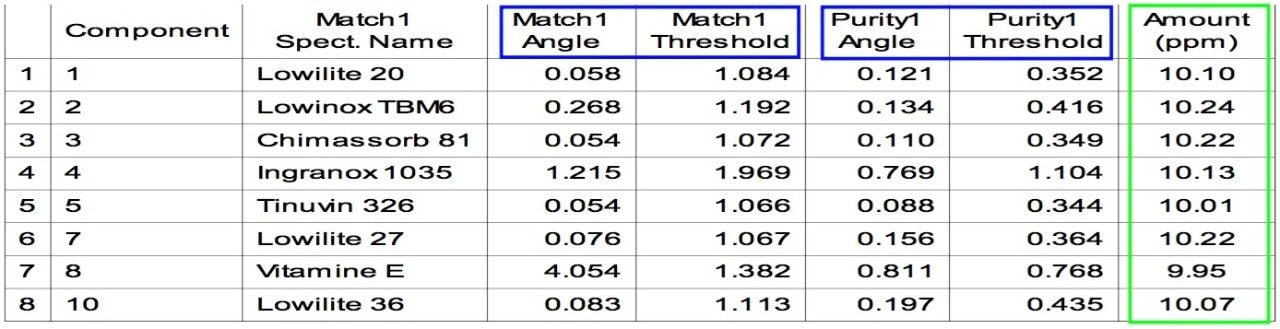
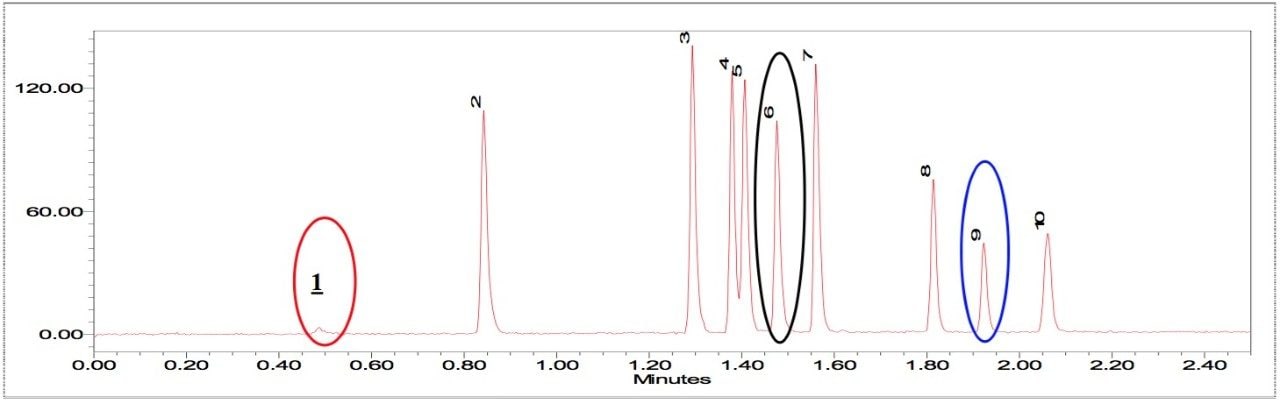
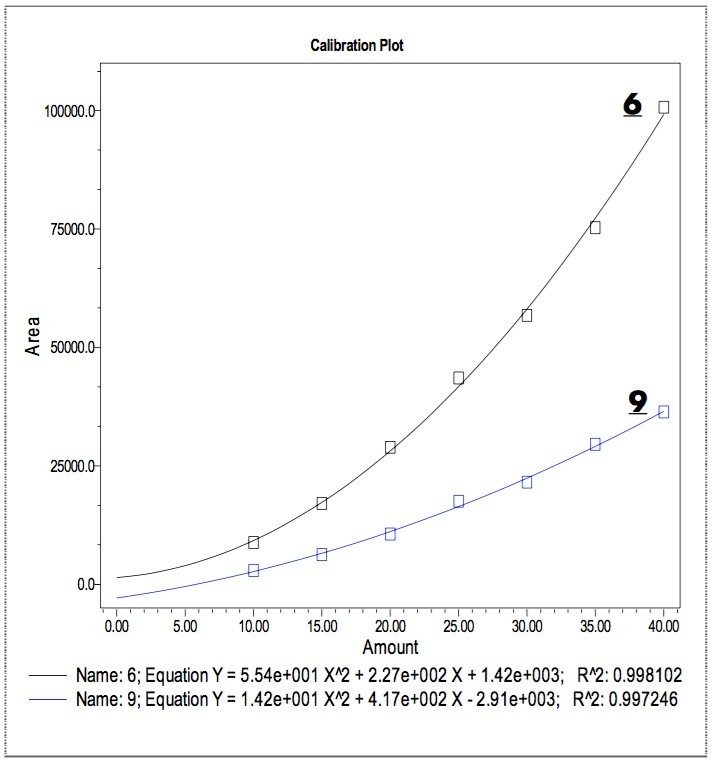
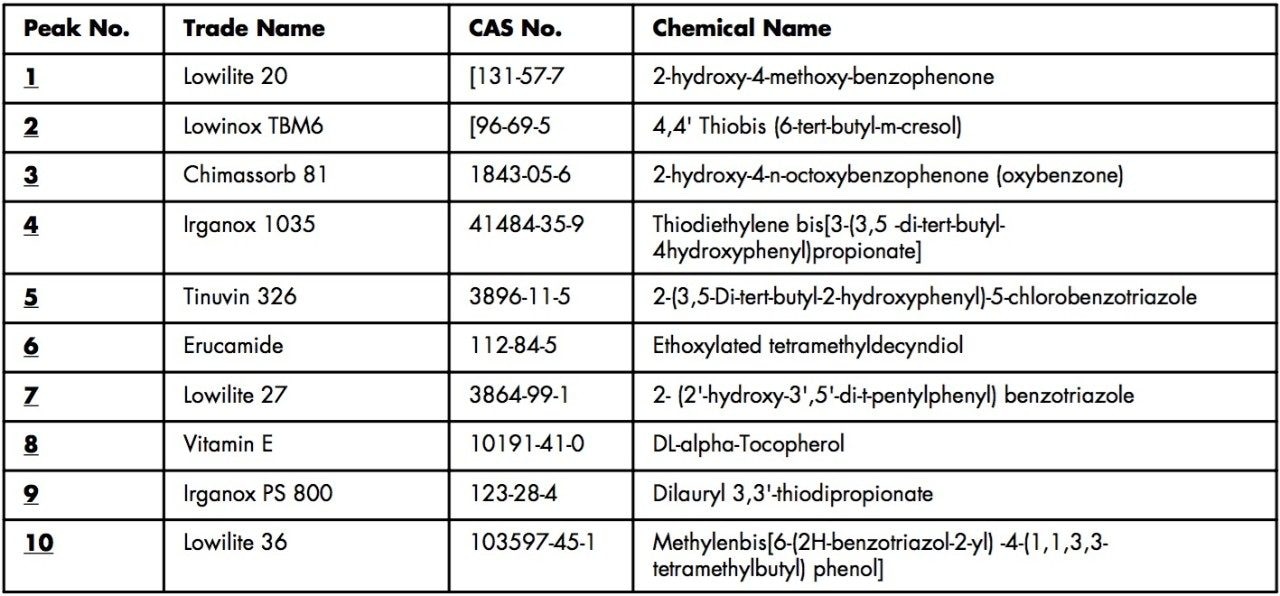
This application note describes a two and a half minute analysis of a blend of 10 polymer additives using the Waters ACQUITY UPLC System with PDA and ELS detection and Waters Empower 2 Software. With the built-in advanced mathematical algorithms, the polymer additives were quantitatively identified in a single run. The analysis is fast and reproducible. The ability to quickly and unambiguously analyze for polymer additives can facilitate workflow in quality control, new product development, deformulation of competitive polymer products, and product troubleshooting in the manufacturing of polymer additives as well as polymer and plastic products.