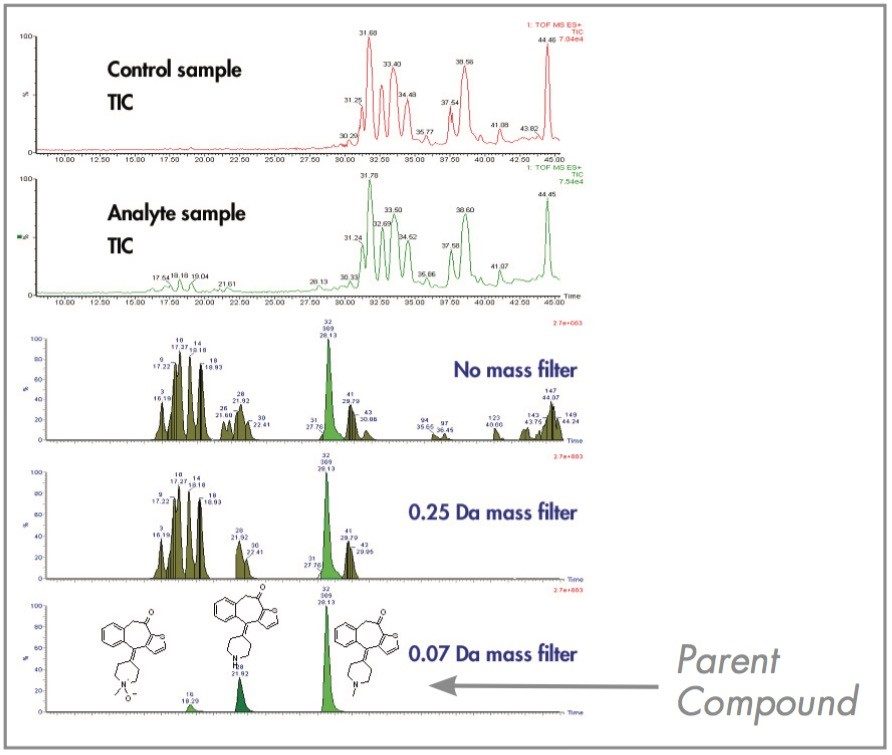
Exact Mass Defect Filter
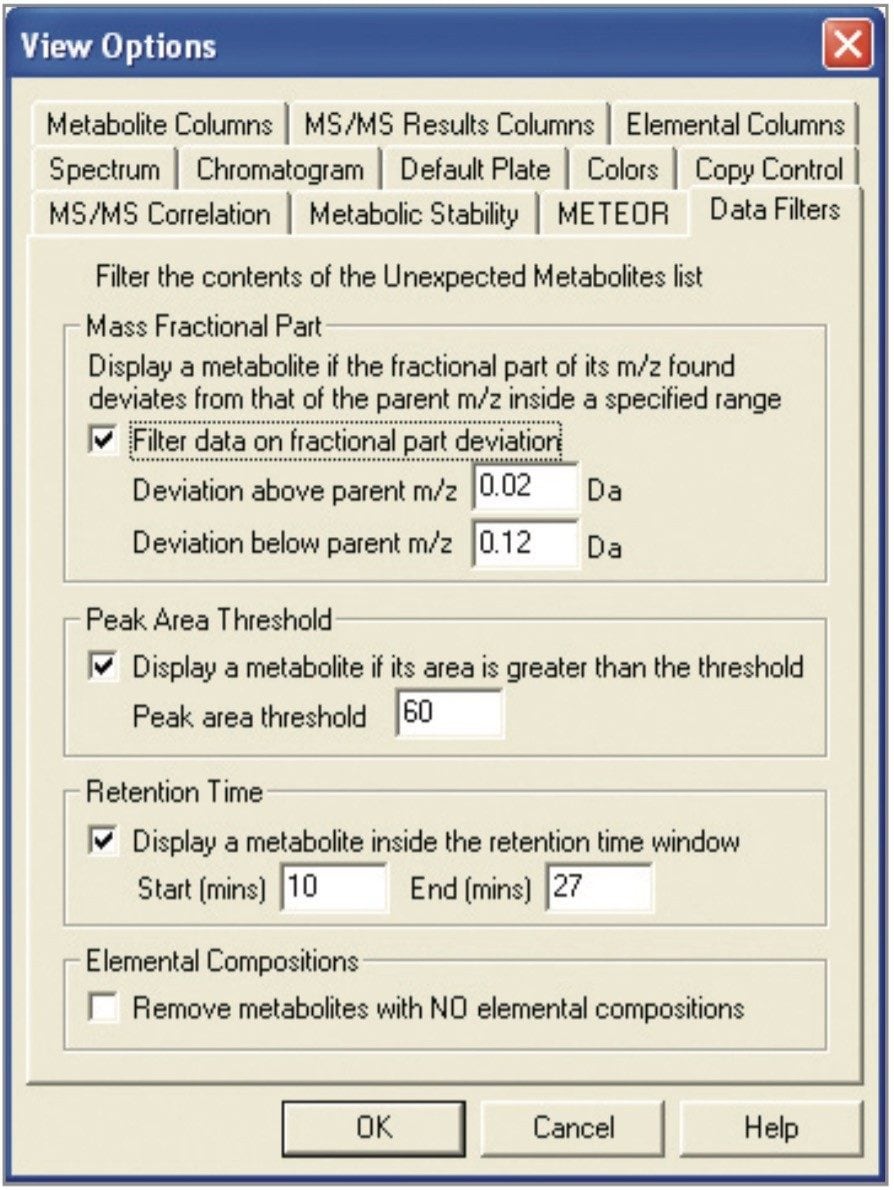
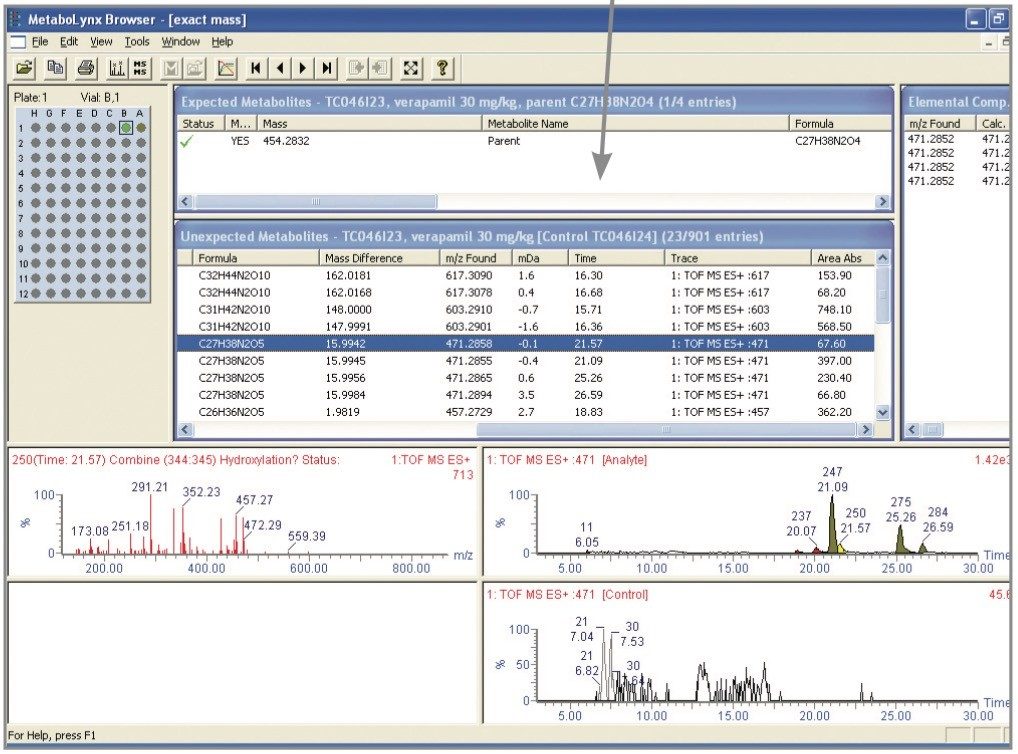
An exact mass defect filter2 based on the decimal places of the m/z value of the parent drug under analysis has been developed. It is a post processing filter that removes unexpected metabolite entries in the MetaboLynx Application Manager browser that do not agree with user-defined criteria. The use of this filter can dramatically reduce the number of false entries in the unexpected metabolite table by filtering out the vast majority of matrix-related entries, which may share the same nominal mass as potential metabolites. This allows users to use low threshold values during data processing so that very low metabolite levels are identified without going through the tedious task of manually excluding false positives. It is a very accurate and specific filter because it is based on exact mass and mass deficiencies, which are specific to each parent drug compound of interest.
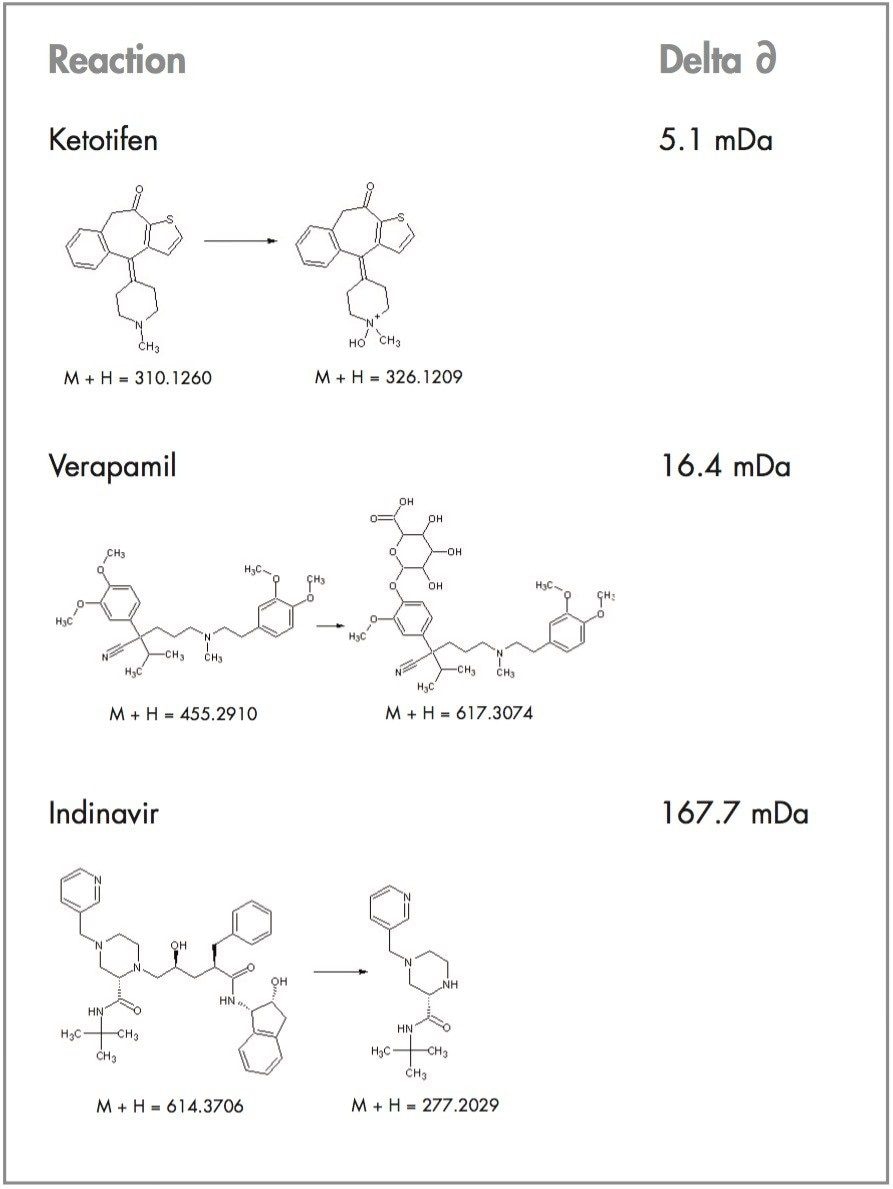
Each parent drug is comprised of a specific number of elements (C, H, N, O etc.). Depending on the number of each element, the m/z value of the drug of interest will have very specific decimal places. For example, verapamil contains the following elements: C27H38N2O4. This equates to a monoisotopic protonated mass of 455.2910 Da (Figure 1). If we take an alkyl group away (N-dealkylation, a common metabolic route) and add a glucuronide, then the mass is shifted by +162.0164 Da which corresponds to a monoisotopic mass of 617.3074 Da. If we now work out the delta mass difference for the 4 decimal places between verapamil and its N-dealkylated metabolite, we are left with an exact mass deficiency of 0.3074 - 0.2910 = 0.0164 Da. Therefore, if we were to look at a window of around 20 mDa we would be able to detect its N-dealkylated glucuronidated metabolite. Previous knowledge of the metabolites of verapamil is not necessary, as we can make the following assumptions:
- All metabolites have masses within 250 mDa of parent decimals
- They are, in general, within 100 mDa if there are no major cleavages leading to much smaller fragments. As an example, the biggest phase II biotransformation, glutathione conjugation, leads to a mass defect difference of 68 mDa compared to the parent drug
- Most metabolites fall within a 180 mDa window of the parent compound, even if cleavages in the structure yield smaller fragments