This application note demonstrates the use of LC-MS platform under compliant-ready software (UNIFI Scientific Information System) for Fc-core fucosylation and aglycosylation confirmation and monitoring their relative levels. Details on sample preparation, LC-MS setup and data processing are discussed in this application note.
Many protein modifications of monoclonal antibody (mAb) products, in addition to their influence on structural heterogeneity, have profound impact on function, efficacy, pharmacokinetic properties, and safety. Such modifications are known as critical quality attributes (CQAs) of the mAb. Quality-by-Design (QbD) principles supported by the US Food and Drug Administration (FDA) mandates a thorough understanding of these CQAs in the early stages of manufacturing. Implementation of QbD requires deployment of monitoring methods to assess the levels of these critical quality attributes at pre and post-development in addition to the QC environment.
Several biopharmaceutical companies have developed mass spectrometry-based methods that confirm and relatively quantify multiple CQAs of mAbs. This approach is commonly referred to as multi-attribute monitoring method (MAM). While some methods use a peptide mapping approach1-2 most recently, mAb subunit level methods have made its way from biopharmaceutical characterization3 to process development and quality control4 as a viable approach that benefit from simple sample preparation and reduced data complexity. Subunit level analysis of mAb modifications has been successfully deployed for process development and optimization as well as QC release testing, and was initially developed on a QTof mass spectrometer platform for rapid LC-MS analysis and monitoring CQAs such as glycosylation and methionine oxidation.5-6
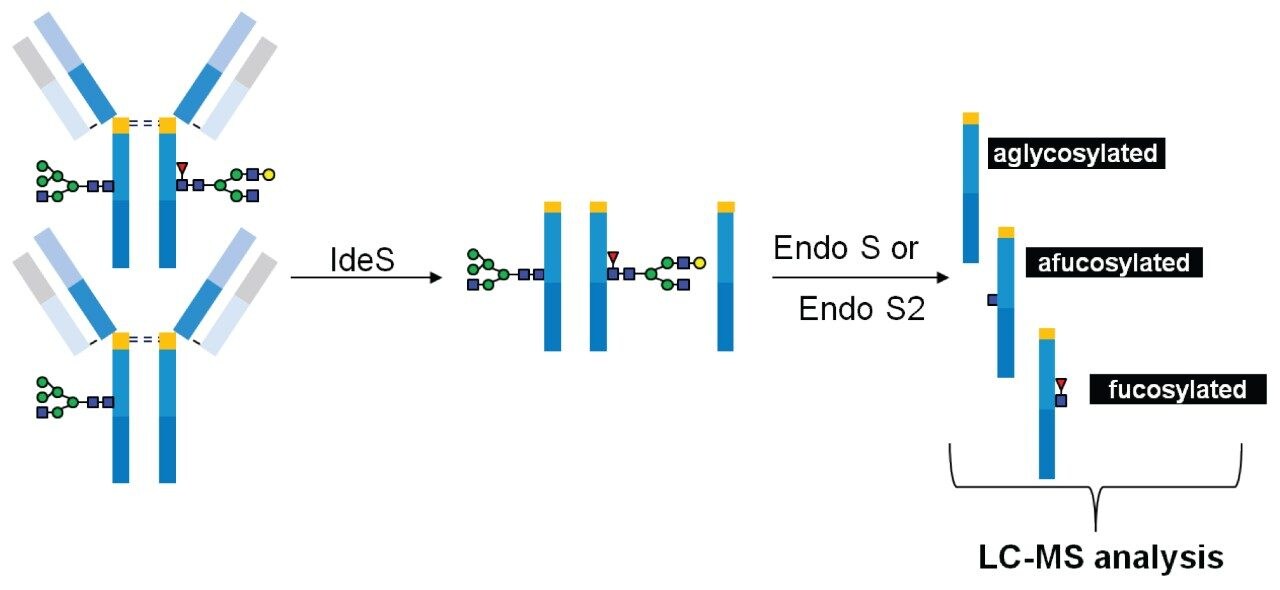
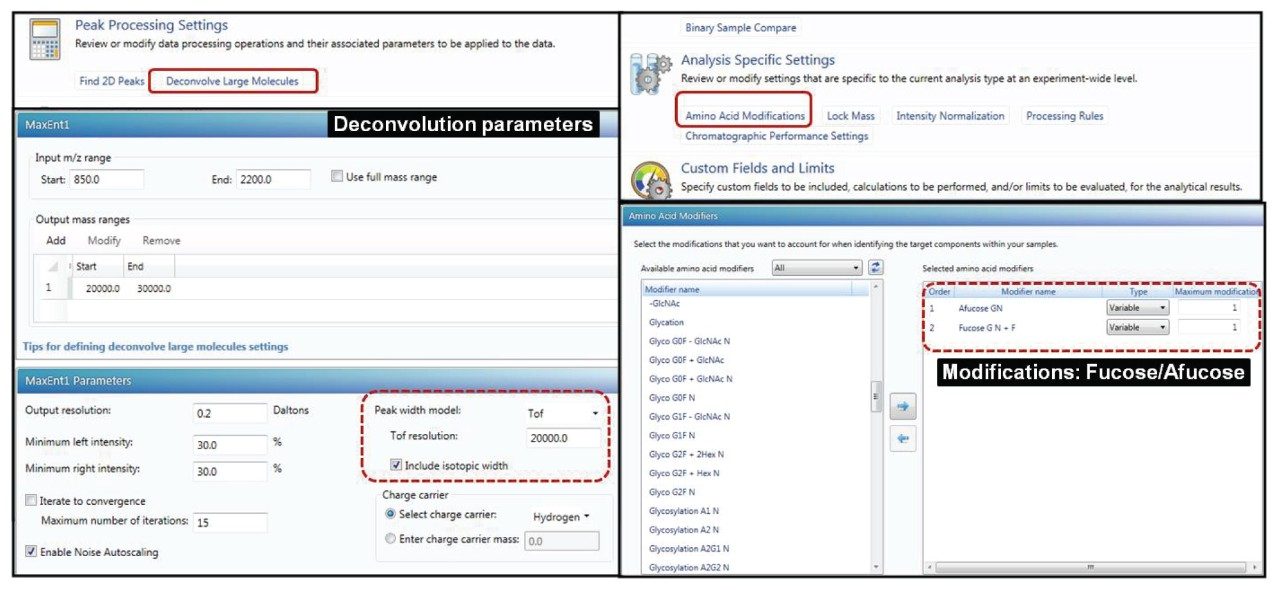
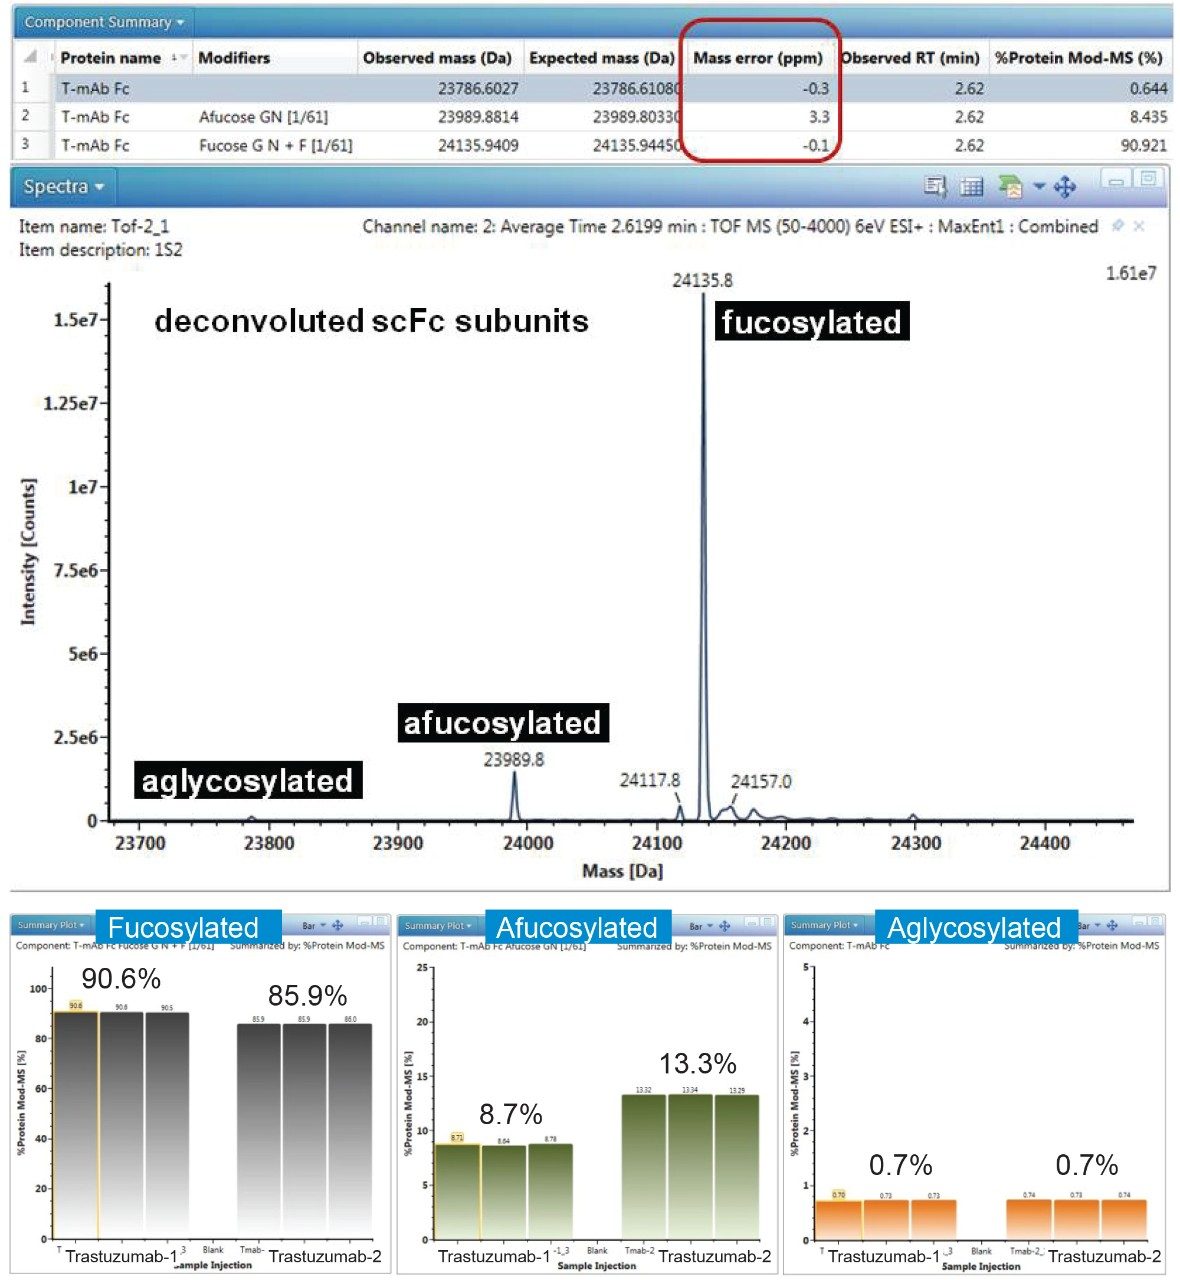
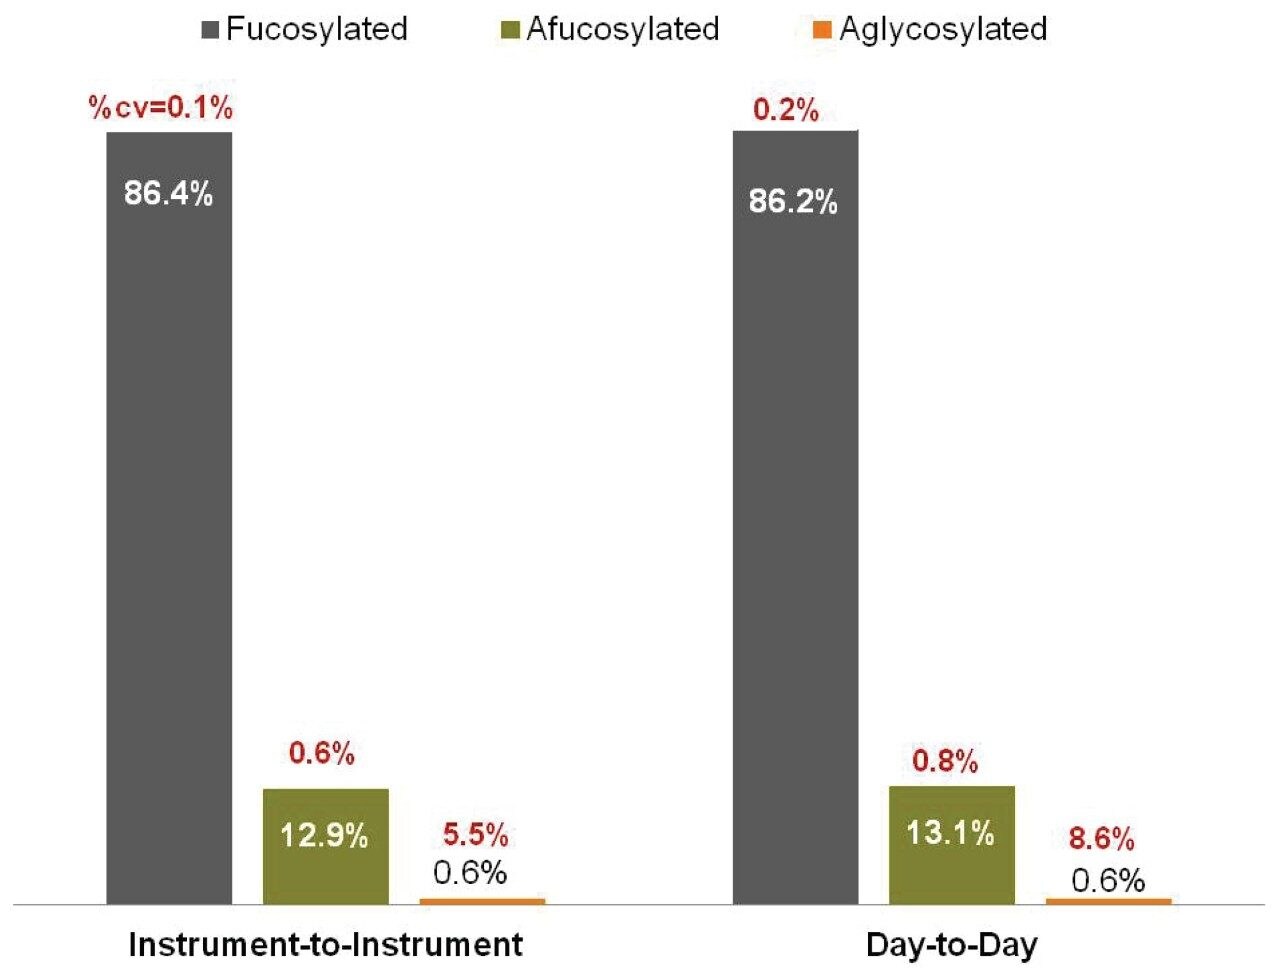
Fucosylation of N-glycan core GlcNAcs affects the potency of the mAb through antibody-dependent cell-mediated cytotoxicity (ADCC),7-8 and is an important CQA to monitor during process development, optimization, product manufacturing, and quality control. Here, we demonstrate the use of a similar LC-MS platform under compliant-ready software (UNIFI Scientific Information System) for Fc-core fucosylation and aglycosylation (Figure 1) confirmation and monitoring their relative levels. Details on sample preparation, LC-MS setup and data processing are discussed in this application note. In addition, we also performed instrument-to-instrument and day-to-day repeatability assessment to demonstrate that this method has the potential to be validated according to ICH guideline Q2R1.
Trastuzumab (samples from two different batches)
An aliquot of formulated trastuzumab (20 mg/mL) was diluted in 25 mM ammonium acetate buffer and digested with FabRICATOR/IdeS (Genovis, Cambridge, MA, USA) and Endoglycosidase (GlycNATOR, Genovis, Cambridge, MA, USA) enzymes (1:1 enzyme to mAb ratio by weight) at 37 °C for 1.5 h. The final concentration of the solution was adjusted using 3% acetonitrile, 0.1% formic acid to 0.01 mg/mL for injection.
The trastuzumab samples were treated with both Endo S (IgGZERO)/IdeS and Endo S2/IdeS separately to determine the level of high mannose structures in the sample using the change in Fc-afucose levels.
Column type: |
BEH C4 (P/N 186004495) |
Column temperature: |
80 °C |
Sample temperature: |
6 °C |
Wavelength: |
280 nm |
Time (min) |
Flow rate (mL/min) |
0.1% FA in H2O (%) |
0.1% FA in ACN (%) |
---|---|---|---|
Initial |
0.40 |
95.0 |
5.0 |
1.00 |
0.40 |
95.0 |
5.0 |
1.10 |
0.40 |
74.0 |
26.0 |
3.00 |
0.40 |
70.0 |
30.0 |
3.10 |
0.40 |
5.0 |
95.0 |
4.00 |
0.40 |
5.0 |
95.0 |
4.10 |
0.40 |
95.0 |
5.0 |
8.00 |
0.40 |
95.0 |
5.0 |
MS system: |
Vion IMS QTof |
Mass range: |
m/z 500–4000 Da |
Data acquisition: |
ESI positive sensitivity mode |
Capillary voltage: |
2.75 kV |
Cone voltage: |
70 V |
Source offset: |
80 V |
Source temperature: |
125 °C |
Desolvation temp.: |
600 °C |
Desolvation gas low: |
600 L/h |
Lock mass: |
Glu-Fibrinopeptide B (P/N 700004729) at 320 fmol/μL in 50/50 H2O/ACN, 0.1% FA |
UNIFI Scientific Information System 1.8.2
Vion IMS QTof with Driver pack 2.0
The UNIFI intact protein workflow method was used in core fucosylation analysis of trastuzumab subunits. The total ion chromatogram peaks for selected retention times were integrated and the full charge distribution of the summed spectrum was used in MaxEnt1 deconvolution (Figure 2). Custom field formulas for protein modification quantification in UNIFI were used for fucosylation% and aglycosylation% determination. Relative abundance of each modification was calculated as a percentile of total MS response for afucose, fucose, and aglycosylated scFc.
The MS response-based core Fc-fucosylation assessment of the subunit components provides a simple, direct analysis method compared to peptide mapping and released glycan analyses. Enzymatic digestion of trastuzumab with Endo S2 cleaves the β, 1-4 glycosidic bond between the two core N-acetylglucosamines (GlcNAcs) leaving scFc with one GlcNAc ± an α, 1-6-fucose attached. This simplifies the glycosylated scFc into two basic components: afucosylated scFc (+1 GlcNAc) and fucosylated scFc (+1 GlcNAc +1 Fucose) in addition to the aglycosylated scFc form. These scFc subunit components eluted in one peak during UPLC separation (Figure 3). BEH C4 Column was used with a 3.0 min LC-gradient for the LC-MS analysis. The scFc peak eluted at 2.6 minutes.
For the LC-MS analysis, 0.1 µg (on-column) of digested trastuzumab from two different batches (Trastuzumab-1 and Trastuzumab-2) was used and MS spectra for both samples were processed using UNIFI processing parameters given in Figure 2. Figure 4 shows the deconvoluted mass spectrum for Trastuzumab-1 containing aglycosylated, afucosylated and fucosylated scFc subunits with a mass accuracy of less than 5 ppm. The relative abundance of each modification was determined based on the total MS response for these peaks. The UNIFI software platform has the ability to calculate and present the data in a user selected format such as a bar graph that can be easily incorporated into the final report (Figure 4). As shown in the bar graphs in Figure 4 the two samples contain equal amounts of aglycosylated scFc form, while Trastuzumab-2 has the highest MS response for afucosylation.
Analytical assays implemented in regulated cGMP environment require validation for repeatability to establish its stability as described in ICH guidelines. Pharmaceutical companies interested in incorporating mass spectrometry into their CQA monitoring/validation methods for mass confirmation of protein modifications have initiated evaluating the MS system-to-system reproducibility. To demonstrate the above criterion, we measured the RSD% for scFc subunits analyzed on two QTof MS systems to determine our MS system’s suitability. Figure 5 shows the RSD% for fucose%, afucose%, and aglycosylated scFC% at 0.12%, 0.56%, and 5.51% respectively. Both Vion systems (QTof-1 and QTof-2) produced consistent results (Figure 5) for the most abundant and the least abundant protein modification% levels. The %RSD calclated for six replicates of trastuzumab completed on both instruments reported less than 10% RSD.
Similarly, we investigated the repeatability of the assay over time, and replicated the assay over a period of four weeks using one of the QTof MS systems. The RSD% for samples analyzed four weeks apart in triplicate injections also reported less than 10% RSD for all scFc subunit modifications indicating a high robustness of instrumentation and repeatability of the assay.
Endo S cleaves the β, 1-4 bond between core GlcNAc’s of N-glycan structures except that of high mannoses and hybrid glycans whereas Endo S2 also removes the high mannoses and hybrid glycans. The difference in afucose levels when digested with Endo S2 compared to Endo S provides the content of these structures in the mAb sample. If the UNIFI workflow analysis contains these two types of samples in one sample list, the difference can be viewed under maximum and minimum afucose of the “result summary” (Figure 6). The maximum shows the total afucosylation level in Endo S2 digested sample and the minimum in Endo S digested sample. The total amount of high mannose and hybrid glycan structures can be automatically calculated using the given maximum and minimum afucosylation levels by UNIFI custom calculations.
As previously demonstrated, automated reporting capabilities in UNIFI provide the option to generate customizable reporting formats according to user requirements.9 The UNIFI report shown here includes the summary tables and plots of the processed data that can be easily adopted into a late stage mAb characterization or QC protocol (Figure 7).
MAM workflow: Versatile built-in workflows that can be used for protein characterization and subunit level MAM deployment.
720006166, December 2017