For forensic toxicology use only.
The analysis of natural and synthetic opioid drugs continues to be an important aspect of forensic toxicology. The method presented here demonstrates the advantages of mixedmode μElution SPE combined with UPLC-MS/MS for the analysis of 26 opioid compounds and metabolites of interest.
The analysis of natural and synthetic opioid drugs continues to be an important aspect of forensic toxicology. In the past, analyses were typically conducted by GC/MS after first subjecting the samples to acid or enzymatic hydrolysis to liberate glucuronide metabolites.1 With the advent of LC/MS/MS techniques, glucuronide metabolites can now be analyzed directly.2-5 Direct analyses of glucuronide metabolites can eliminate the risk of false negatives due to incomplete hydrolysis, as enzymatic efficiency can vary greatly depending upon the enzyme used and the drug substrate analyzed.6
Urine samples, unlike some other matrices, can be analyzed by “dilute and shoot” methods in which samples are diluted with an internal standard mix and directly injected onto an LC-MS/MS system.2,4 Disadvantages to this type of technique, however, include the fact that urine contains many matrix components that can interfere with MS signals. In addition, this technique does not allow for any sample concentration. This can potentially affect the quantification of some of the glucuronide metabolites that elute under high aqueous conditions, where desolvation efficiency is reduced, as well as many of the opioid drugs, since many of them do not produce intense MS/MS product fragments.
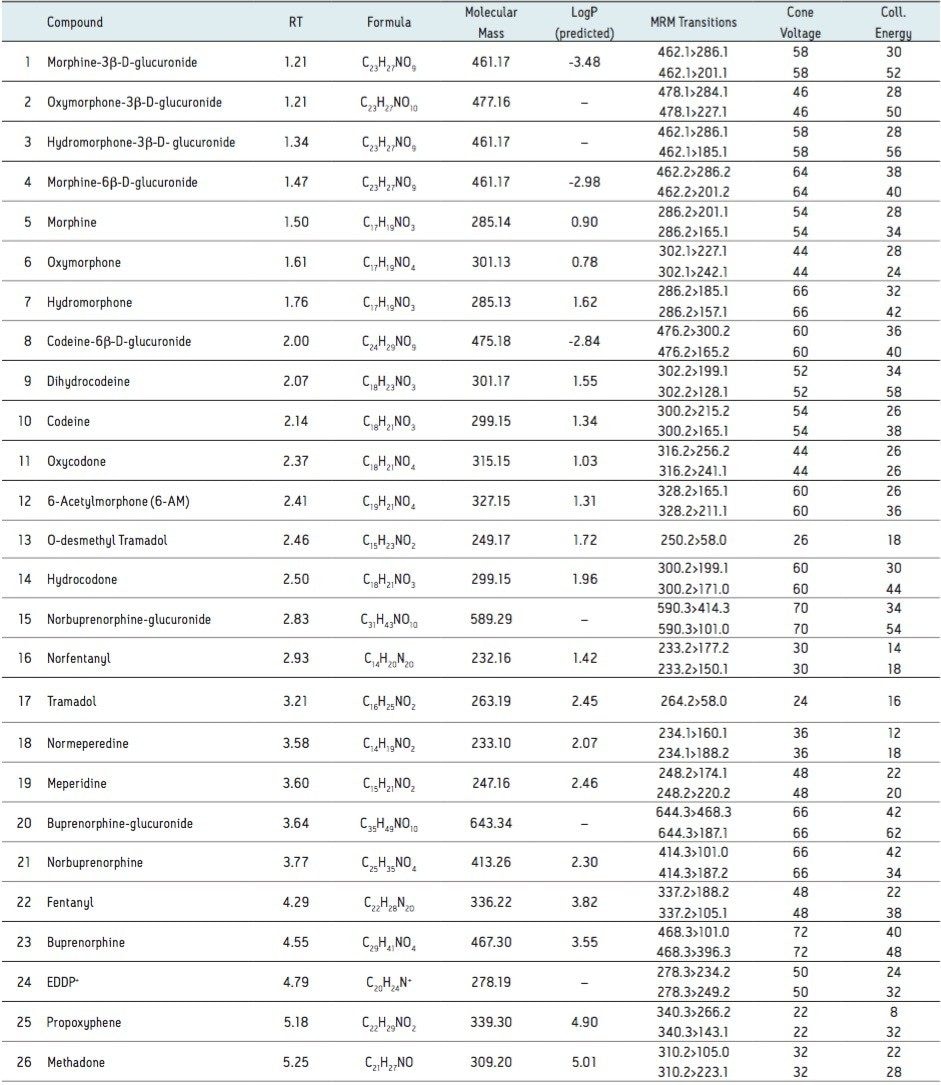
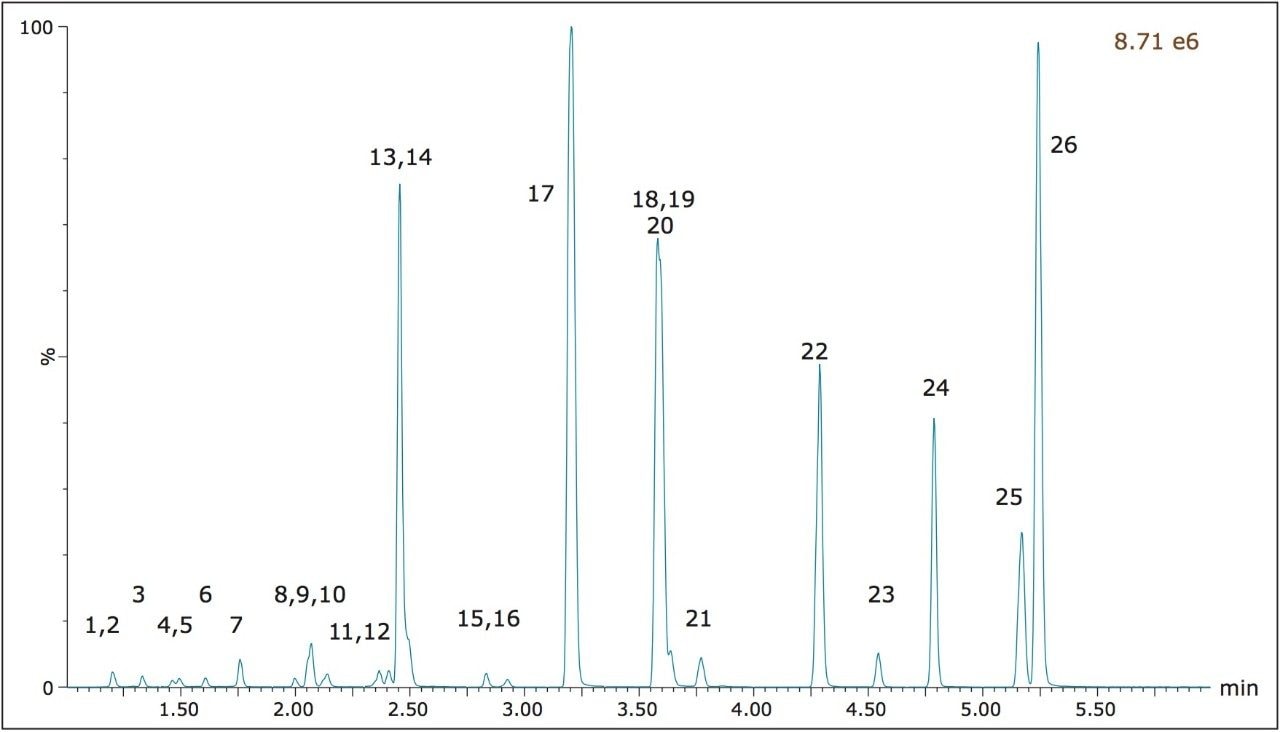
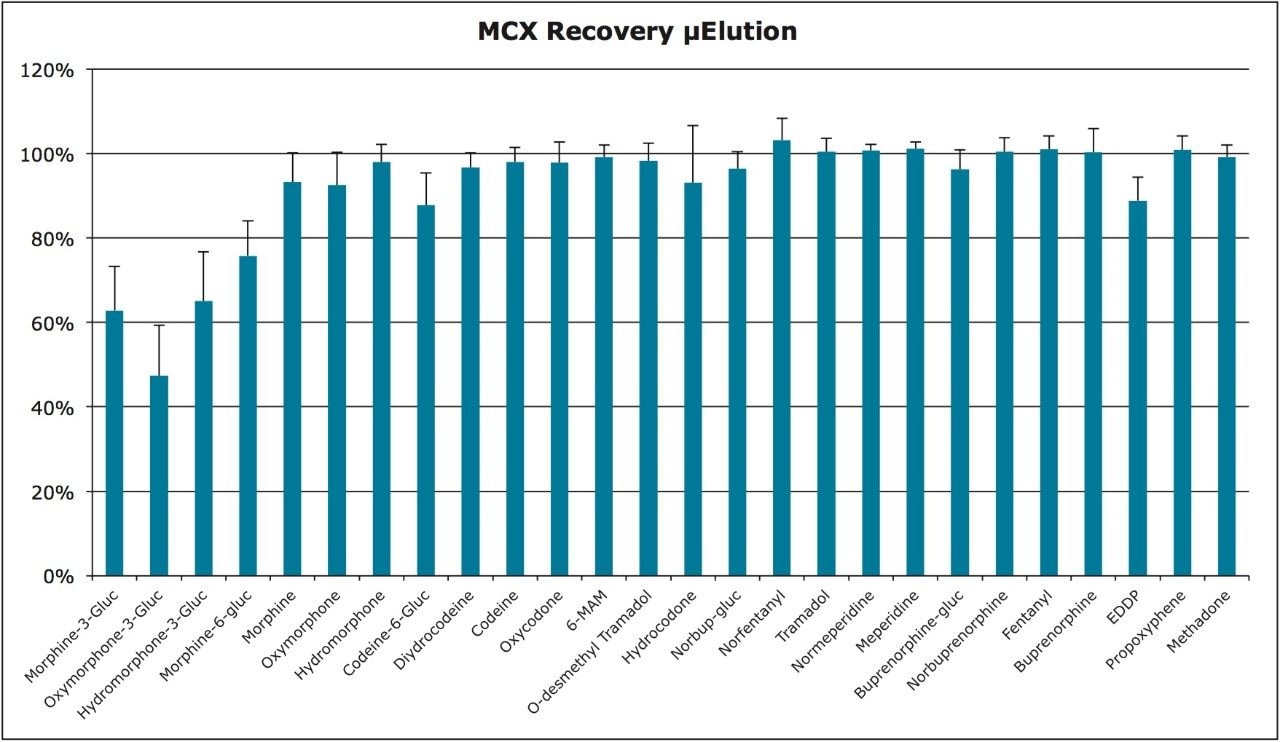
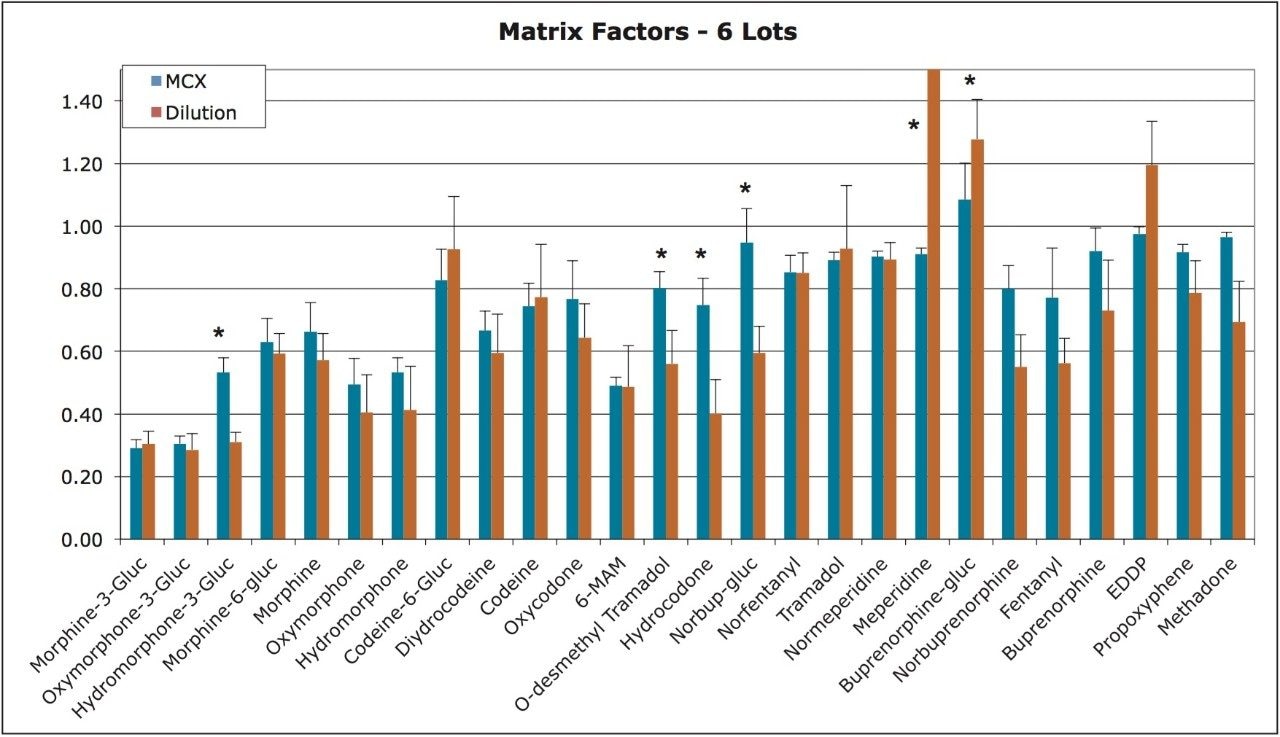
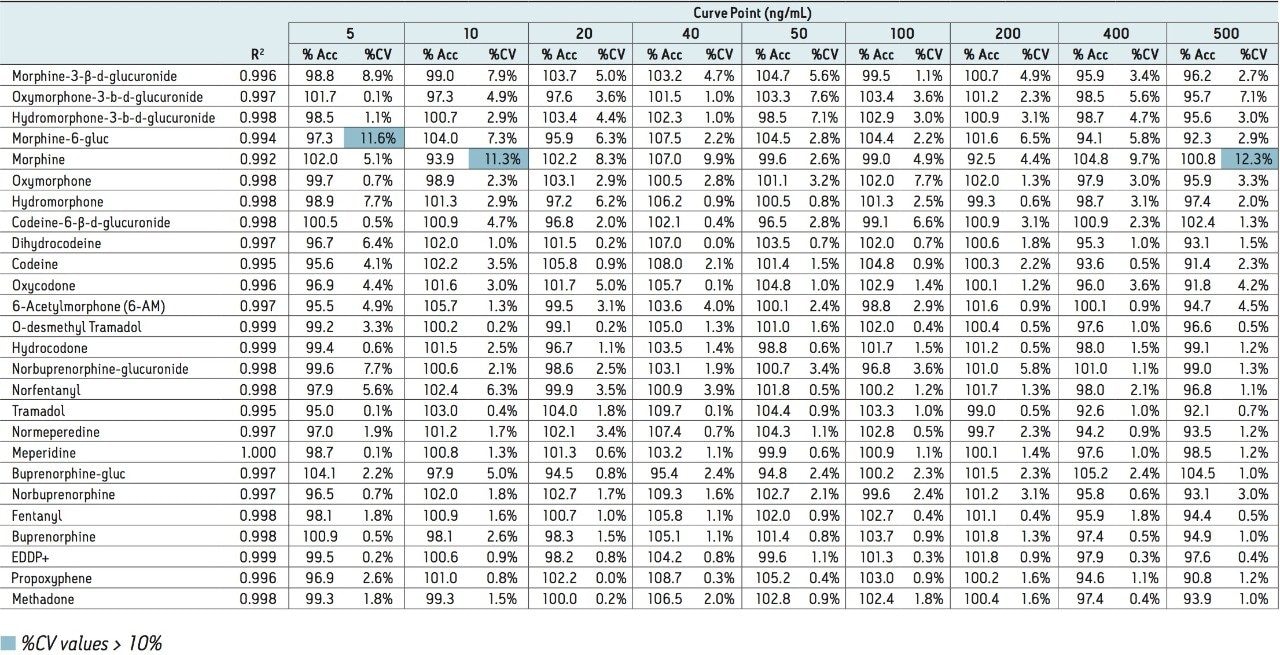
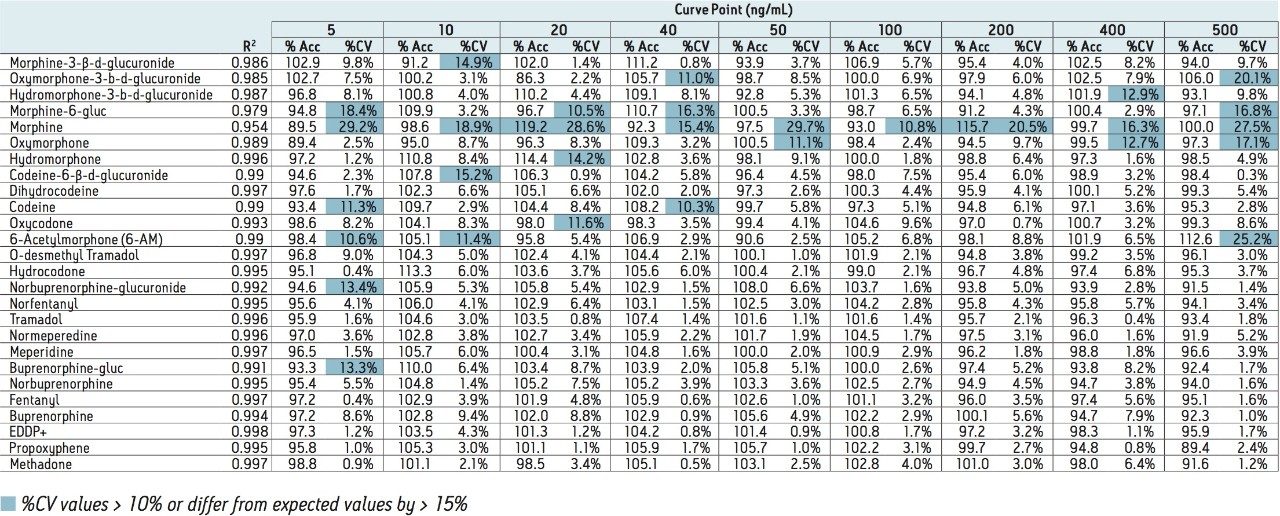
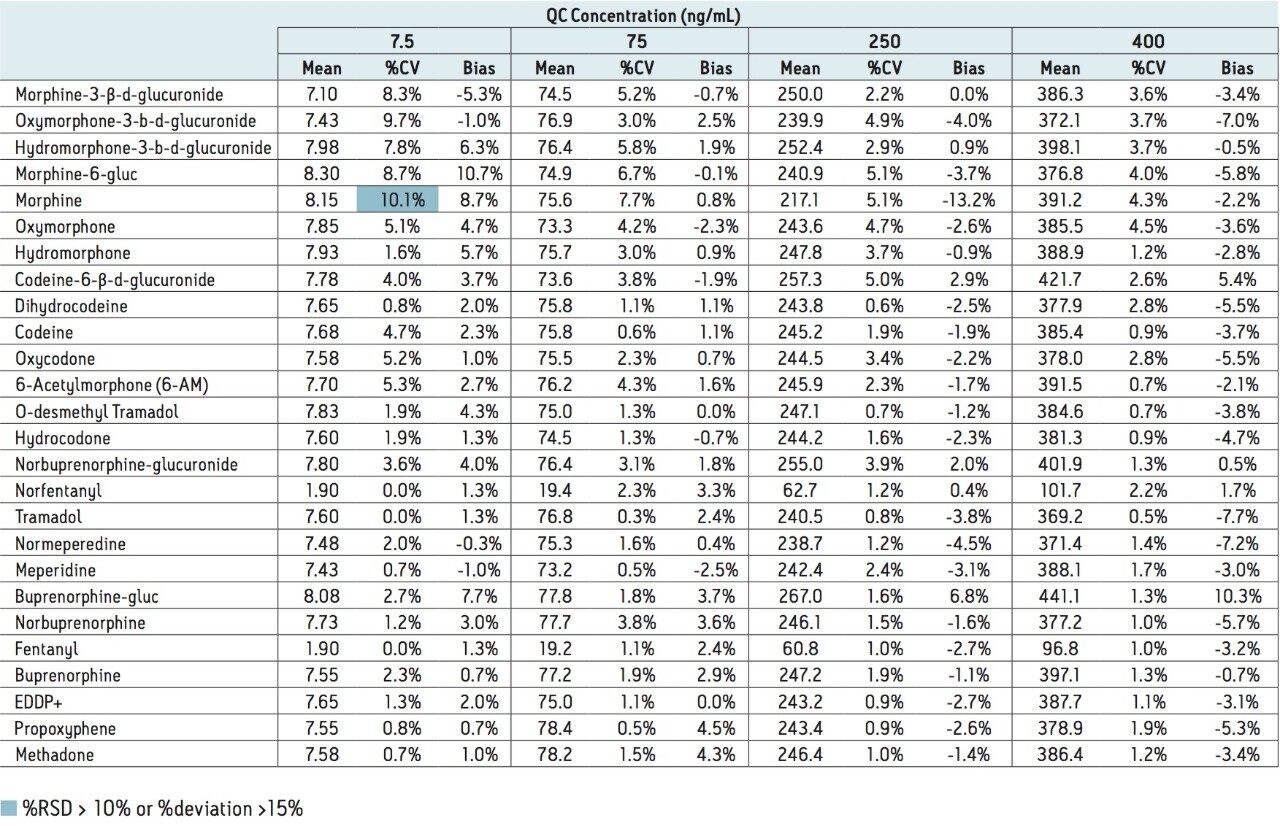
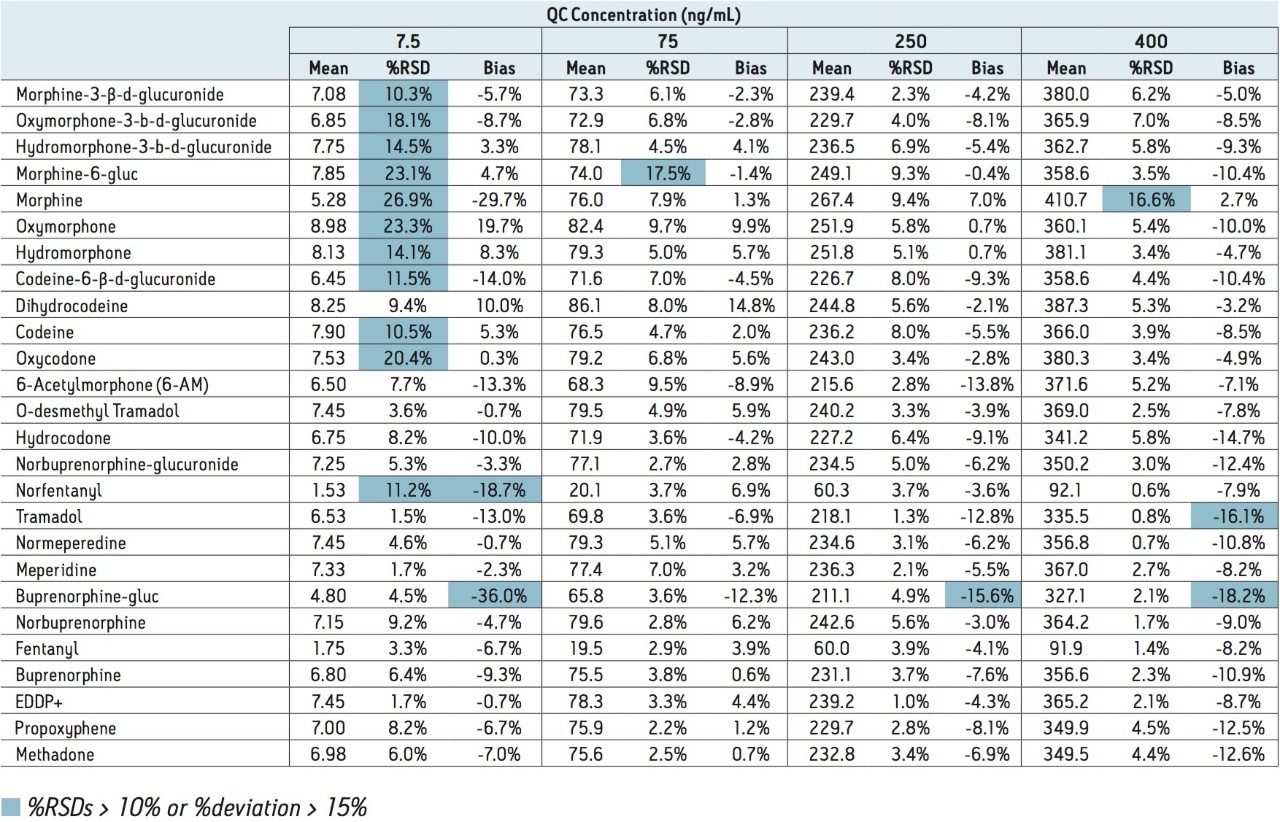
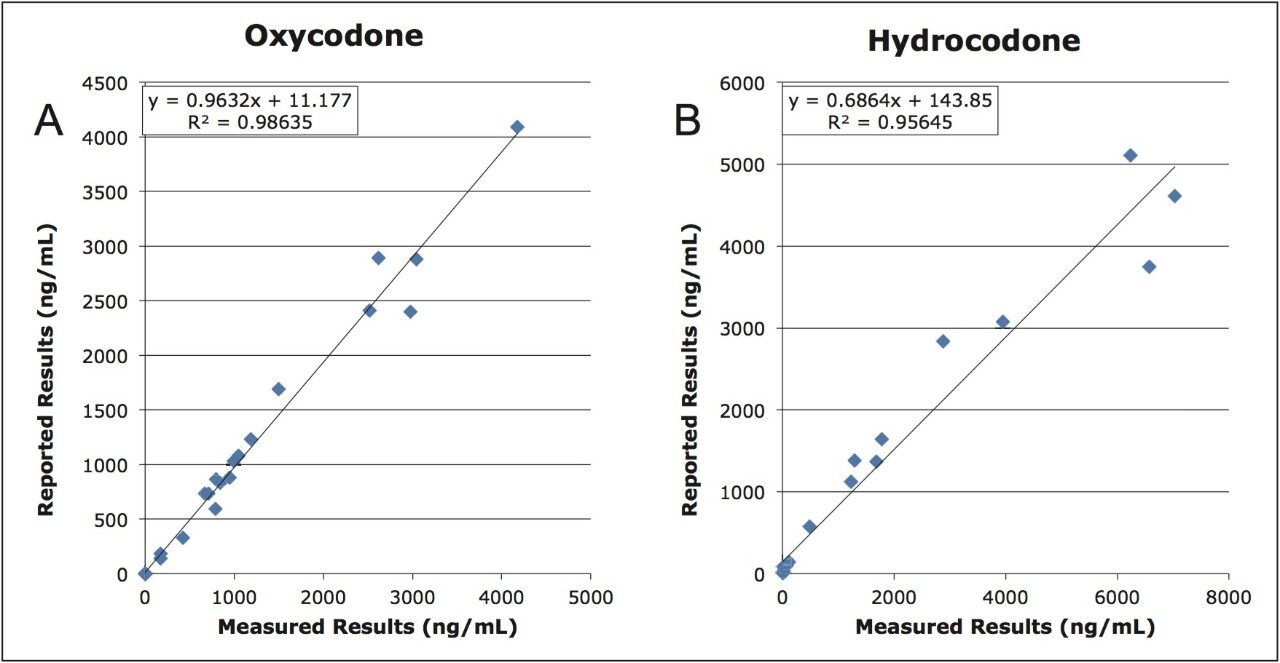
This application note highlights a method for the analysis of 26 opioid drugs and metabolites by mixed-mode SPE followed by UPLC-MS/MS. Glucuronide metabolites are directly analyzed, eliminating the need for enzymatic or chemical hydrolysis. Direct comparison demonstrates that mixed-mode SPE has improved linearity, greater accuracy and precision, and fewer matrix effects than a simple dilute and shoot method. Previously confirmed, incurred samples were also analyzed, allowing for additional evaluation of this method.
LC system: |
ACQUITY UPLC |
Column: |
BEH C18, 2.1 x 100 mm, 1.7 μm |
Column temp.: |
30 °C |
Injection volume: |
10 μL |
Flow rate: |
0.4 mL/min |
Mobile phase A: |
0.1% formic acid in MilliQ water |
Mobile phase B: |
0.1% formic acid in ACN |
Gradient: |
Initial conditions were2% B. The %B was increased to 52.8% over 6.0 min and then returned to 2% over 0.5 min.The system was allowed to reequilibrate for 1.5 min. The entire cycle time was 8.0 min. |
MS system: |
Xevo TQD Mass Spectrometer |
Ionization mode: |
ESI+ |
Acquisition mode: |
MRM (See Table 1 for transitions) |
Capillary voltage: |
1 kV |
Collision energy (eV): |
Optimized for individual compounds (See Table 1) |
Cone voltage (V): |
Optimized for individual compounds (See Table 1) |
Data Management: |
All data were acquired and analyzed using MassLynx Software v.4.1 |
All compounds and internal standards (IS) were purchased from Cerilliant (Round Rock, TX). Complementary, deuterated internal standards were used for all compounds with the exception of hydromorphone-3-glucuronide, codeine-6 glucuronide, norbuprenorphine-glucuronide, norfentanyl, and buprenorphine glucuronide. For these compounds, a deuterated IS with the most similar response was chosen as a surrogate.
A combined stock solution of all compounds (10 μg/mL; 2.5 μg/mL for fentanyl and norfentanyl) was prepared in methanol. Working solutions were made daily by preparing high standards and QCs in matrix (urine) and performing serial dilutions to achieve the desired concentrations. Calibrator concentrations ranged from 5 to 500 ng/mL for all analytes with the exception of fentanyl and norfentanyl, which were prepared at 25% of the concentration of the other analytes (1.25 to 125 ng/mL). A combined internal standard stock solution (5 μg/mL; 1.25 μg/mL for fentanyl and norfentanyl) was prepared in methanol. Working IS solutions were prepared daily in MilliQ water at 50 ng/mL.
Sample preparation consisted of either simple dilution or mixed-mode SPE. For the dilution method, 100 μL of urine was diluted 1:1 with MilliQ water containing internal standards. The samples were vortexed and then loaded into individual wells in the collection plate. For mixed-mode SPE, urine samples (method blanks, standards, QCs and unknowns) were pretreated by adding equal amounts of 4% H3PO4 and a working IS mixture (50 ng/mL) prepared in MilliQ water. Wells in the Oasis MCX μElution 96-well plate (p/n 186001830BA) were conditioned with 200 μL MeOH followed by 200 μL MilliQ water. 300 μL of each prepared sample was then added to each well, resulting in a sample load of 100 μL urine. After loading, the wells were washed with another 200 μL water followed by 200 μL MeOH. All samples were then eluted with 2 x 50 μL of 60:40 MeOH/ACN containing 5% of a concentrated NH4OH solution (Fisher, 20-22%). After elution, all samples were evaporated under N2 to dryness (approximately 5 min) and reconstituted with a solution of 98:2 water/ACN containing 0.1% formic acid and 0.1% human plasma. 10 μL was injected onto the LC-MS/MS system.
The 26 compounds and metabolites screened are listed in Table 1 and constitute a comprehensive panel of natural opiate drugs, semi-synthetic opioids, and synthetic narcotic analgesic compounds. Most all of the compounds are weak bases, with pKa values of approximately 8 to 9. They have a wide range of polarities, with LogP values ranging from -3.48 for morphine-3β-d-glucuronide to 5.00 for methadone, as shown in Table 1; MRM transitions used are also listed there.
During the initial chromatographic method development, two types of acidic additives (buffers) were evaluated. One was 0.1% formic acid and the second was a combination of 2 mM ammonium acetate with 0.1% formic acid, a mobile phase similar to one used in a related application.7 No substantial differences in chromatography were seen. However, the analytical sensitivity of several compounds was significantly suppressed when using the combination of ammonium acetate and formic acid. The peak area of all of the glucuronide metabolites and norbuprenorphine were reduced by 60% to 80% compared to those seen with formic acid alone. Thus, the remaining experiments were conducted with the mobile phases containing 0.1% formic acid alone. A representative chromatogram of all compounds from a 50 ng/mL calibration standard is shown in Figure 1. Peak assignments can be found in Table 1. Using an ACQUITY UPLC BEH C18, 2.1 x 100 mm, 1.7 μm Column we were able to analyze all analytes in under 5.5 min with baseline separation between all critical pairs of isomers, such as between morphine-3-glucuronide, morphine-6-glucuronide, and hydromorphone-3-glucuronide (compounds 1, 3, and 4, respectively) and near baseline separation between morphine-6-glucuronide and morphine.
Both mixed-mode SPE and simple dilution were evaluated as possible sample preparation methods. Sample dilution has the advantages of being very simple, inexpensive, and, in the case of urine samples, compatible with reversed-phase chromatographic conditions. Disadvantages include reduced analytical sensitivity resulting from sample dilution and potential interference from matrix components remaining in the sample. SPE, on the other hand, can reduce potential matrix effects because of its selective nature. In addition, the ability of SPE to concentrate the sample can help improve analytical sensitivity of the assay. For this application, evaporation of the organic eluate and reconstitution in a high aqueous solution (2% ACN) was necessary to prevent solvent effects that otherwise interfered with the chromatography of the glucuronide metabolites. Figure 2 shows the average recovery of all compounds from six different lots of urine using the Oasis MCX μElution protocol detailed above. With the exception of the four earliest eluting glucuronide metabolites, all compounds demonstrated recoveries of 89% or greater. In addition, when peak areas from extracted 50 ng/mL samples were compared, the areas for the Oasis MCX μElution protocol ranged from 2.1 to more than six times greater than the dilution protocol. Thus, the ability to concentrate the samples more than made up for the limited recovery seen for a few analytes.
In addition to recovery, matrix factors were evaluated for both protocols. Matrix factors were caclulated according to the following equation:
Matrix Factor (MF) = (peak area in the presence of matrix)/(peak area in the absence of matrix)
In the case of SPE, blank urine was subjected to the extraction protocol, and standards (dissolved in methanol) were added to the final eluate. For the solvent standard, the same methanolic standard solution was combined with 50 μL of the elution solution. Both groups of samples were then evaporated and reconstituted as previously described. For dilution samples, diluted urine samples spiked with drug standards were compared to samples consisting of the reconstitution solution spiked with drug standards.
Figure 3 shows the results of the matrix factor experiments conducted with six different lots of urine. While both protocols show the trend toward suppression of the earlier eluting compounds, statistical analysis reveals that nearly half of the compounds (12 of 26) demonstrated significantly less matrix interference when the Oasis MCX μElution protocol was used. The asterisks in the figure indicate those compounds in which matrix factors were significantly different between the two protocols. In every case in which a significant difference was observed, mixed-mode SPE resulted in matrix factors closer to the ideal value of 1 (no matrix effect). In addition, matrix factors were more consistent when using the mixed-mode SPE protocol. With the exception of oxymorphone (17.0%), oxycodone (15.9%), and fentanyl (20.6%), all compounds in the SPE prepared samples had coefficients of variation (CVs) of less than 15.0%. By contrast, only 12 of the compounds prepared by sample dilution had CVs less than 15.0%. Thus, the use of mixed-mode SPE resulted in not only reduced matrix effects, but also resulted in less variability among different lots of urine.
The two sample preparation protocols were also evaluated for linearity and accuracy. Calibration standards were prepared in urine at concentrations ranging from 5 to 500 ng/mL (1.25 to 125 ng/mL for fentanyl and norfentanyl). Quality control samples (N=4) were prepared at four concentrations: 7.5, 75, 250 and 400 ng/mL. These samples were then prepared by either mixed-mode SPE or sample dilution. The mean accuracies and R2 values for the calibration curves are shown in Tables 2 and 3. For the SPE prepared samples, the means of all calibration points were within 10% of their expected values. The American Association of Clinical Chemistry (AACC) suggests that %CVs be less than 10%, a criterion which is met by all points with the exception of morphine at 10 and 500 ng/mL and morphine-6-glucuronide at 5 ng/mL. All compounds show excellent linearity, with R2 values of 0.992 or greater.
Table 3 summarizes calibration data for the samples prepared by dilution. Despite good linearity and accuracy for most compounds, it is clearly evident that a greater number of calibration points exceed the recommended %CV of 10%. Morphine, in particular, shows unacceptable precision throughout the calibration range.
AACC requirements for LLOQs also require that %CVs be under 10%. For the SPE prepared samples, only morphine-6-glucuronide at 5 ng/mL misses this requirement, while six compounds in the dilution prepared samples fail to meet this requirement at the 5 ng/mL level.
A similar pattern seen in the calibration curves is observed when looking at quality control results for both methods. Table 4 reveals that, with the exception of morphine at 7.5 ng/mL, %CVs for all compounds prepared by mixed-mode SPE fall within the suggested precision requirements of < 10% at all four QC concentrations. With very few exceptions, nearly all accuracy and precision values are less than 10%. In addition, only three QC points show a deviation from expected values of more than 10% and all are within 15%. By contrast, the results for samples prepared by the dilution protocol show that many compounds fail precision (%RSD) requirements, especially at the lower concentration of 7.5 ng/mL, as shown in Table 5, and many values deviate from their expected concentrations by more than 15%, especially at the low QC concentration.
In order to test this method in a real-world context, 32 urine samples (two negative, 30 positive) previously confirmed for opiate compounds were obtained and analyzed by the current method. These samples had been analyzed for 6-MAM (heroin metabolite), codeine, hydrocodone, hydromorphone, morphine, oxycodone, and oxymorphone. Among the differences in analysis was the fact that these samples had been hydrolyzed to release the conjugated metabolites from the glucuronide moieties. Figure 4 compares the results obtained from the current method to those reported from the laboratory that provided the samples for oxycodone and hydrocodone. These two compounds both lack hydroxyl groups at positions three and six. This renders them incapable of undergoing phase two glucuronidation,6,8 eliminating any discrepancies in the data due to incomplete hydrolysis. These two figures show fairly good correlation when comparing the two methods, with R2 values of 0.956 and 0.985 for hydrocodone and oxycodone, respectively. With a slope of near 1 (m=0.962), the oxycodone results between the two methods are in good agreement. For hydrocodone, there is a bias towards higher concentrations in the method presented here (m=0.689). This could be due to the influence of two highly concentrated samples with measured concentrations of 6574 and 7032 ng/mL by the current method that had previously reported results of 3750 and 4610 ng/mL, respectively. For the current analysis, these samples were diluted to concentrations within the reported linear range of 5 to 500 ng/mL. It is unknown if the previously reported results represented samples that had been properly diluted or not.
A significant difference was seen when the samples were analyzed for compounds such as morphine, oxymorphone, and hydromorphone that undergo significant glucuronidation prior to excretion. Many methods used to analyze opioid drugs rely on enzymatic hydrolysis. However, the degree of hydrolysis is greatly dependent upon not only the β-glucuronidase enzyme used (ex: Patella vulgate, Helix pomata, Escherichia coli), but also on the substrate (morphine-6-gluc vs. morphine-3-gluc, morphine-3-gluc vs. hydromorphone-3- gluc).6 Analysis of the same group of samples by the current and previously reported methods revealed that the reliance on enzymatic hydrolysis dramatically underestimates the total amount of glucuronidated metabolites. Regression analysis of reported released oxymorphone and hydromorphone vs. the actual measured totals of each compound using the current method (glucuronide conjugate + free drug) yielded slopes of 0.20 and 0.25, respectively, indicating that 75% to 80% of the drug was not hydrolyzed. Analysis with this current method reveals that > 85% of total oxymorphone and hydromorphone exist as glucuronide conjugates. Thus, any inefficiencies in glucuronide hydrolysis could result in significant underestimation of total compound concentration. The current method, obviously, is not subject to this limitation, since glucuronide metabolites are measured directly.
The method presented here demonstrates the advantages of mixedmode μElution SPE combined with UPLC-MS/MS for the analysis of 26 opioid compounds and metabolites of interest. All compounds were analyzed in under 5.5 min with complete resolution of all isobaric compound pairs. The use of Oasis MCX μElution Plates resulted in improved linearity, and significantly reduced matrix effects compared to a simple dilution method. Accuracy and precision for quality control samples and calibration standards were also improved using mixed-mode SPE. The ability to achieve LOQs of 5 ng/mL for nearly all analytes and the ability to measure glucuronide metabolites directly without hydrolysis make this method well suited for the analysis of these compounds.
720004650, October 2014