Many analytical techniques are used by the polymer industry, for example gel permeation chromatography (GPC) with refractive index (RI) detection and nuclear magnetic resonance spectroscopy (NMR). Each technology provides complementary information about a sample, such as average molecular weight, molecular weight distribution, monomer units, and end group composition.
These chemical properties (composition and mass parameters) are measured because they have an effect on the physical properties of polymers, and therefore their use in various applications. These traditional techniques cannot be used to determine 3D structure, which is greatly influenced by the flexibility of the polymer chain. It is predicted that the 3D structure of a polymer will have functional importance as synthetic polymers become increasingly sophisticated.1, 2 There is a close relationship between structural architecture and macroscopic properties.
The demand to accurately characterize this new functionality is likely to rise as polymers are increasingly used in highly regulated industries. Applications such as food contact materials and cosmetics are already attracting the attention of regulatory bodies.1
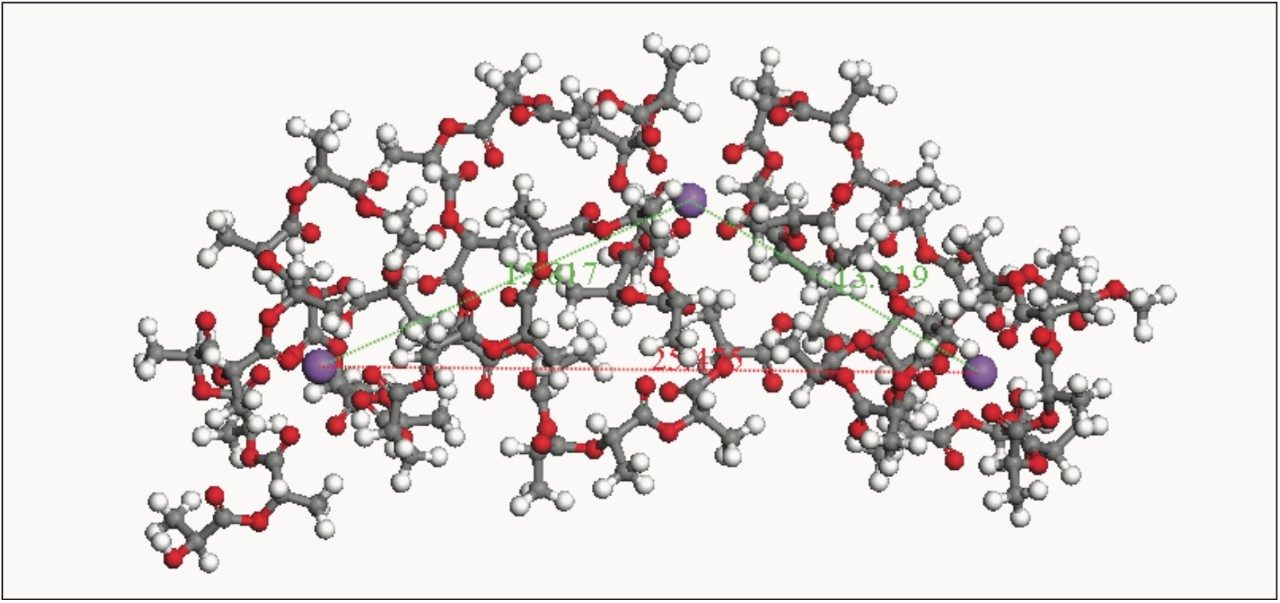
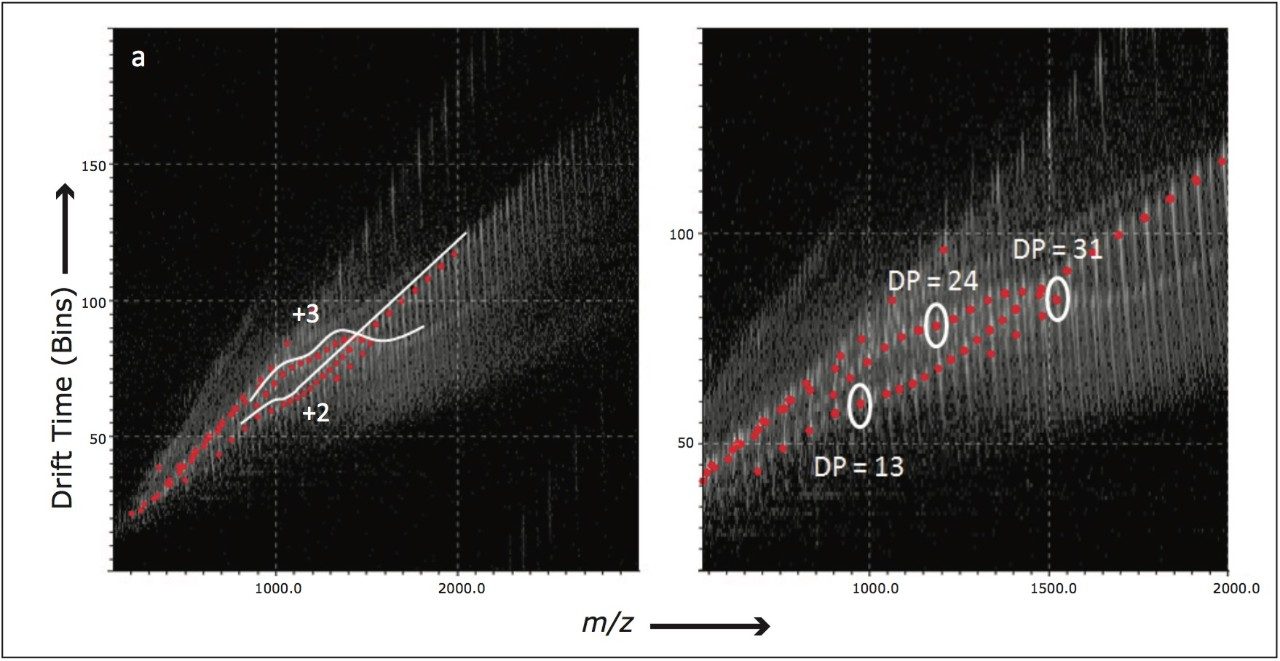
This application note demonstrates how a polymer can be differentiated and characterized using Ion Mobility Spectrometry-Mass Spectrometry (IMS-MS) based on its flexibility and structure. The technique is rapid and requires very little sample preparation.