This Application note investigates the use and applicability of nanoACQUITY UPLC, coupled with Xevo QTof, and ProteinLynx Global SERVER (PLGS) for the characterization, identification, and quantification of unmodified and modified peptide sequences that represent allergenic proteins, such as Ara h1, found in raw and roasted peanuts.
The incidence of food allergies in industrialized populations has been increasing over the past decade.3,4 Many different food types cause adverse health effects for people susceptible to allergic reactions, ranging from mild unpleasant symptoms to deadly anaphylactic shock. Regulations5 that help reduce the risk of cross-contamination during food production and cover product labelling have been put into place as safeguards.
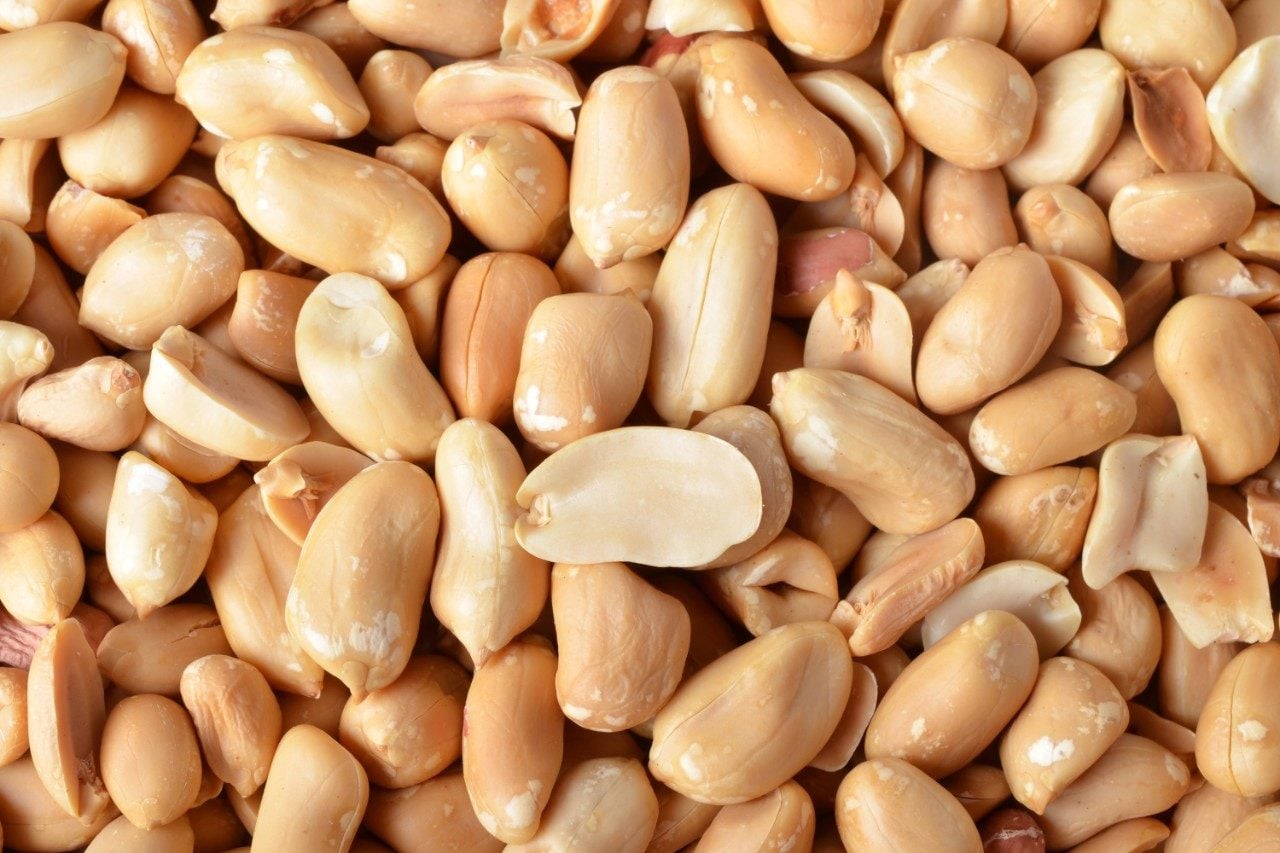
The most prevalent types of foods that can cause allergic reactions include peanuts, tree nuts, wheat, soybean, cow’s milk, hen’s eggs, fish, and crustacean shellfish. In particular, peanut allergy is a major problem due to the ubiquity of peanut use and severity of reactions.
The only effective way to prevent allergic reactions is to avoid allergen-containing food products. For those suffering with allergic reactions to certain food types, avoidance is very difficult unless the labelling on the packaging is clear, and no cross-contamination has occurred during the production process.
There are a variety of techniques available that analyze the presence of allergenic ingredients in food, the more popular techniques being enzyme-linked immunosorbent assay (ELISA) and DNA analysis. These methods often do not target a specific allergenic protein, but use a marker that is indicative of the offending food (e.g., trace of peanuts),6 and separate analytical methods are employed to target each allergen of interest.
More recently, the use of mass spectrometry (MS) for the detection of allergens has received increasing interest; in part due to its ability to have one platform to analyze multiple allergenic markers, as well as its ability to target the specific protein in its natural and modified state, plus the sensitivity of detection; trace levels are detectable with and without processing.
The use of liquid chromatography (LC) with MS combines the separation and identification of individual proteins to provide an unambiguous identification of allergenic proteins present in food products.
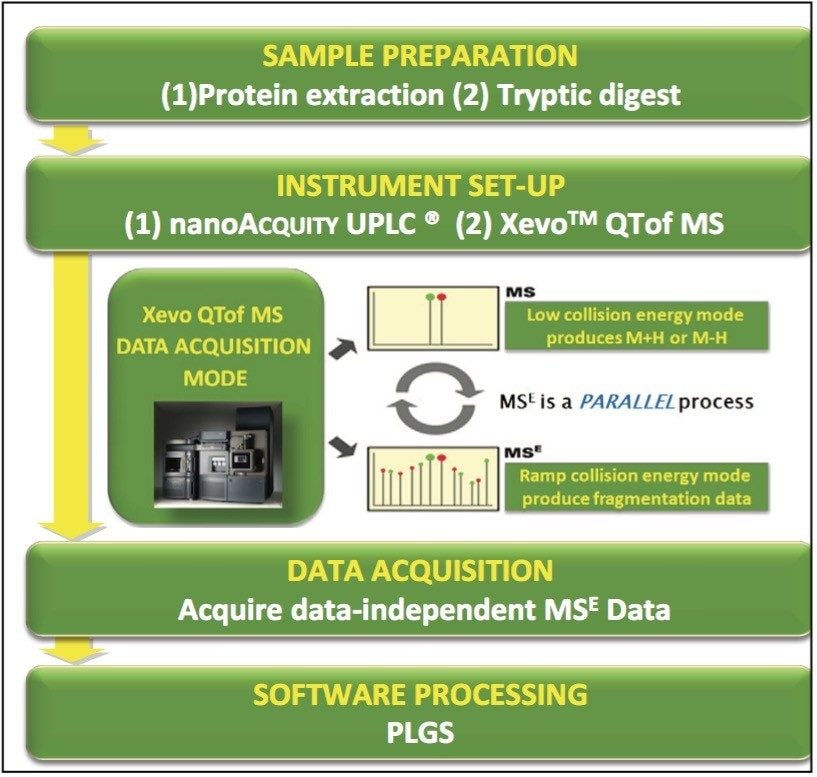
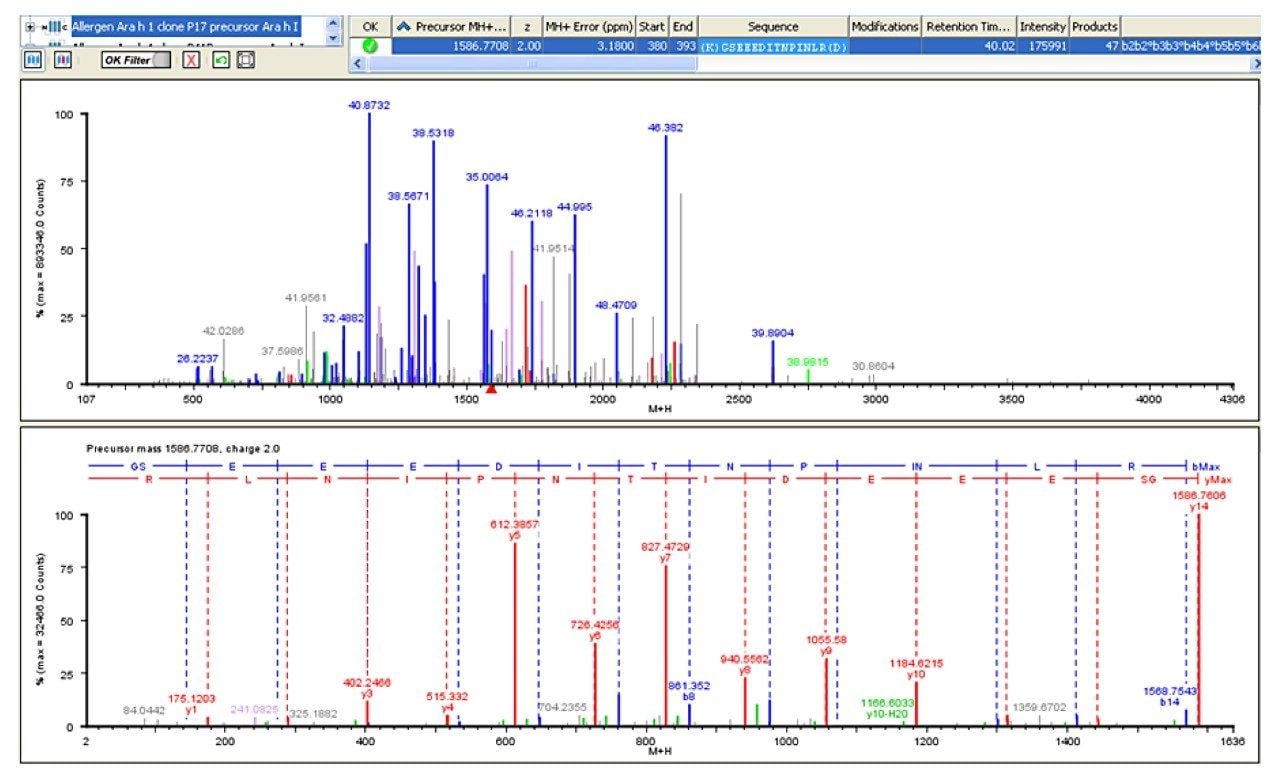
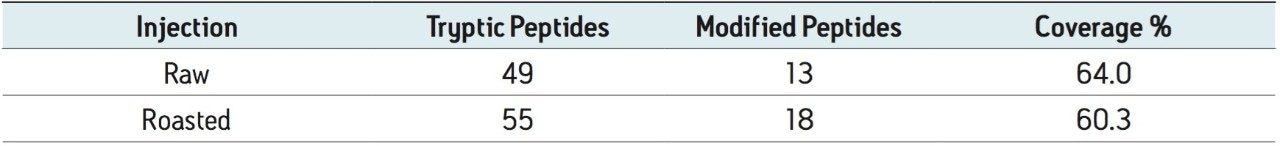
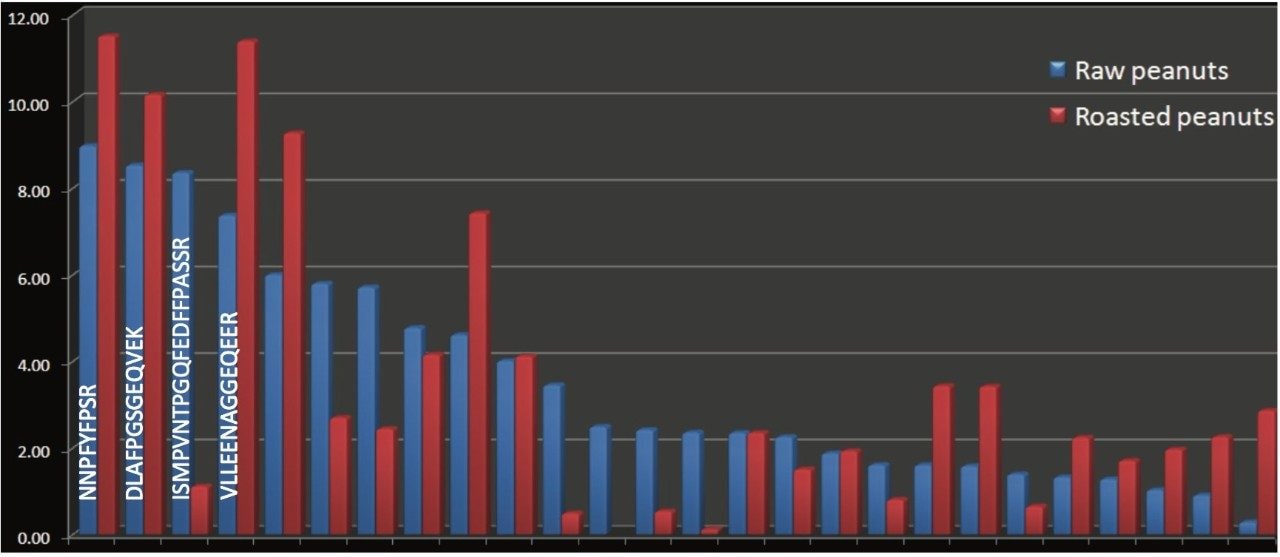
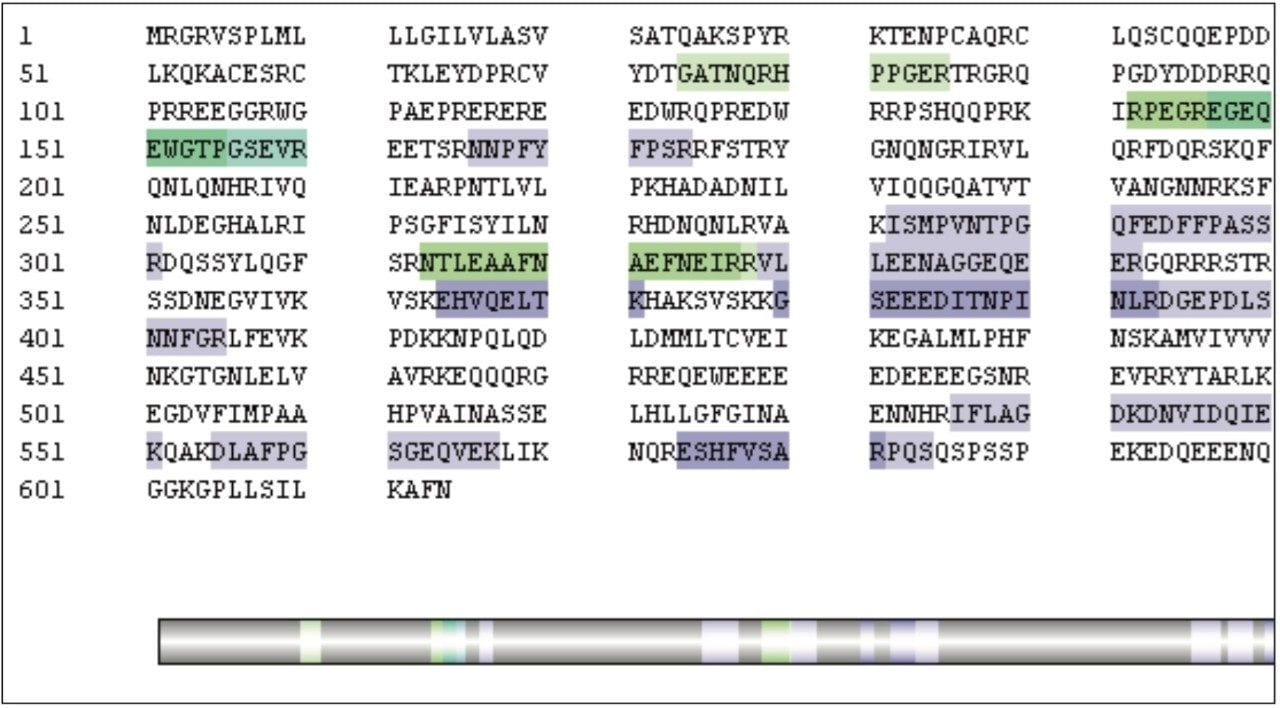
This work investigates the use of nanoACQUITY UPLC and Xevo QTof MS, and a food-proteomics approach to identify markers associated with the allergic reaction observed with peanuts, and to see if the markers can be observed in roasted peanuts. The technological processes used in the preparation of food products further contribute to the complexity of this system by inducing such phenomena as proteolysis and non-enzymatic glycosylation,7 and therefore there is a need to also assess the potential modifications that may be present.
Part 1 Extraction of the allergenic protein (Ara h1) from the peanut samples9
Part 2 Tryptic digest using Waters RapiGest SF
Part 3 Preparation of the samples in matrix with yeast alcohol dehydrogenase (ADH) addition to quantify peptide markers
LC system: |
nanoACQUITY UPLC System |
Column: |
nanoACQUITY BEH C18 75 μm x 150 mm |
Column temp.: |
35 °C |
Sample temp.: |
4 °C |
Flow rate: |
300 nL/min |
Mobile phase A: |
0.1% Formic acid in water |
Mobile phase B: |
0.1% Formic acid in acetonitrile |
0.0 min |
95% A |
22.0 min |
95% A |
52.0 min |
60% A |
54.0 min |
20% A |
61.0 min |
20% A |
65.0 min |
95% A |
80.0 min |
95% A |
MS system: |
Xevo QTof MS |
System ionization mode: |
ESI positive |
Capillary voltage: |
3.3 kV |
Sample cone: |
25.0 V |
Source temp.: |
100 °C |
Scan time: |
0.6 s |
Lock mass: |
785.8426 |
MS scan: |
Low collision energy 6 V |
MSE scan: |
High collision energy 15 to 40 V |
Acquisition range: |
50 to 2000 m/z |
Databank: |
Swissprot |
Fixed modification: |
Carbamidomethyl C |
Variable modification: |
acetyl N-Term, deamidation N, deamidation Q, met-oxidation, hydroxy P |
Variable glycosylation modification: |
N-linked glycosylation |
There are many published journal articles that demonstrate the applicability of tandem quadrupole MS for allergen analysis.10,11,12 For these experiments samples were analyzed on a quadrupole-time of flight (Q-TOF) MS: one of the main advantages for using Q-TOF MS over a tandem quadrupole instrument is the ability to monitor both the expected and unexpected peptide modifications that may result if the peanut has undergone different processing procedures, so it may be used for targeted and non-targeted analysis.
The analytical workflow is shown in Figure 1. In this experiment, a bottom-up proteomic approach was used to identify the peptides related to the extracted allergen Ara h1 of raw and roasted peanuts: the peanut extracts obtained were digested with trypsin. The peptides were then separated using nanoACQUITY UPLC and analyzed using Xevo QTof MS in an alternate scanning MSE mode.
Xevo QTof MS was set up using IntelliStart Software, which provides automated calibration and system checks to ensure that both the LC and MS systems are operational, and it allows facile transition from tandem to TOF technology for analysts.
The LC/MSE data were processed using PLGS Software for database search; the application manager interrogates the data to produce a list of peptides that are observed in each sample.
Figure 2 shows the overlapping base peak intensity chromatograms for the low collision energy MS scan obtained for Ara h1 protein extracted from raw peanut. It is clear to see that reproducible chromatographic results were obtained using the nanoACQUITY System within the same sample.
Xevo QTof MS was operated in the alternate scanning “MSE mode” (where E represents elevated collision energy). This technique provides two MS scan functions for data acquisition in one analytical run. The first scan function acquires MS data using low collision energy and collects information on the intact (precursor) ions in the sample. For the second scan function the collision energy is ramped from low to high energy, which allows for the collection of fragment ions from peptides over a wide m/z range.
Figure 3 shows a zoomed in section of the low (Figure 3A) and high collision energy (Figure 3C) chromatograms for the raw peanut data.
In the low collision energy function (Figure 3A), the resulting spectrum from retention time 39.95 to 40.10 min is shown in Figure 3B, with the most abundant doubly-charged ion being m/z 793.90 representing a peptide ion of interest.
The corresponding high collision energy spectrum (Figure 3D) shows fragment ions found within the same retention time window. Using integrated PLGS Software the precursor and product ions are associated by both retention time alignment and peak shape and so it is possible to exclude those ions not related to m/z 793.90.
In this example, the fragments related to the doubly-charged species m/z 793.90 can be seen in Figure 4 with the predominant fragments being m/z 612.41 and 827.51. Using the MSE fragment information, the software identified this peptide sequence as: GSEEEDITNPINLR.
Table 1 shows the summary of sequence coverage and number of peptides identified. High sequence coverage (above 60%) was obtained for Ara h1 protein from both raw and roasted peanuts with about 50 peptides identified to each. Using the MSE data from the Xevo QTof MS, the analyst can have high confidence in each peptide assigned; the unique exact mass time-aligned precursor and fragment data aids structural identification.
A list of common peptides observed in the raw and the roasted samples was compiled from PLGS to determine potential MS markers for the allergenic protein, which could be used to identify the presence of peanuts. Figure 5 shows the relative changes in intensity of the unmodified and modified peptides found in the raw and roasted peanut samples (the relative intensities of each peptide was calculated by normalizing the intensity of each peptide against the sum intensity of all identified peptides to the protein).
In order to determine whether the peptide observed will be potential markers, they need to be present in the raw peanut and processed/roasted peanut at relatively high intensities in order to be able to monitor the peanuts present within other food products. The three most intense peptide sequences present in both the raw and the roasted samples were NNPFYFPSR, DLAFPGSGEQVEK, and VLLEENAGGEQEER and are labelled in Figure 5. Although sequence ISMPVNTPGQFEDFFPASSR was relatively intense in the raw sample, the presence of this marker was much lower in the roasted sample and so was not included as a key marker in this experiment.
For the analysis of allergenic proteins in foodstuffs it is important to know how much of the protein is present in the sample of interest and for some allergens regulations specifying safe levels have already been implemented.7 In this experiment the peanut sample was incorporated into matrix to see if it is possible to identify the allergenic protein at very low levels. Ara h1 was incorporated into matrix at a ratio of 1:200 (v/v).
For this part of the experiment an additional step to the sample preparation was included (see Part 3). ADH with known concentration was used as an internal protein standard to enable the software to quantify the amount of protein present in the sample.
The sum intensity of top three ionizing peptides from ADH was used as a response factor in the software. Absolute quantification of proteins identified in the mixture was performed by comparing the sum intensity of the top three ionizing peptides of each protein to the response factor.8
Using this approach, the PLGS Software calculated the amount of Ara h1 present in matrix to be 10 fmol. For the raw peanut sample in matrix the peptide sequence coverage was calculated to be 26%, as seen in Figure 6, with 12 unmodified and modified peptides contributing to this coverage. The top three intensity peptides identified, DLAFPGSGEQVEK, VLLEENAGGEQEER, and ISMPVNTPGQFEDFFPASSR were automatically utilized in PLGS Software for Ara h1 quantification.
The experimental combination of nanoACQUITY UPLC, Xevo QTof MS, and PLGS Software allows the simultaneous identification and quantification of peptides and proteins in peanut allergen samples.
Using the workflow described here, it has been possible to identify key peptide markers that are present in raw and roasted peanuts:
1. Xevo QTof MS supports the proteomic-approach in a food testing environment – here the example is for the analysis of allergenic proteins.
2. UPLC/MSE fragment ion data provides greater confidence in protein identification in food samples.
3. ProteinLynx Global SERVER Software leverages the selectivity of exact mass measured data and the specificity of MSE analysis. Combined with intelligent filtering and scoring routines, this minimizes the occurrence of false positive results for food allergens.
4. Waters PLGS Software conclusively identifies proteins matched with multiple peptides by paying full attention to each peptide’s chromatographic retention time, exact precursor, and product ion masses. PLGS combines UPLC/MSE data with a comprehensive peptide ion accounting informatics solution to catalogue complex protein digest mixtures.
5. The addition of ADH tryptic digest (internal standard) to the peanut samples enables label-free quantification.
Twenty grams of CPE1 was added to 500 mL of extraction buffer (50 mM Tris-Cl, pH 8.3, 5 mM DTT1, 1 mM EDTA1, 1mM PMSF1) containing 200 mM NaCl.
The solution was stirred gently at room temperature cleared by centrifugation at 13,000 x g for 30 minutes at 4 °C. Ammonimum sulfate was then added to the homogenate to 70% saturation. The solution was cleared of precipitated protein by centrifugation at 13,000 x g for 30 min at 4 °C.
The remaining supernatant was then taken to 100% ammonium sulfate saturation and the Ara h1 protein collected by centrifugation. The pellet was resolubilized in extraction buffer (pH 8.3) by sonication on ice at 40% power using a Heat Systems Disruptor, desalted on disposable PD-10 gel filtration columns and loaded onto a High Prep S column (2.5 x 12 cm).
A linear salt gradient (200 to 800 mM NaCl) was used to elute Ara h1 from the column, and 2.5 mL fractions were assayed for Ara h1 content by SDS-PAGE and Coomassie Brilliant Blue staining. Fractions containing Ara h1 were pooled and desalted into desired buffers on PD-10 columns just prior to use in all experiments. Protein concentrations were monitored using a protein assay reagent kit. SDS-PAGE1 was performed to monitor the purity of the proteins during all stages of purification. Purified Ara h1 was stored in aliquots at -80 °C.
Place 20.0 μL of 4.2 μg/μL Ara h1 sample extracted from raw or roasted peanut in a capped microcentrifuge tube.
Add 10.0 μL 50 mM NH4HCO3.
Add 25.0 μL of 0.2% solution of RapiGest SF in water and vortex.
Place tube in a block heater set at 80 °C. Heat for 15 mins.
Remove from block. Centrifuge, add 2.5 μL of 100 mM dithiothreitol (DTT), vortex.
Place tube in a block heater set at 60 °C and heat for 30 min.
Remove from block, allow cooling to room temperature, and centrifuge.
Add 2.5 μL of 300 mM iodoacetamide (IAA, for alkylation), and vortex.
Place samples in dark at room temperature and allow 30 min reaction time.
Add 16 μL (raw) or 3 μL (roasted) of a 50 ng/μL Promega trypsin solution in 50 mM NH4HCO3, vortex.
Digest at 37 °C in a block heater overnight. To hydrolyze the RapiGest, add 10 μL of 5% TFA, and vortex. Incubate samples at 37 °C for 90 min. Then centrifuge at 14,000 RPM at 6 °C for 30 min.
Transfer the supernatant to a glass vial for analysis.
Solution A: Ara h1 tryptic digest (raw peanut)
Solution B: Mixture containing 250 ng/μL E. coli tryptic digest and 50 fmol/μL ADH tryptic digest in 0.1% FA
Solution C: Mix solution A with B, 1:200 (v/v)
720003656, August 2010