This application note demonstrates the use of UPLC-TOF to characterize and detect adulterations of olive oils using multivariate analysis.
Global trade expansion, growing demand for new food products, and ‘high value’ commodities have led to an increase in counterfeit foodstuffs within domestic and world markets. For governments, this represents a potential threat to consumer safety and domestic export markets. For food producers, damage to their most valuable asset, brand image, is a significant concern.
Olive oil was the most adulterated agricultural product in the European Union in 1997 and 1998.1 The economic gains of olive oil adulteration can be significant. Currently, the cost of olive oil is nearly three times the cost of common adulterants such as rape seed oil.2
Adulterations of olive oil can also impact the health of consumers. One extreme case in 1981 took place in Spain where approximately three hundred people died as a result of industrial grade oil being sold as olive oil.3
The International Olive Oil Council defines olive oil as the oil obtained solely from the fruit of the olive tree with the exclusion of oils obtained using solvents or re-esterification processes and of any mixture of other oils.4
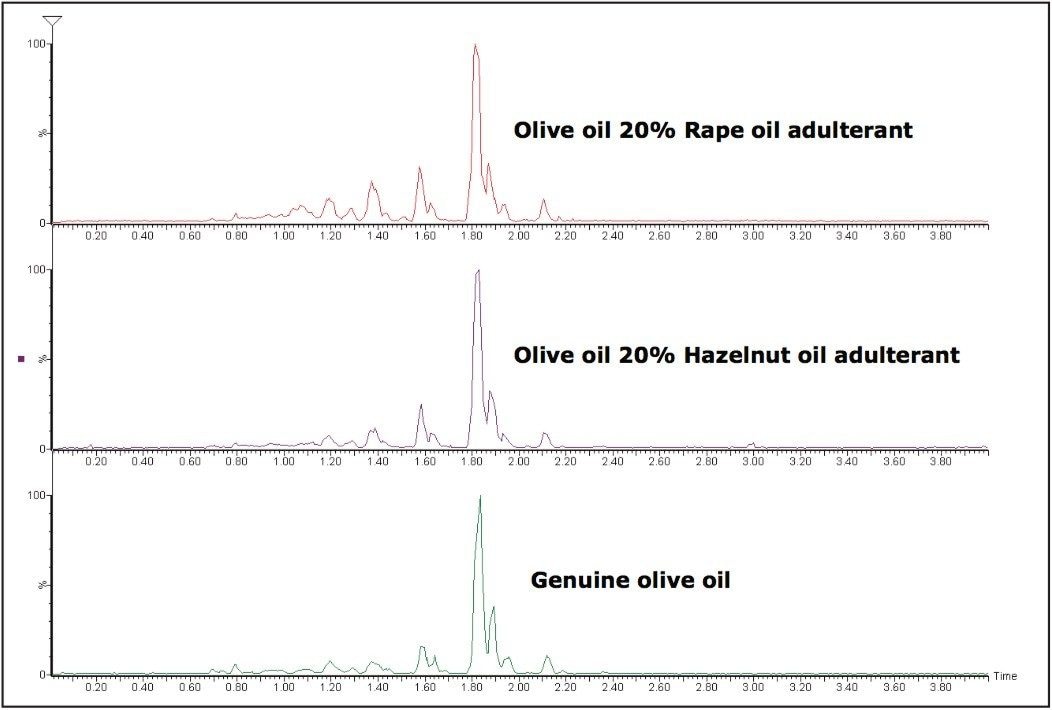
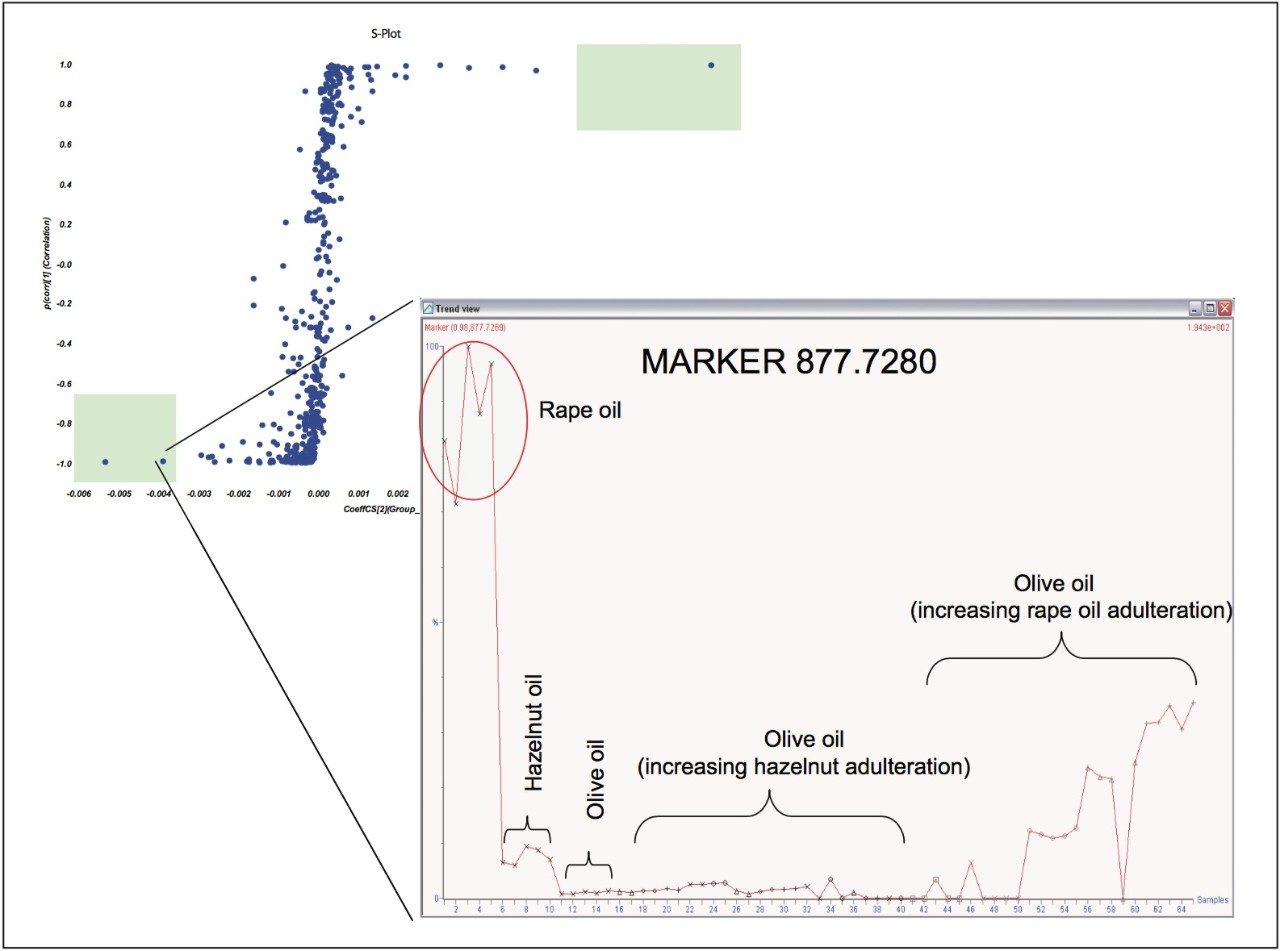
Adulterants have become more subtle and increasingly difficult to detect and traditionally require a multitude of techniques to indicate their presence. Hazelnut oil is a good example of this as the triglyceride signature of hazelnut is easily hidden when mixed with olive oil.
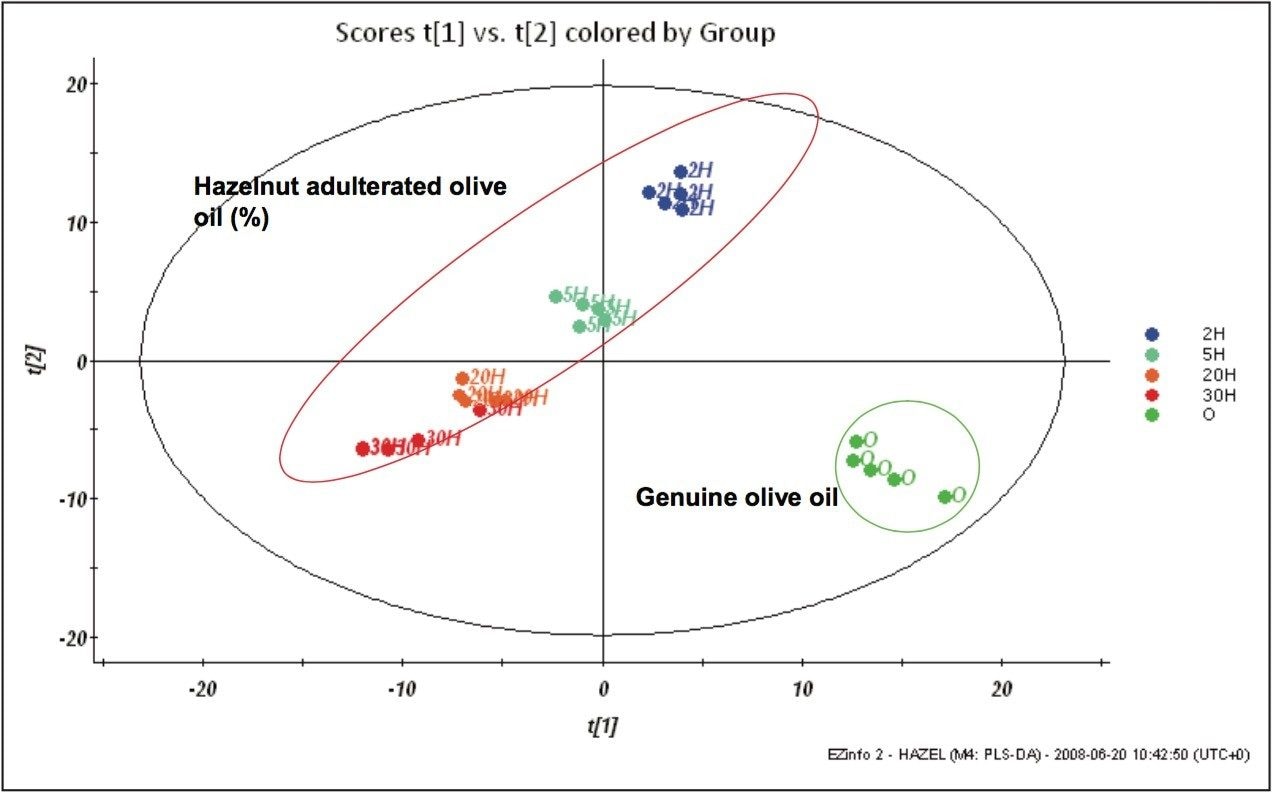
A chemometric approach can help to look deep into datasets and allow statistically unusual characteristics to be observed. When utilized with innovative separation and mass spectrometry technologies, these unusual characteristics can be investigated.
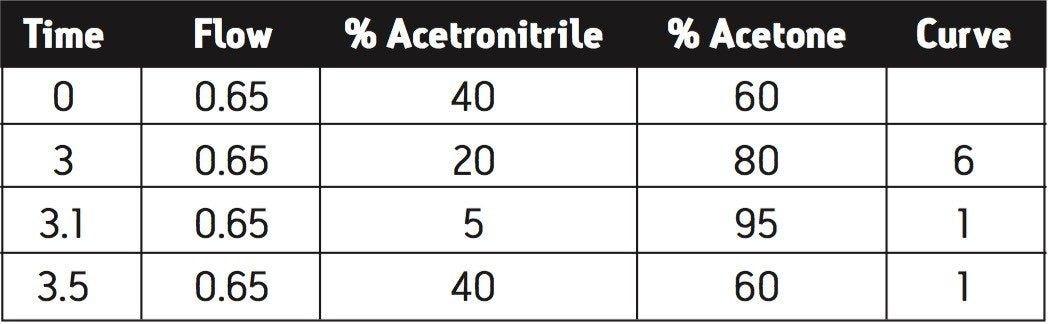
This application note describes the use of UPLC-TOF and integrated chemometric software tools to characterize and detect olive oil adulterants, namely rape and hazelnut oils.
Adulterated olive oils, rape oil, hazelnut oil, and non-adulterated olive oils were fully dissolved in acetone (1:1000) and presented for analysis.
LC system: |
Waters ACQUITY UPLC System |
Column: |
ACQUITY UPLC BEH C18 2.1 x 100 mm 1.7 μm |
Mobile phase: |
A: Acetonitrile B: Acetone |
Flow: |
0.65 mL min-1 |
MS system: |
Waters LCT Premier XE Mass Spectrometer |
Ion mode: |
APCI + |
Data were acquired using MassLynx Software v. 4.1 and processed using integrated MassLynx tools and MarkerLynx XS Application Manager. This software package is designed to extract and plot multivariate datasets, particularly those acquired using a mass spectrometer.
Fast ACQUITY UPLC System separation of oil components was achieved, while maintaining good chromatographic resolution and utilizing mass spectrometer amenable solvents. The LCT Premier XE System allowed for rapid, full-spectrum exact mass information to be acquired that enabled elemental compositions to be investigated, as well as facilitated marker identification. Differentiation of olive oils from adulterated olive oils was difficult to achieve by visual inspection of each base peak mass chromatogram with only very subtle differences observed. Figure 1 shows base peak intensity (BPI) chromatograms for a non-adulterated olive as well as 20% adulteration of olive oil with some common adulterants.
It is possible to isolate some components that indicate the presence of adulteration by manually evaluating the data, but this can be laborious and time-consuming. A much more rapid and comprehensive approach is to use a software package that utilizes statistical chemometrics and allows multiple variables to be considered simultaneously.
Rapid ACQUITY UPLC System separations allow fast acquisition of multiple datasets for each olive oil sample. This facilitates the build-up of statistical data for sample characterization and differentiation. MarkerLynx XS Application Manager is able to mine the data and produce a table of exact mass-retention time pairs (EMRT) with intensity data that creates unique fingerprints for each sample. The resultant data is then easily interrogated using graphical displays and statistical models.
MarkerLynx XS features PLS-DA (Partial Least Squares Discriminate Analysis). This statistical model enhances the separation between groups of samples based upon their unique EMRT fingerprints. In turn, it is then possible to determine what is causing the separation between groups i.e. the unique markers (unique sample components). Figure 2 shows PLS-DA separation of an adulterated Italian olive oil with differing percentages of hazelnut oil. Also shown is the genuine olive oil. There is a clear separation of all the groups, which allows easy determination of the presence of adulteration of this particular oil. Rape adulterations were also investigated and again, clear separation was observed with a PLS-DA model applied.
It is apparent that distinction between groups is possible, following this; it is then possible to determine what is causing the separation between groups, i.e. the unique markers. This leads to finding significant compounds indicating adulteration that could be targeted for analysis in a quality control environment.
An S-plot (as shown in Figure 3) derived automatically from OPLS-DA (Orthogonal Least Square Discriminate Analysis) data for rape adulteration indicates the contribution of each marker to the separation of two particular groups. The points at the extremes of the plot indicate significant components in the sample, which contribute the most to the separation. Figure 2 shows an S-plot of genuine olive oil against rape adulterated oil. Also shown in Figure 3 is a trend plot of a significant marker (exact mass) for the presence of adulteration.
Identification of this adulterant marker was performed by automatically searching databases that proposed potential candidates based upon the exact mass measured. Exact mass searching has the added advantage of reducing the number of potential candidates. Two of the potential candidates proposed were linolenoyldilinoleoylglycerol (LLLn) and dilinolenic-olein (LnLnO) as shown in Figure 4. The automatically calculated elemental composition of the combined spectrum obtained for the marker supports the database assignments(C57H97O6 [M+H]+) within 1 ppm mass accuracy (see Figure 4).
As these compounds are isomeric, high energy in-source fragmentation experiments were necessary to distinguish between the two candidates. Waters MassFragment Software allowed automatic interpretation of the high energy spectra against the two candidates proposed. Figure 5 shows the assigned fragments from MassFragment and indicates the marker identity as LnLnO due to the presence of the [LnO]+ fragment at 599.5044 m/z. Exact mass of the fragments assigned were all within 2 ppm mass accuracy.
Rapid throughput with improved sensitivity.
Flexible analyses of multiple compounds in complex matricies.
Improved lab efficiency and excellent return on investment.
Maximum full scan sensitivity.
Full UPLC compatibility.
Exact mass and isotopic pattern information enabling the successful identification of unknowns.
Automatic extraction of relevant marker information and processing of complex multivariate data from LC/MS analyses.
Data reduction and statistical analyses via an interactive browser to differentiate samples and isolate characteristic markers that make those samples different.
Provides further confirmation of database search candidates by automatically assigning fragmented spectra to theoretical fragments.
720002786, September 2008