• Application Note

System Management Tools for a High Throughput Open Access UPLC-MS System Used During the Analysis of Thousands of Samples

System Management Tools for a High Throughput Open Access UPLC-MS System Used During the Analysis of Thousands of Samples

  • Darcy Shave
  • Warren B. Potts
  • Michael D. Jones
  • Paul Lefebvre
  • Robert S. Plumb
  • Waters Corporation
Many multi-colored pills

Abstract

This application note demonstrates how Open Access systems give chemists the ability to analyze their own samples close to the point of production by simply walking up to the LC-MS system, logging in their samples, placing their samples in the system as instructed, and walking away.

Introduction

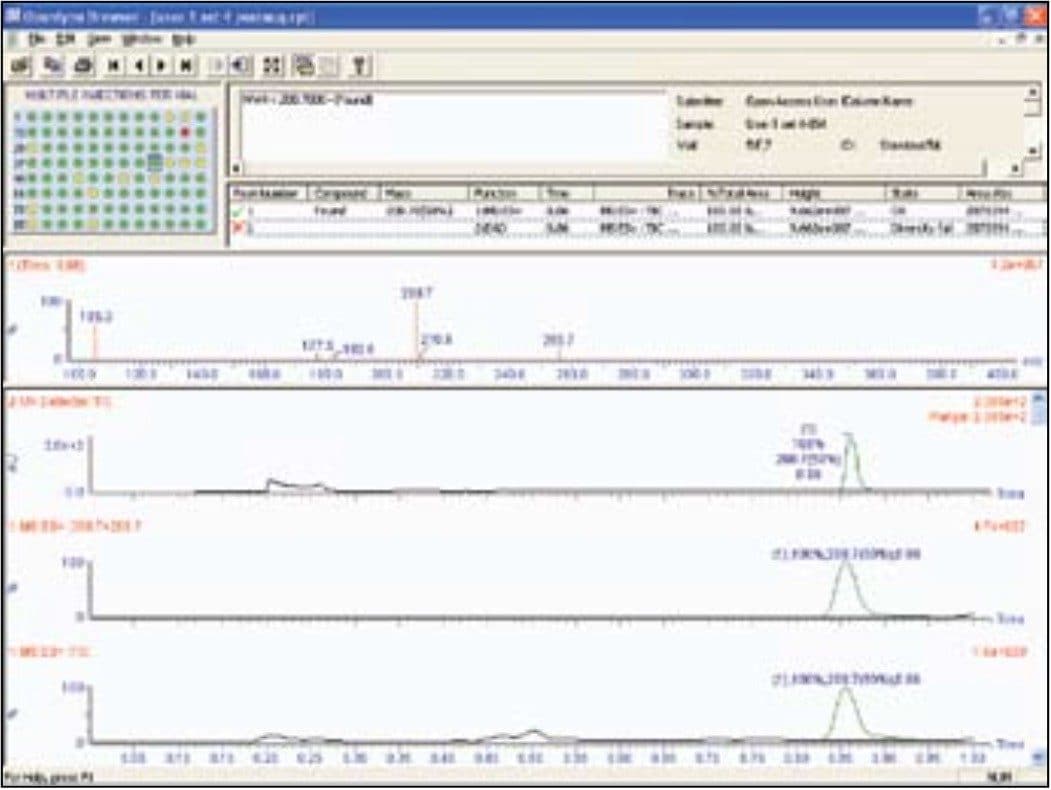
Many compound libraries contain compounds that were synthesized several years prior or obtained from outside resources. It is important that the expected composition of each compound be confirmed. LC-MS has become the standard technique for confirming the purity and identification of a compound that has demonstrated activity in a biological screen.

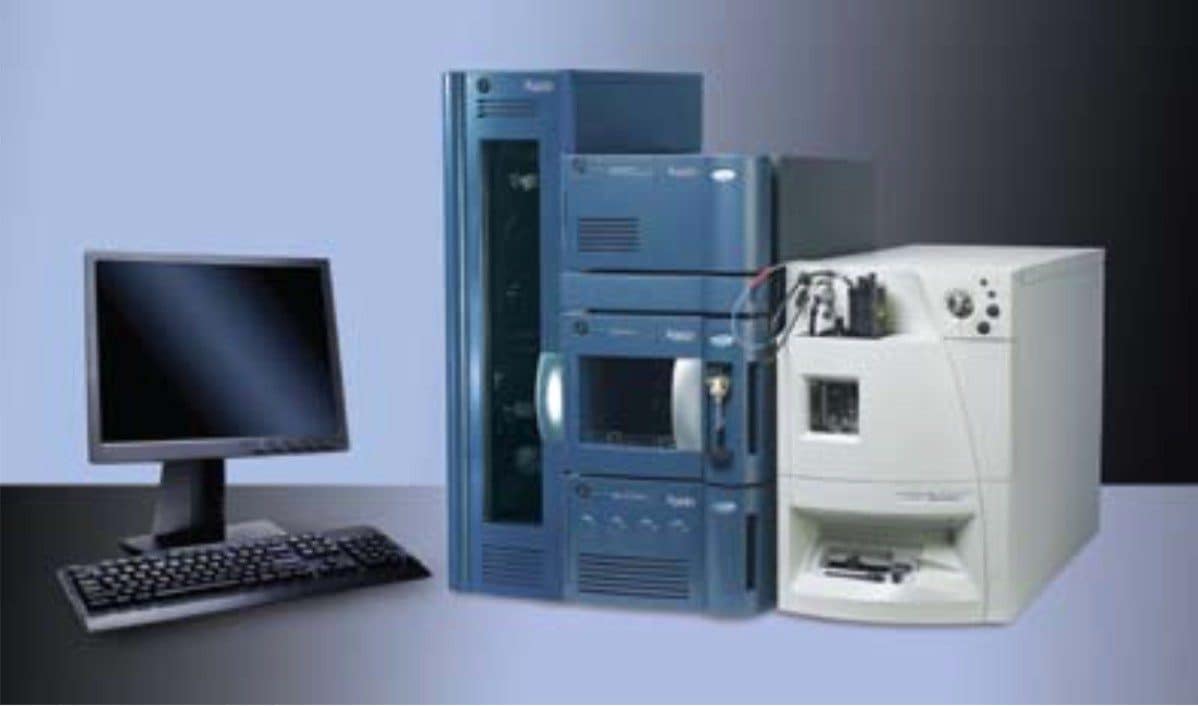
If the library store is not routinely checked, false positives in an activity screen are highly possible. This will lead to wasted time, effort, and money on compounds that should not advance in the discovery process. Because these libraries may contain thousands, if not millions, of compounds, an Open Access UltraPerformance LC (UPLC)-MS system was investigated for high-throughput library quality control.

Enhancements to HPLC and LC-MS technologies have provided useful tools to improve the throughput and accuracy of these assays. Throughput can be substantially increased with the use of UPLC-MS, which makes use of small column particles (sub-2 μm) and high operating pressure (>10,000 psi). This can result in an up to 10-fold increase in throughput along with a three-fold increase in sensitivity.

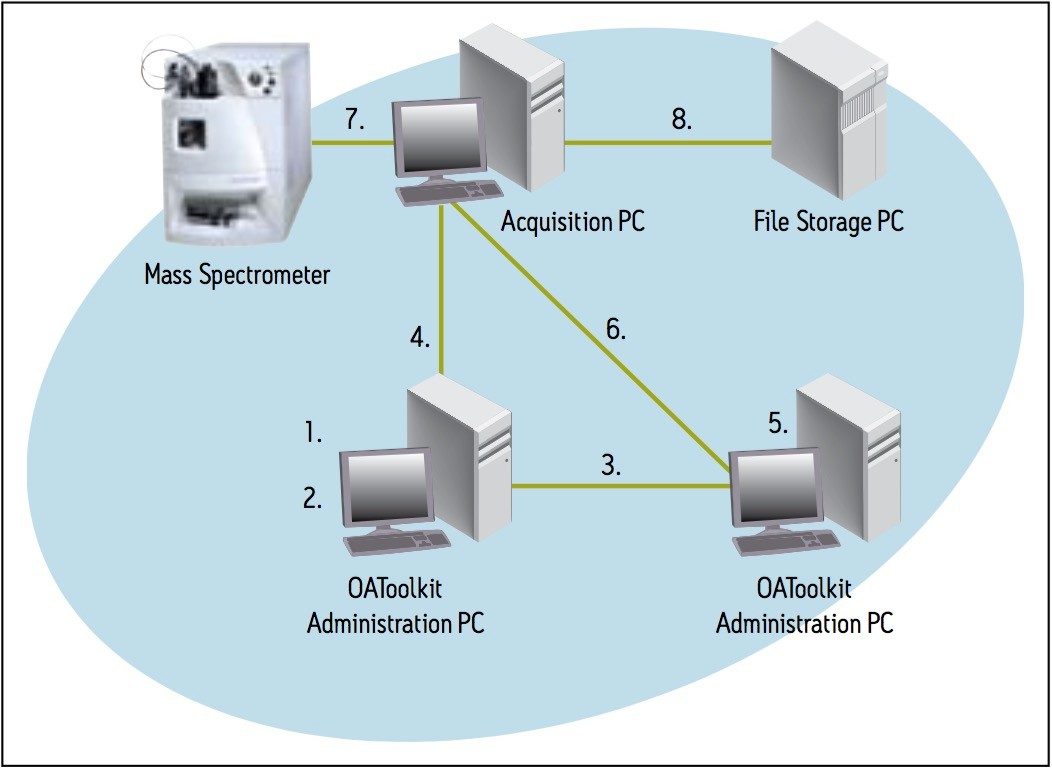
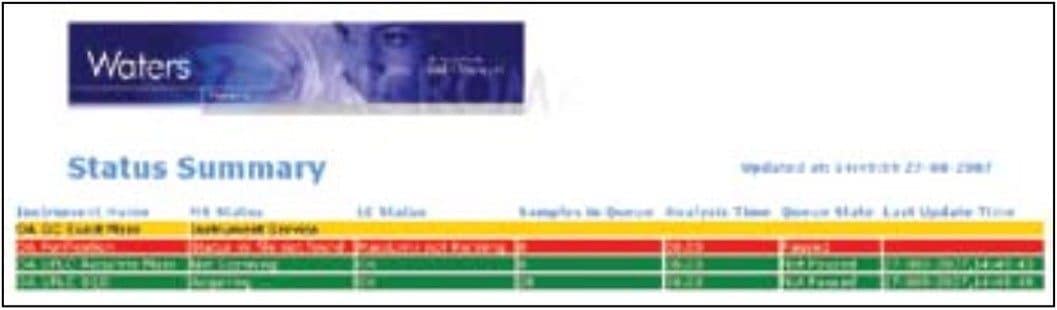
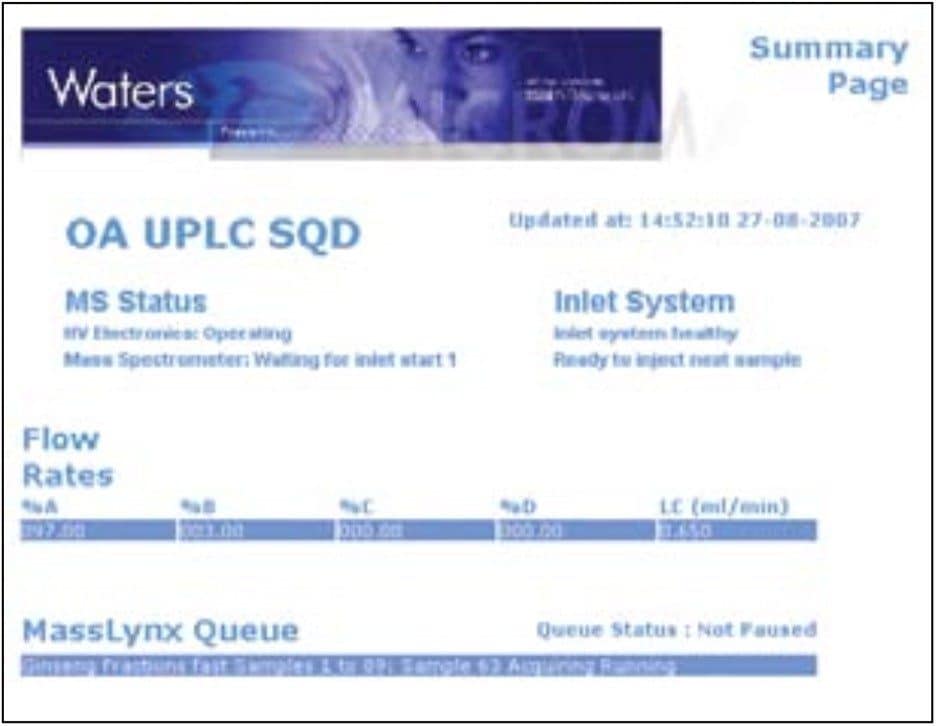
Due to the large number of samples analyzed and data generated during this testing, a new software package has been created that facilitates administration of this Open Access system. It created new project directories for the users and moved the resulting project data (such as raw data files) across the network as it was created. Data processing could then be done on a separate dedicated computer. The software also monitored the instrument PC, providing on-the-fly information about its status and the status of its sample queue from a centralized location.

The ACQUITY UPLC System with the ZQ Mass Detector for open access laboratories.

Experimental

All experiments were conducted using the Waters ZQ Mass Detector, equipped with an ACQUITY UPLC System with a Sample Organizer, Photodiode Array (PDA) Detector, cooled Autosampler and Column Heater. The ZQ was equipped with an ESCi source, running in the ES+ ion mode. The instrumentation was controlled by MassLynx 4.1 Software with OpenLynx and OpenLynx Open Access Application Managers.

Samples were run on a 1 min gradient from 5 to 95% organic at 0.8 mL/min. The column was a 1.7 μm, 2.1 x 50 mm ACQUITY UPLC BEH C18 Column. The PDA was set to analyze a wavelength range from 210 to 400 nm. The mass detector analyzed a mass range from 100 to 500 amu with a dwell time of 100 ms and an interscan delay of 50 ms.

Eight microtitre palates, each containing 96 pharmaceutical samples, were logged onto the system using OpenLynx Open Access. The first and last samples in each plate were used for quality control.

Results and Discussion

By using an ACQUITY UPLC System with the optional Sample Organizer, we were able to analyze 3840 samples in under seven working days on a single column. On a traditional HPLC system, this would take approximately 27 working days, assuming a 10-minute run time.

The Open Access interface allowed users to log in the samples while providing a minimal amount of information. A series of methods, each including gradient conditions, MS conditions, and processing parameters, was designed by the system administrator. The users simply chose a method from this list, imported their sample lists, and placed their microtitre plates in the indicated positions.

The samples were then analyzed and the data was processed. Once processing was finished, the data was copied to a file storage PC. From here the users could do further processing if desired. As well, a report file was generated from the processed file and converted to .xml format. This facilitated storage of the results in a database.

Instrumentation

Throughput was increased by using UPLC. This technique made use of 1.7 μm column particles and high operating pressure (12,000 psi). These properties resulted in a five-fold increase in throughput. Sensitivity was not investigated.

Due to the large number of samples being run, an ACQUITY UPLC Sample Organizer was also used. This thermally-conditioned sample storage compartment extended the capacity of the system by adding space for seven deep-well microtitre plates (or 21 shallow-well plates). Total sample capacity was increased from 192 samples (two plates) to 768 samples (eight plates) when using 96-well plates. If using 384-well plates, maximum capacity would be 8064 samples.

An added advantage of the Sample Organizer in an open access environment is the ability to add samples to the system without pausing the sample queue. When the door to the Sample Manager is opened, any movement –whether of the sample plate or of the needle – is paused for safety. This pause does not occur when loading the Sample Organizer.

Software administration tools

The Open Access software allowed chemists to walk up to a terminal and log in samples onto an instrument, inputting the minimum of information needed for the sample run. It also allowed the system administrator to maintain control over the Open Access systems and to track the performance of each system. It facilitated batch processing and reporting of results.

The administrator selected the fields that appeared when remote users logged in samples. The administrator designated fields as mandatory so that login would not proceed unless the remote users entered values for these fields. They also defined upper and lower limits for the values of numeric fields. In addition, the administrator defined the format for text that remote users entered in the text fields.

The Open Access Toolkit (OA Toolkit) service ran on the Acquisition PC and copied open access users’ batch files and raw data to remote locations once their samples were run. The information about these users, and the locations to where their data was to be sent, is contained within the administration tool. This information is uploaded to the service on the Acquisition PC .

The illustration in Figure 1 and following procedure describe the order of events during typical operation.

  1. The administrator uses the Administration Tool to create a user.
  2. The administrator uses the Administration Tool to add extra information about the OA Login user, for example, that the raw data of any of the user’s samples should be moved to the File Storage PC whenever a user’s sample is processed.
  3. The administrator uploads the user information to the OA Login PC. This adds the user’s name to the drop-down list in the login screen on the OA Login PC.
  4. The administrator uploads the user information to the OA Toolkit service on the Acquisition PC. The service now contains the instructions of how to proceed if the OA Login user logs in a batch.
  5. The OA Login user logs in a sample using the OA Login terminal as normal.
  6. OA Login logs the sample with MassLynx.
  7. When MassLynx has finished running the sample, the OA Toolkit service reads the batch file (.olb), and registers that it is from a recognized user.
  8. The OA Toolkit service moves the raw information to the specified location on the File Storage PC .
 Data from the mass spectrometer is captured by the Acquisition PC, then is managed by the system administrator or accessed by the individual user via the OALogin tool.
Figure 1. Data from the mass spectrometer is captured by the Acquisition PC, then is managed by the system administrator or accessed by the individual user via the OALogin tool. The raw data is also backed up to a File Storage PC.

Reporting

The Open Access software allowed the administrator to define how samples were processed. Once all the data for a sample set had been collected, the OpenLynx Application Manager automatically processed the data and created an OpenLynx Browser report (.rpt).

The browser report (Figure 2) presented a summary of results as a color-coded map (found/not found/tentative) for easy visualization of analysis results. Users accessed and reviewed the data by simply pointing and clicking on the sample location of interest. Chromatograms, spectra, sample purity, peak height, peak area, retention time, and other information can easily be reviewed within the browser.

OpenLynx browser report.
Figure 2. OpenLynx browser report.

The browser report was created in the report folder of the current project. A secondary report location could have been specified, but was not. The toolkit service also allowed for a copy of the report to be sent over the network to another location. That location was specific to each user – a folder on their office PCs. The users no longer had to access the Acquisition PC to view their reports. In addition, the raw data folders were moved across the network to each user’s PC and the users were able to reprocess it with a process-only version of MassLynx.

Finally, the OA Toolkit service was used to automatically convert the browser reports to .xml format. This was accomplished using the included .xml import and .xsl export schema. This data can then be easily incorporated into a database or shared with colleagues.

System monitoring

On the Administration PC , the Remote Status Monitor (RSM) monitored the status of the Open Access Acquisition PC , along with other Acquisition PC s on the network and wrote that monitoring information to an .xml file. The information could then be read and interrogated remotely in a browser (Figure 3).

 Status of the Open Access Acquisition PC.

More detailed information about an instrument can be displayed by clicking anywhere in the instrument row (Figure 4).

Detailed view of instrument status.

Conclusion

Waters Open Access systems give chemists the ability to analyze their own samples close to the point of production by simply walking up to the LC-MS system, logging in their samples, placing their samples in the system as instructed, and walking away. As soon as the analysis is completed, sample results are emailed or printed as desired. System configuration and setup is enabled through a system administrator who determines login access, method selection, and report generation.

OpenLynx OA Toolkit enables administrators to manage open access users from a central point, assigning detailed configuration information and attributes for these users, and then exporting these details to multiple OA Login PCs and Acquisition PCs. OpenLynx OA Toolkit also enables administrators and users to remotely monitor the status of Acquisition PCs.

720001482, June 2007

Back To Top Back To Top