• Application Note

An Example of a Particle Selectivity Difference between CORTECS C8 and BEH C8 Columns

An Example of a Particle Selectivity Difference between CORTECS C8 and BEH C8 Columns

  • Jennifer M. Nguyen
  • Thomas Swann
  • Waters Corporation
Green tea in glass cups with tea leaves

Abstract

This application note describes rapid separation of samples containing structurally similar compounds. It compares the separation of seven structurally similar catechins on an XBridge BEH C8 XP Column, based on fully-porous hybrid particles, and a CORTECS C8 Column, based on solid-core silica particles. 

Benefits

  • Increases in selectivity.
  • Increases in efficiency.
  • Up to a 290% increase in resolution.

Introduction

Structurally similar compounds can be difficult to separate, making the development of rapid chromatographic methods for them very challenging. Changing the column stationary phase is one important tool to provide increased resolution. Using smaller and/or solid-core particles can improve efficiency. However, another source of increased resolution can be selectivity differences inherent in the stationary phase. While it is most common to vary the bonded phase chemistry, selectivity differences may also be achieved by varying the base particles. This application shows an example of this effect by comparing the separation of seven structurally similar catechins on an XBridge BEH C8 XP Column, based on fully-porous hybrid particles, and a CORTECS C8 Column, based on solid-core silica particles.

Experimental

A sample containing (-)-epigallocatechin (200 µg/mL), (+)-catechin (100 µg/mL), (-)-epigallocatechin gallate (100 µg/mL), (-)-epicatechin (100 µg/mL), (-)-gallocatechin gallate (100 µg/mL), (-)-epicatechin gallate (200 µg/mL), and (-)-catechin gallate (100 µg/mL) was prepared in 1:1 v/v methanol:water.

Instrument:

ACQUITY UPLC H-Class

Data management:

Empower 3 CDS

Method conditions

Columns:

XBridge BEH C8 XP, 2.5 μm, 3.0 x 50 mm (p/n: 186006045)

CORTECS C8, 2.7 μm, 3.0 x 50 mm (p/n: 186008359)

Mobile phase A:

Water

Mobile phase B:

Methanol

Mobile phase C:

2% Formic acid in water (autoblended to 0.1% formic acid)

Gradient:

75:20:5 of A:B:C to 45:50:5 of A:B:C in 2.50 min (2.5 μm column) 75:20:5 of A:B:C to 45:50:5 of A:B:C in 2.70 min (2.7 μm column)

Flow rate:

0.85 mL/min (2.5 μm column) 0.79 mL/min (2.7 μm column)

Column temp.:

25 °C

Detection (UV):

280 nm

Injection volume:

1 μL

Results and Discussion

Catechins are a family of flavan-3-ol polyphenolic compounds found in many plants which are associated with a variety of health benefits. A mixture of green tea catechins was prepared and included different isomer groups of catechin and gallocatechin, plus some of their gallate derivatives as shown in Figure 1. 

Structures of seven catechins.
Figure 1. Structures of seven catechins.

This mixture was separated using an XBridge BEH C8 XP, 2.5 µm, 3.0 x 50 mm Column (p/n: 186006045) with a rapid method where all compounds elute in under 2 minutes, Figure 2. Components 4 and 5 formed a co-eluting critical pair with these conditions.

Separation of catechins on an XBridge BEH C8 XP, 2.5 µm, 3.0 x 50 mm Column.
Figure 2. Separation of catechins on an XBridge BEH C8 XP, 2.5 µm, 3.0 x 50 mm Column.

However, when using a column containing the same C8 chemistry but based on CORTECS solid-core silica particles, the critical pair was well separated, as shown in Figure 3. As anticipated, a resolution improvement from narrower peaks occurred due to the higher efficiency of the CORTECS Column, but the observed increase was larger than expected. 

Figure 3. Separation of catechins on a CORTECS C8 2.7 µm, 3.0 x 50 mm Column.

In order to assess factors besides the solid-core efficiency advantage that could influence resolution, relationships between resolution and column-analyte parameters need to be considered. From isocratic chromatography theory, resolution (Rs) arises from the combination of column efficiency (plate count, N), analyte selectivity (α), and analyte retention (retention factor, k). There are several equations that can be derived to express such relationships but one of the most common is by Purnell, eq 1. The subscripts indicate that, for this equation, the plate count and the retention factor for the second peak of an analyte pair are needed to estimate resolution. One can determine N, α, and k for pairs of analyte peaks in an isocratic chromatogram and utilize such a relationship to parse out the relative contributions to resolution from these three sources.

However, the catechins mixture separation used here is a gradient method. In linear gradient chromatography, the elution strength of the mobile phase is constantly increasing and the gradient peak properties of efficiency, selectivity, and retention are likewise changing. At any given moment, there are instantaneously isocratic values of N, α, and k for each peak, but such values are not directly measureable. All that can be observed from a gradient chromatogram are the average values of these parameters which are represented here as N*2 , α*, and k*2 . Substitution into eq 1 provides the version of the derived Purnell resolution equation for gradient chromatography, eq 2.

(1)

Equation 1

(2)

Equation 2

Equation 2 plus eqs 3, 4, 5, and 6 for the values of efficiency (USP definition), retention factor, selectivity, and measured resolution (USP definition) were employed in this application note to compare the estimated gradient resolution (from eq 2) to the measured gradient resolution (from eq 6). After examining these values, the contributions of each term in eq 2 to the resolution differences observed for the critical pair were then examined.

(3)

Equation 3

For peak i with retention time of tri and width Wi at the baseline between tangent lines drawn at half height.

(4)

Equation 4

For peak i at retention time of tri and an unretained peak at retention time t0.

(5)

Equation 5

For consecutive peaks m and n.

(6)

Equation 6

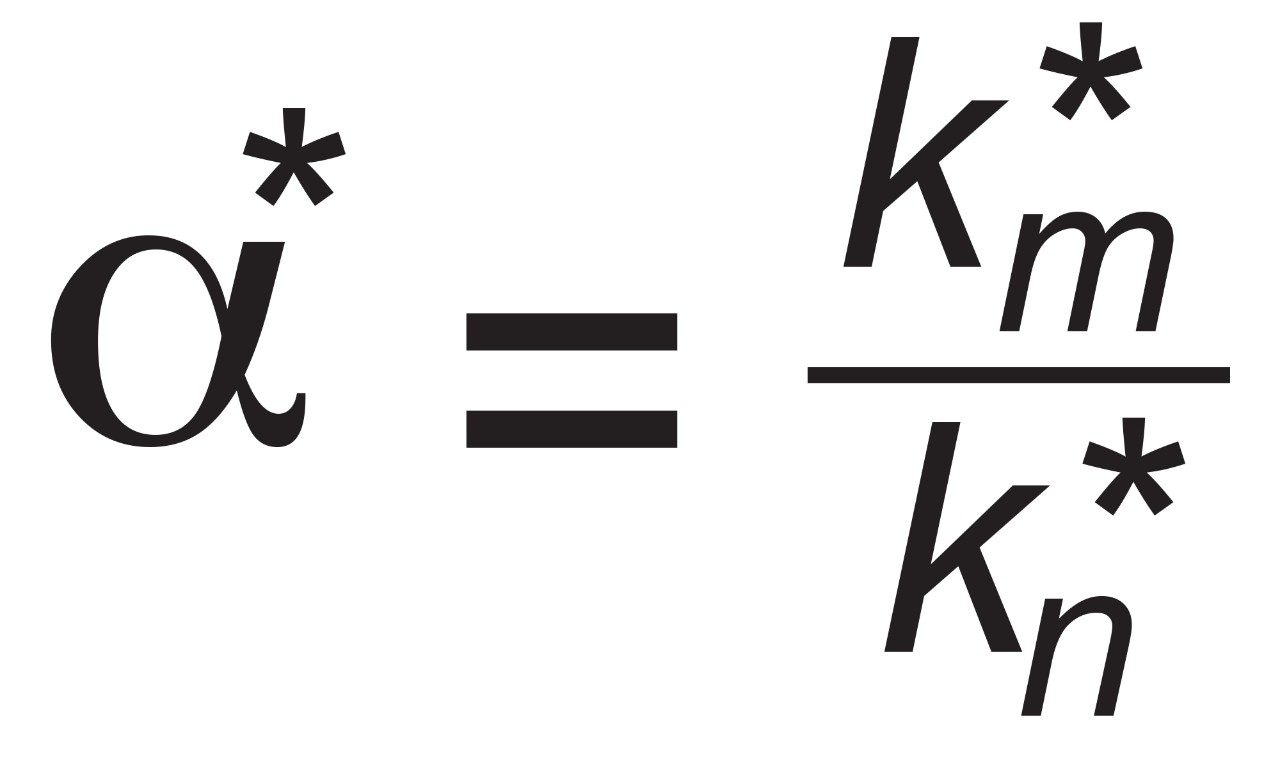
For consecutive peaks m and n with peak widths W at baseline between tangent lines drawn at half height.

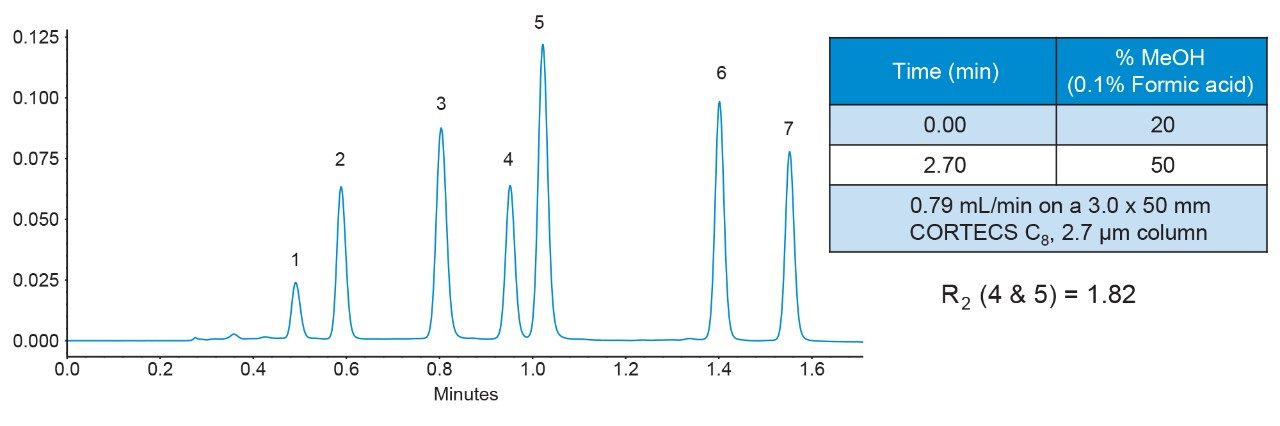
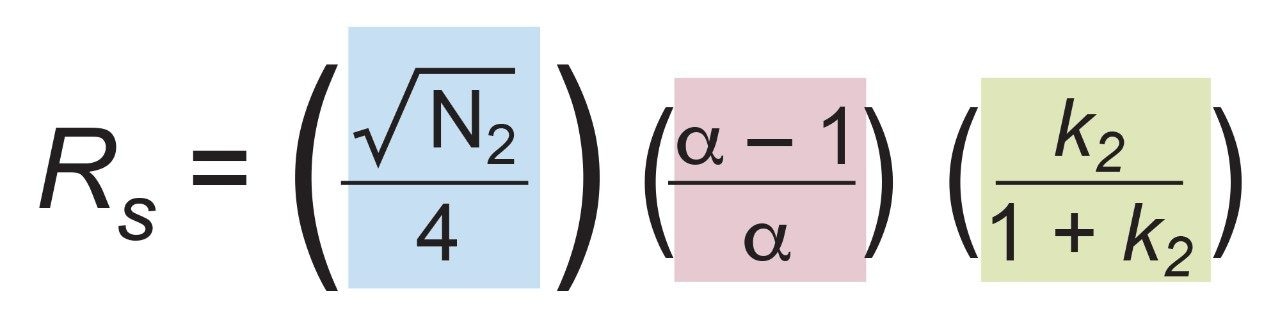
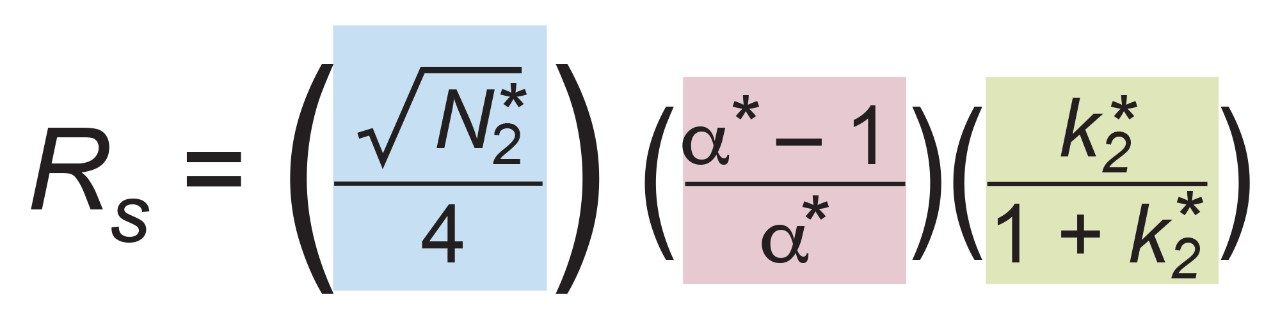
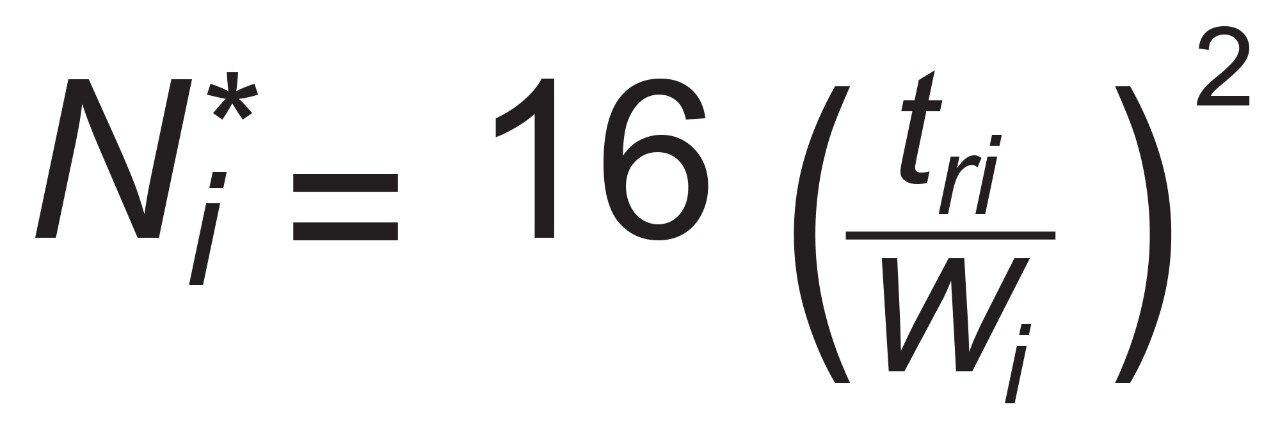
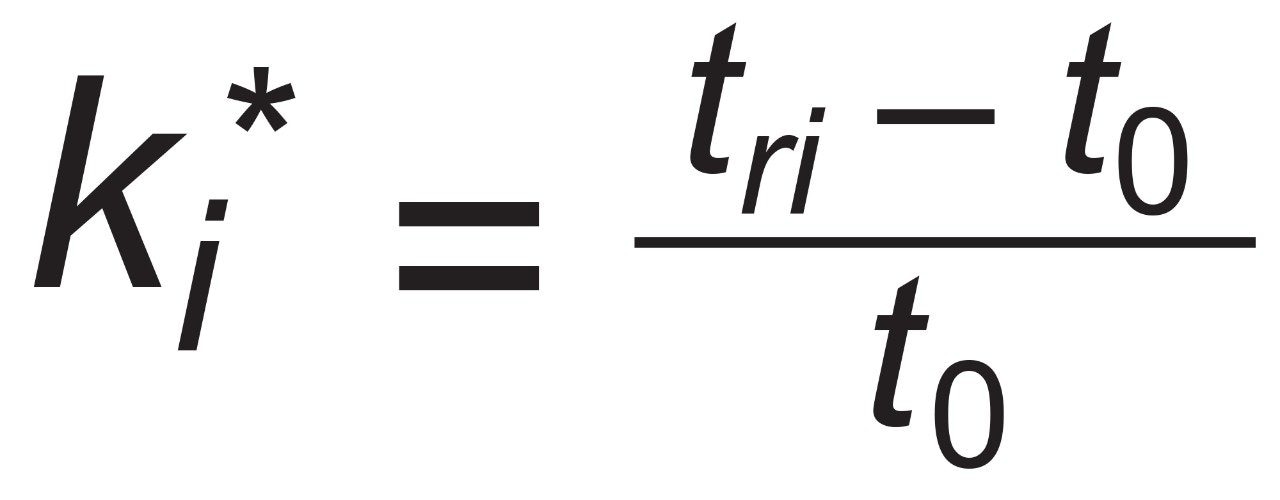
With the CORTECS C8 Column, a measured Rs = 1.82 was obtained for critical pair components 4 and 5 from the chromatogram in Figure 3 and eq 6. Values of N*2 and k*2 (for the second peak, component 5) plus α* from this chromatogram are noted in Table 1. With eq 2, the three terms could then be calculated to give the efficiency term, N*= 25.8, selectivity term, α* = 0.115, and retention term, k* = 0.609; see Table 1. This provided an estimated resolution of Rs = 1.81 which closely matches the measured resolution.

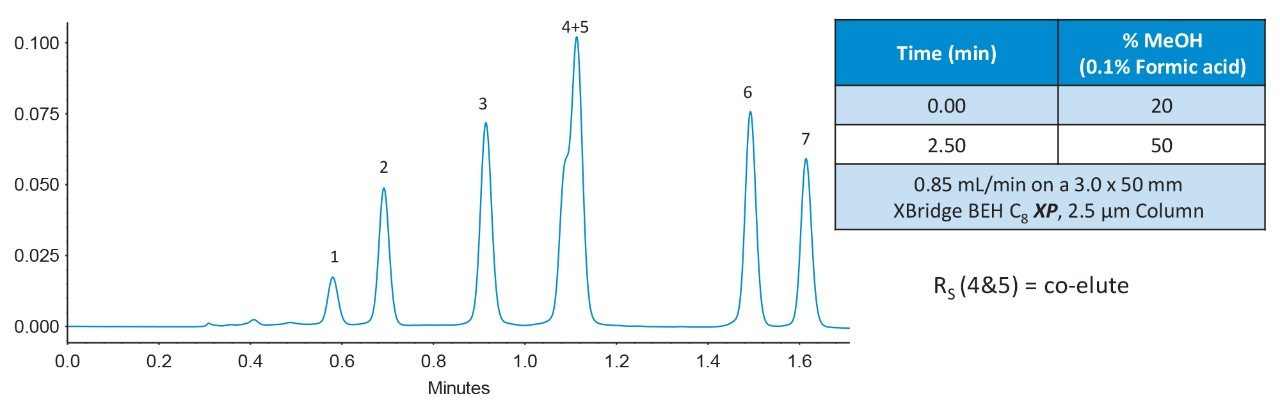
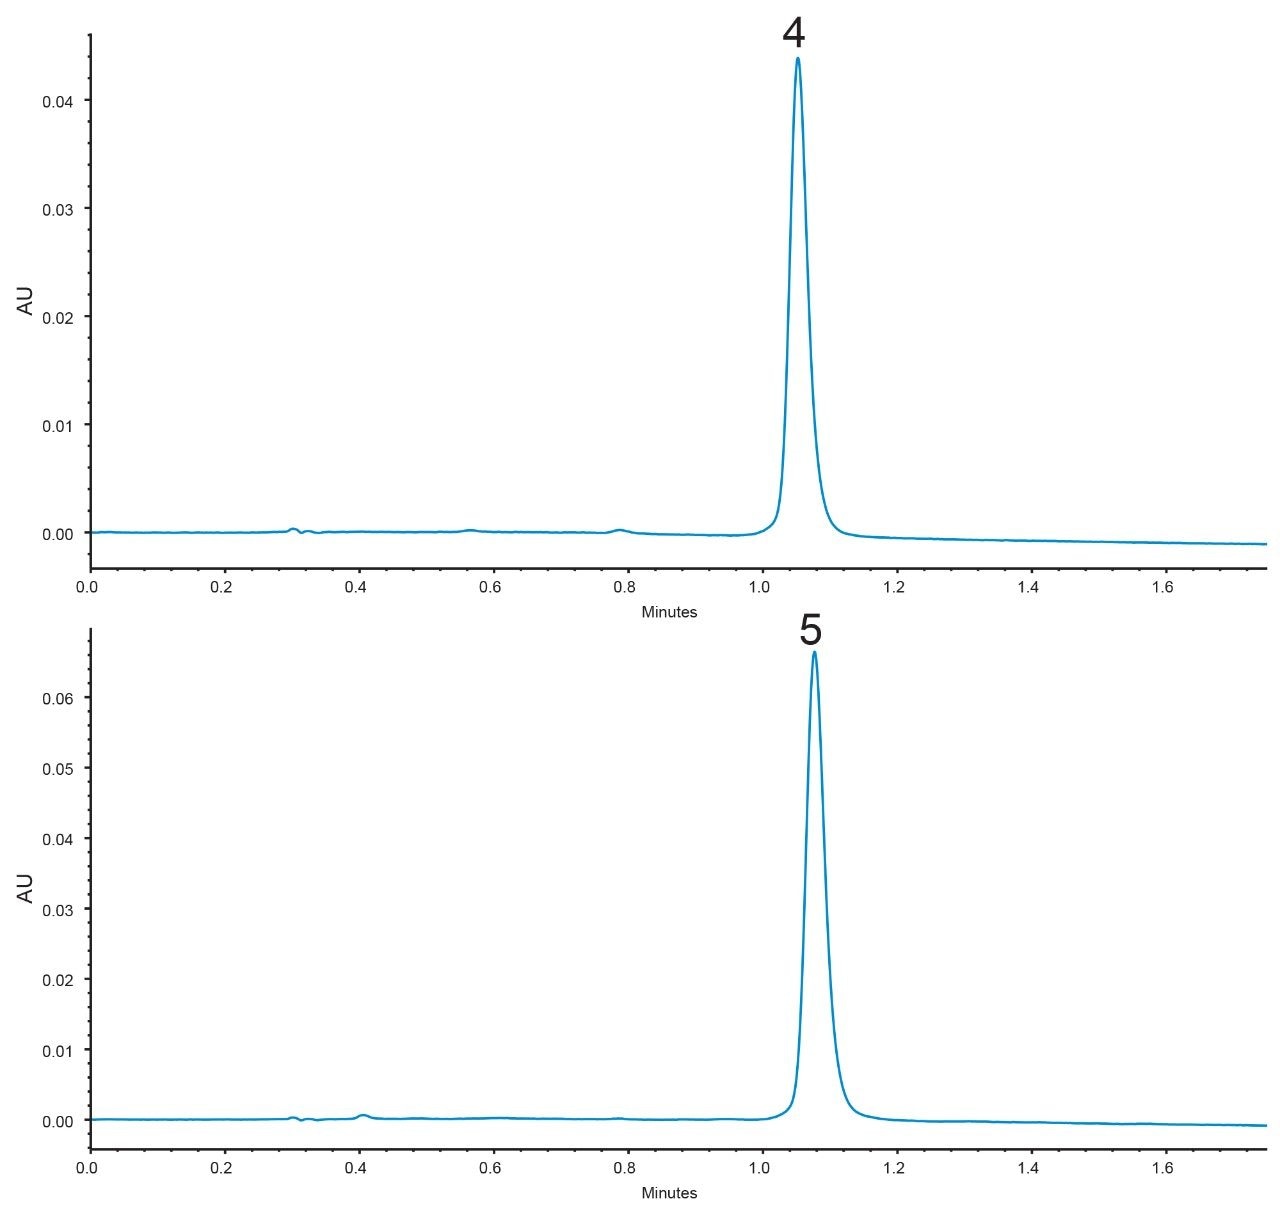
Since the XBridge BEH C8 XP Column exhibits co-elution for critical pair components 4 and 5, individual injections were performed under the same conditions. These chromatograms are shown in Figure 4. Using eq 6, a measured resolution of Rs = 0.47 was obtained. The CORTECS C8 Column therefore showed a 290% increase in measured resolution for the critical pair over the XBridge BEH C8 XP Column. From these chromatograms, values of N*2 and k*2 (for the second peak, component 5) plus α* were obtained and are shown in Table 1.

Again, using eq 2 gave the calculated efficiency term, N* = 19.9, selectivity term, α* = 0.035, and retention term, k* = 0.590; see Table 1. This provided an estimated resolution of Rs = 0.41. This is similar to the measured resolution of Rs = 0.47.

Individual injections for critical pair components 4 and 5 on an XBridge BEH C8 XP, 2.5 μm, 3.0 x 50 mm Column.
Figure 4. Individual injections for critical pair components 4 and 5 on an XBridge BEH C8 XP, 2.5 μm, 3.0 x 50 mm Column.
N*, a*, k* values and terms plus subsequent estimated Rs values compared to the measured Rs values for compounds 4 and 5 using XBridge BEH C8 XP and CORTECS C8 Columns.
Table 1. N*, α*, k* values and terms plus subsequent estimated Rs values compared to the measured Rs values for compounds 4 and 5 using XBridge BEH C8 XP and CORTECS C8 Columns.

Finally, after calculating each resolution contribution (N*, α*, and k* terms), the factor that increases critical pair resolution most between the XBridge BEH C8 XP and CORTECS C8 columns can be determined. The efficiency (N*) term increases by 30%, the selectivity (α*) term by 230% and the retention (k*) term by 3% when switching to the CORTECS C8 Column. Thus, while it was anticipated that the additional efficiency of the CORTECS Column would help increase the resolution, the selectivity term was found to be far more important in the 290% increase in measured resolution. This separation of structurally similar catechins is a good example of how the difference in selectivity between base particles, not bonded phase chemistries, can significantly benefit the resolution of a critical pair of analytes.

Conclusion

Optimizing resolution can be challenging for rapid separations of samples containing structurally similar compounds. Resolution is affected by three factors – efficiency, selectivity, and retention. High efficiency CORTECS C8 Columns can directly improve resolution through the efficiency factor. However, as seen in this separation of catechins, the selectivity factor may have a larger impact on resolution. The most common way to alter selectivity is by changing the bonded phase chemistry. Alternatively, a column containing the same bonded phase on different base particles can be tried. The separation of catechins illustrates well the potential selectivity difference for two different base particles. By using columns based on CORTECS solid-core silica particles instead of XBridge BEH hybrid particles, different selectivity, and thus higher resolution could be achieved even when both particles had the same C8 bonding chemistry. This resulted in a better separation of these structurally similar compounds.

References

  1. Flow rates were scaled using the Waters Column Calculator Version 2.0. Download and release notes: http://www.waters.com/waters/support. htm?lid=134891632&type=DWNL
  2. Foley, J. P. Resolution Equations for Column Chromatography. Analyst. 1991, 116, 1275–1279. 
  3. Snyder, L. R.; Dolan, J. W.; Chap 2. Gradient Elution Fundamentals. High-Performance Gradient Elution; John Wiley & Sons Inc.: Hoboken, New Jersey, 2007; p39.

720006038, July 2017

Back To Top Back To Top