This application note demonstrates how the addition of an ACQUITY QDa Mass Detector to LC-UV based workflows can improve the analysis of biotherapeutics.
Biotherapeutics have undergone rapid development with global sales of innovator and off-patent biologics forecasted to reach over $300 billion by 2020.1 Currently, many analytical methods used in the characterization and monitoring of biotherapeutics are HPLC-UV workflows based on US and EU Pharmacopeia monographs.2 While sufficient, many of these assays potentially lack the specificity needed to support the diverse portfolio of biotherapeutics coming to market in the near future. Recently, we discussed method modernization as part of a sound pharmaceutical quality system outlined by the International Committee of Harmonization (ICH Q10).3 New and innovative technologies, such as mass detectors offer the ability to enhance current UV-based techniques in the manufacturing environment for improved product knowledge and product quality. The ACQUITY QDa is a single quadruple mass spectrometer that can be easily integrated into an existing LC-UV-based workflow for the simultaneous collection of both UV and MS data, offering an efficient means to improve selectivity, sensitivity, and confidence in routine assays.4
Using insulin as an example, a high throughput LC-UV/MS workflow is used to demonstrate the applicability of the ACQUITY QDa to provide supplemental mass information for deeper product understanding in a manufacturing environment.
Insulin human, insulin lispro, and insulin glargine were purchased from USP, while insulin glulisine was from Besse Medical. Endoproteinase Glu-C from S. aureus was purchased from Promega. Digestion procedures were as outlined in the USP monograph: insulin human.3 HPLC grade water, acetonitrile, formic acid, difluoroacetic acid (DFA), and TFA were purchased from Fisher Scientific and used as received.
LC system: |
ACQUITY UPLC H-Class Bio |
Detectors: |
ACQUITY TUV Detector 5 mm flow cell, λ = 215 nm |
LC column: |
ACQUITY UPLC CSH C18 1.7 μm, 130 Å, 2.1 mm × 100 mm (P/N 186006937) |
Column temp.: |
40 °C for peptide mapping 60 °C for intact analysis |
Sample vial: |
12 × 32 mm glass vial Total recovery (P/N 600000750cv) |
Mobile phases: |
Water and acetonitrile |
MP additive: |
0.1% formic acid, DFA, and TFA |
Mass load: |
0.86 μg for peptide mapping 0.75 μg for intact analysis |
Time (min) |
Flow rate (min) |
%A |
%B |
---|---|---|---|
Initial |
0.300 |
95.0 |
5.0 |
2.00 |
0.300 |
75.0 |
25.0 |
22.00 |
0.300 |
65.0 |
35.0 |
23.00 |
0.300 |
20.0 |
80.0 |
24.00 |
0.300 |
20.0 |
80.0 |
24.01 |
0.300 |
95.0 |
5.0 |
30.00 |
0.300 |
95.0 |
5.0 |
Time (min) |
Flow rate (min) |
%A |
%B |
---|---|---|---|
Initial |
0.300 |
90.0 |
10.0 |
10.00 |
0.300 |
50.0 |
40.0 |
11.00 |
0.300 |
0.0 |
100.0 |
13.00 |
0.300 |
0.0 |
100.0 |
13.50 |
0.300 |
90.0 |
10.0 |
20.00 |
0.300 |
90.0 |
10.0 |
Mass range: |
350–1250 m/z |
Mode: |
ESI+ |
Collection mode: |
Continuum |
Sample rate: |
2 points/sec |
Cone voltage: |
10 V |
Probe temp.: |
500 °C |
Capillary voltage: |
1.5 kV |
Informatics: |
Empower 3 |
Identity, purity, and stability tests are common assays routinely performed in regulated environments such as QC labs. However, legacy UV-based methods such as these may not be optimized for MS compatibility due to ion-pairing choice (TFA) or buffer additives such as salt, which can impair MS performance.2 To this end, a degree of method development may be necessary in the evaluation of new technology such as MS. In the case of identity tests for insulin analogues, a high throughput LC-UV/MS method was developed using formic acid as a mobile phase additive for improved MS-performance. As shown in Figure 1A, with a 10 min gradient from 10% to 40% acetonitrile, peptides from a Glu-C digested insulin were well resolved and MS data (Figure 1B) were acquired simultaneously for each peptide fragment (I-IV) using the ACQUITY QDa. However, the above condition was not suitable for insulin glargine, as shown in Figure 2 with the co-elution of peptide fragments III and IV. While the gradient could be extended to resolve the peaks at the cost of analysis time, an alternative approach is to change the selectivity of the separation through choice of mobile phase additive (e.g. ion pairing agent). Previous studies have reported enhanced resolution using difluoroacetic acid (DFA) for a monoclonal antibody separation compared to formic acid.5
Along with TFA and formic acid, the effect of DFA on critical pair resolution (Peak III and IV in glargine digest) was studied while keeping the gradient slope unchanged (Figure 3A). As shown in Figure 3B, the chromatographic results indicated that TFA and DFA provided baseline resolution above the USP criteria of 1.5 (dashed line) in comparison to formic acid. However, the ion pairing reagent can also affect the ionization efficiency of analytes and must be considered in conjunction with the desired resolution. As shown in the bar plot of MS signal to noise ratio (Figure 3C), TFA provides the lowest MS intensity for most peaks where DFA offered acceptable resolution with marginal impact on MS response in comparison to the often preferred formic acid, and therefore DFA was selected as the ion-pairing agent moving forward.
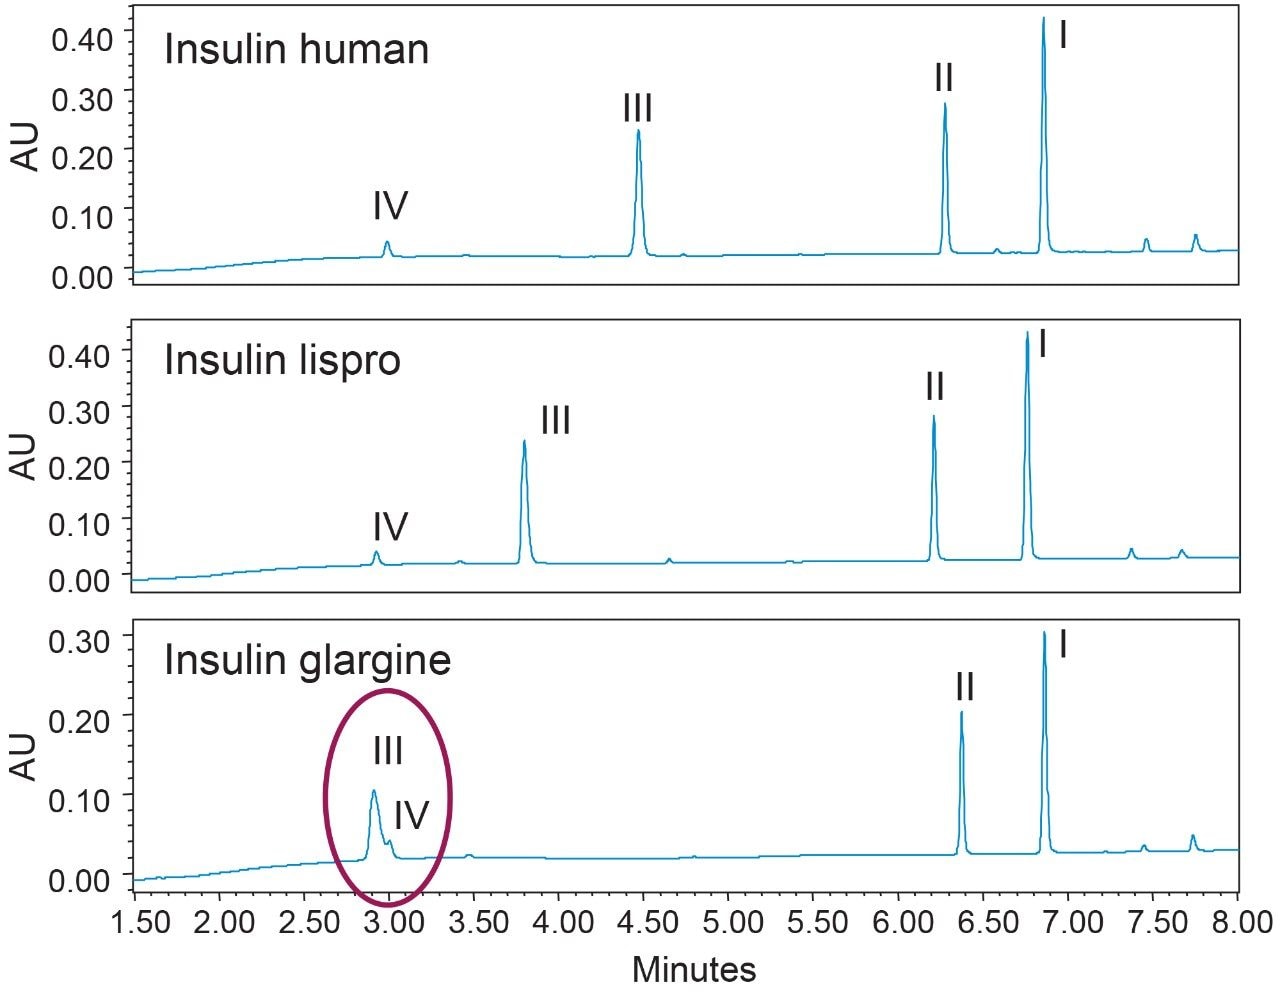
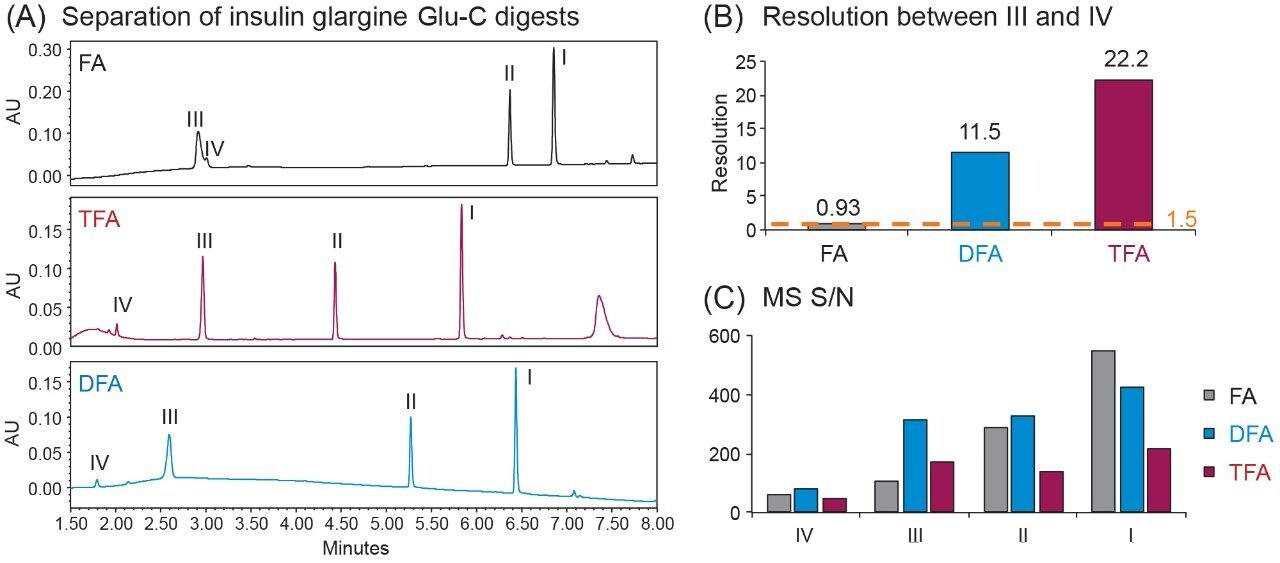
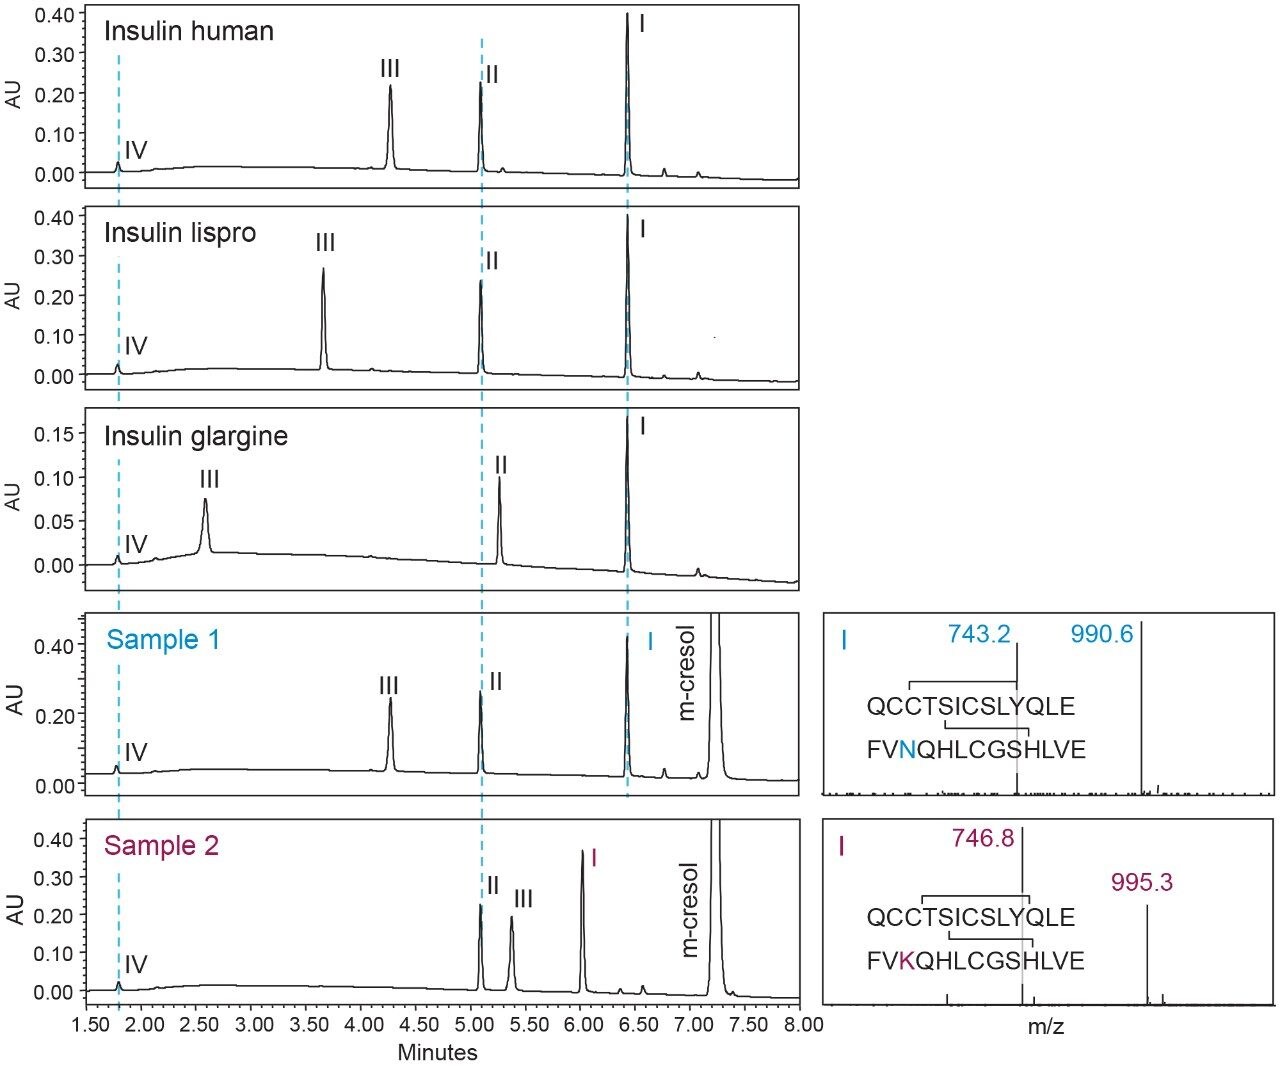
One of the benefits of adding MS detection to UV-based identity tests is the complementary mass information provided for investigation of the failed tests. Using the same gradient as the DFA in Figure 3, an LC-UV/MS based platform method was developed with three insulin analogues as reference standards, including insulin human, insulin lispro, and insulin glargine. As shown in Figure 4, all peaks were well resolved while the peptide fragments (Peak I, II, IV) with the same peptide molecular weight were aligned across samples as indicated by the blue dash lines. Using this platform method, an identity test was performed on two insulin drug products: Sample 1 and 2. As shown in Figure 4, the retention times of peptide peaks in sample 1 were aligned well with insulin human, while Peak I and III of Sample 2 shifted significantly. According to the collected MS data, a delta mass difference of 14.7 Da and 100.2 Da was observed for fragment I and III respectively (Figure 4), suggesting the inconsistency in retention times was caused by a single amino acid change in fragment III (KT to E) and I (N to K). Based on the sequence information, Sample 2 was identified as another insulin analogue: insulin glulisine. Collectively, the developed method demonstrates high robustness and specificity as a platform assay for identity test of various insulin analogues.
Another benefit of using orthogonal detection is verifying purity assessment of intact insulin with mass information. UV detection alone provides limited information about peak purity. With added mass information, purity of the target peak can be evaluated via the built-in mass analysis function within Empower CDS. Figure 5A shows the separation of intact insulin human using the gradient conditions optimized for peak-to-peak resolution. With a 20 min gradient from 25% to 35% mobile phase B, three impurity peaks were separated from the main peak. In the Empower mass analysis window (Figure 5B), the MS spectra are displayed for the leading, apex, and trailing edge of the main peak via an automated processing method. In this case, the apex and trailing window showed almost identical MS spectra, suggesting the main peak is pure and free of significant amounts of co-eluting impurities.
The addition of orthogonal mass detection can also be used to improve product understanding during stability testing. A commonly used approach to monitoring the stability of protein based drug products is to run a peptide map and look for new peaks and/or shifts in peaks over time that may be indicative of degradation occurring. Taking insulin human peptides as an example, the Peak I and II degraded over time at room temperature and yielded Peak I’ and II’, as shown in Figure 6A. According to the MS data (Figure 6B), the Peak II and II’ were observed to have a mass shift of +1 Da, suggesting this degradation could be from deamidation (N to D). Similarly, the +17 Da mass difference between I and I’ suggests the spontaneous transfer from glutamine to pyroglutamic acid on the terminal amino acid. With proper method development, this workflow can be transferred to other biotherapeutics for monitoring degradation and product stability.
This application note demonstrates how the addition of an ACQUITY QDa Mass Detector to LC-UV based workflows can improve the analysis of biotherapeutics. Using DFA as mobile phase additive, an LC-UV/MS-based platform method was developed as an identity test for insulin analogues with high chromatographic resolution and MS sensitivity. Purity and stability tests were also performed on intact or digested insulin analogues, showing improved specificity using orthogonal MS data. Together, the data showed how the addition of the ACQUITY QDa can improve the confidence and productivity when carrying out routine analysis of biotherapeutics.
720006157, November 2017