For forensic toxicology use only.
This application demonstrated the automated and fast method development capability of the ACQUITY UPLC with 2D Technology for the analysis of synthetic cannabinoids in urine, plasma and edible samples. The quantification limit was set at 50 ppt using a 1.0 g of sample. The micro extraction protocol offered the option to evaluate several elution parameters in a short time period. The elution optimization was completed within a 4 hrs hands-on work and the 2D LC results were analyzed using an over-night run multi-methods sample list (18 hrs). With the extraction protocol optimized, the final protocol produced a clean extract in 30 minutes without any evaporation to dryness and reconstitution into initial mobile phase conditions.
As stated by the Forensic Toxicology Council,1 the field of forensic toxicology deals with cases where drugs and/or chemicals have led to a death situation. An important function of the field relates to death investigation toxicology, also known as postmortem toxicology analysis. Since results are likely to be used in a court of law, therefore the accuracy and precision of the analytical technique is an essential prerequisite.
The core focus of a forensic toxicology laboratory is to determine the presence or absence of drugs in seized evidence. The target matrix can be in solid format, such as pills and powders, or biological materials (blood, plasma, urine, saliva, hair, and tissues). The analytical techniques currently available are divided into two categories, some platforms are used for screening methods (qualitative) and other solutions are used for confirmation methods (quantitative). Most laboratories are usually equipped with gas chromatography (GC) or liquid chromatography (LC) hyphenated to a mass spectrometer (MS). For several decades, GC/MS was the tool of choice for bio-analysis. However, with the introduction of atmospheric pressure ionization technique, LC/MS is now the most popular technique in the field of forensic toxicology.
Detection and quantification of drugs in complex matrices are difficult to accomplish due to time-consuming extraction processes as well as the difficulty to detect analytes at trace levels. A robust extraction and clean up methodology, in which a homogenization step precedes, is a must in order to reach a targeted limit of detection (LOD) as well as maintain robust and reliable instrument performance. The use of advanced hyphenated instrumentation platforms, such as UPLC-MS/MS, has allowed analysts to detect trace levels of analytes.
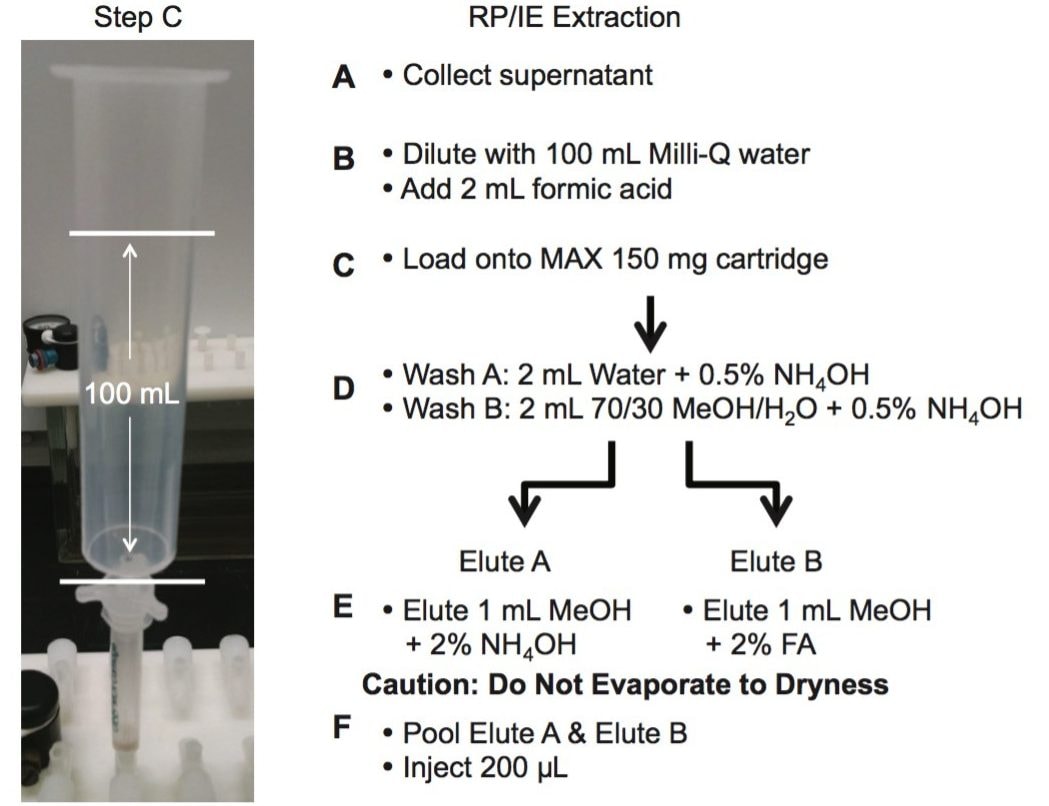
Traditional extraction techniques used in most laboratories are decades old and do not have the robustness to produce quality results. A novel micro extraction protocol, combined with a multi-dimension chromatography (2D LC-MS/MS), is described within, resulting in a decreased sample preparation time without sacrificing the quality of results often observed when utilizing current single dimension chromatography techniques.2,3,4
Two MRM transitions (quantification and confirmation) for all synthetic cannabinoids were selected and optimized. The MRM conditions are listed in Table 1.
For this application, finding the optimum extraction and chromatographic condition for this multi-residue analysis posed a significant challenge. As seen in Figure 1, the chemical diversity for the target analyte in the study covers a wide range of polarity. The chromatographic conditions were tested on several trapping chemistries (Oasis® HLB, XBridge C18, and XBridge C8) and separation chemistries (ACQUITY UPLC BEH C18). The loading (low pH, high pH, and neutral pH) and eluting mobile phase (MeOH + 0.5% formic acid & ACN + 0.5% formic acid) were also optimized using an automated 6 x 6 process.
The extraction protocol for the urine and plasma was performed by measuring 2 mL of sample in a 15 mL glass centrifuge tube, followed by the addition of 2 mL of acetonitrile (See Figure 2 and 3). The sample crash was centrifuged at 4000 rpm for 5 min and the supernatant collected for further extraction. The supernatant was collected and diluted in 100 mL of Milli-Q water. The extraction process was performed on pre-conditioned mixed mode reversed-phase/ion exchange sorbent (6 cc Oasis MAX SPE barrel). The MAX ion exchange mixed mode utilize a strong embedded basic group to capture acidic functionality. The mixed mode approach yields two eluting fractions, one fraction comprised of neutral and basic entities (RP) and the other fraction concentrating the analytes with acidic functionalities (IE). The Oasis MAX Cartridge was precondition with 2 mL of MeOH, followed by 2 mL of water. The 100 mL dilution volume was loaded on the cartridge at 10 mL/min. The cartridge was washed with 2 mL water with 0.1 N NH4OH, followed by 2 mL of a 70/30 MeOH/H2O with 2% NH4OH. The target synthetic cannabinoids were eluted with 1 mL MeOH with 5% NH4OH (RP) and followed with 1 mL MeOH with 5% formic acid (IE).
The extraction protocol for the edibles required a homogenization step prior the SPE process. In this instance, two techniques were evaluated to transform the solid sample into a solution. The first technique was the orbital homogenization with ceramic ball bearing using three solvents for solubility (MeOH, ACN, and acetone). The second approach utilized a simple dissolution using heating process at 80 °C with MeOH, ACN, and Acetone. The edibles were cut in small pieces and a 1 g sample was use for dissolution at various volumes (3, 4, and 5 mL).
The elution were pooled together and 20 µL of IS mix (JWH-018 D11, from an acetonitrile stock solution of 100 ppb) was added to the final 2 mL elution volume to attain a final internal standard (IS) concentration of 1 ppb. The use of a 2D LC-MS/MS technology eliminates the need for an evaporation step in the extraction method. The manual extraction and sample preparation of the bone samples was completed in less than one hour. The analysis was performed using 200 µL of the final (MeOH) extracts
Column: |
XBridge C8, 10 μm–80 mg (2.1 x 30 mm) |
Loading: |
Milli-Q water + 2% NH4OH (pH 10) |
Flow rate: |
2 mL/min |
AT-column dilution: |
% (0.1 mL/min Loading pump and 2 mL/min Diluting pump) |
UPLC system: |
ACQUITY UPLC with 2D Technology configured for “Trap & Elute” with AT-column dilution |
Run time: |
10 min |
Column: |
ACQUITY UPLC HSS T3, 1.8 μm, 2.1 x 50 mm |
Column temp.: |
70 °C |
Mobile phase A: |
Water + 0.5% formic acid |
Mobile phase B: |
Methanol + 0.5% formic acid |
Elution: |
5 minute linear gradient from 5% (B) to 95% (B) |
Flow rate: |
0.600 mL/min (Elution pump) |
Injection volume: |
200 μL |
MS system: |
Xevo TQD |
Ionization mode: |
ESI+ |
Capillary voltage: |
3.0 kV |
Cone voltage: |
90.0 V |
Source temp.: |
150 °C |
Desolvation temp.: |
550 °C |
Desolvation gas: |
1100 L/hr |
Cone gas: |
50 L/hr |
The analysis of started with the chromatography optimization of the 2D LC-MS/MS. The 2D LC-MS/MS was setup as depicted in previous applications.2,3,4 The configuration was constructed with one binary pump and two quaternary pumps. The binary pump was set for gradient elution and the quaternary pumps were plumbed for At-column dilution to create two distinct streams (loader and dilutor). The loader pump was set 0.1 mL/min for loading the extracts from the injection loop onto a 50 μL mixer, while the dilutor pump was set at 2 mL/min flow rate for a 5% dilution ratio following a re-focusing effect on the trap column.
The next phase of the optimization was to evaluate the trapping and elution conditions. As seen in previous publications, a 6 x 6 2D LC evaluation grid gives an excellent starting point to provide an overview of the chromatographic behavior for a target analyte. For this application, the 2D LC optimization process focused with 16 methods selected from the 6 x 6 chart. The results are tabulated in Table 2. The color coded chart was created to identify which analytical conditions give the best chromatographic profile with a quick visual survey. The green box depicts a Gaussian peak shape for quantification analysis. The yellow box was used to flag chromatography issues, such as peak split, tailing, shoulder or leading profiles. Finally, the red box indicates an absence of signal, most likely due to breakthrough effect during loading phase on the trap column or poor elution from the trap onto the analytical column. As seen in Table 2, four methods (10, 16, 19, and 25) show quantitative profiles. After quick evaluation, method 25 was selected for this application and updated with the HSS T3 column (see Figure 4).
With a multidimensional configuration, the problems associated with carryover can be resolved by adding a recondition/equilibration step after elution of the synthetic cannabinoids. As seen in Figure 5, the bottom left chromatogram shows a 10 ppb spike and followed by 3 blank injections of water. The result shows a 10% residue on the first water blank. The loader and dilutor pumps were configured with line D as a recondition solution at 1:1:1 ratio of methanol, acetonitrile, and acetone. The recondition solution was pushed throughout the entire loading circuit including the injection port after the completion of the elution cycle. The reconditioning step was performed for 2 minutes followed by a complete re-equilibration with the starting loading conditions. The result shows, in the bottom right chromatogram, a net improvement with a carryover signal well below the 50 ppt limit of quantification.
The first step of optimizing the extraction process targeted the choice of the sorbent. From the chemical structures shown in Figure 1, the synthetic cannabinoids show a wide range of chemical moities. All analytes have a linear carbon chain linked to an amine functionality. Two analytes have a carboxylic acid group at the end of the aliphatic chain. With this type of chemical structure, the choice of sorbent for solid phase extraction can be quite large. In this instance, two mixed-mode sorbents were selected for evaluation, the reversed-phase/Cation Exchange (Oasis MCX), and reversed-phase/Anion Exchange (Oasis MAX). Since the target analytes have both acidic and basic moities, several loading and elution conditions were evaluated to map the retentive behavior for each analytes.
Table 3 summarizes the three loading pH and two elution solvents that were evaluated for each sorbent. All washes and elution steps were also collected and quantified for a complete chromatographic profile. Since the K2 metabolites UR-144 and AB-PINACA both have a carboxylic acid moitie, the elution profile with Oasis MAX demonstrates a 99% recovery with the MeOH or ACN low pH elution, thus clearly indicating an acidic behavior with retention on the anion exchange sorbent. However, the other K2 metabolites show a retention affinity for all three sorbents at various percentages. For example, the K2 metabolite 5F-PB-22 shows a 40/60 ratio with the reversed phase/anion exchange sorbent. The ratio drops to 12/88 ratio with the reversed phase/cation exchange sorbent.
Because the five K2 metabolites show a dual retention (neutral and ionic) mechanism, the RP elution step was re-optimized for maximum recovery. In Table 4, a sequential elution at pH 3, 7, and 10 shows the complete retention behavior for all K2 metabolites. As it can be seen, the two K2 carboxylic acid metabolites elute at lower organic percentages. The other K2 metabolites elute at 90% and 100% elution. This elution profile can be used to optimize the RP elution. With the MAX sorbent, both carboxylic acid metabolites interact with the anion exchanger portion of the sorbent, whereas, the other five K2 metabolites retained by the reversed-phase interaction and therefore can be wash with 70/30 MeOH/H2O without any breakthrough issue. After the optimized wash, the analytes are eluted with 100% MeOH and pooled with the 100% MeOH with formic acid elution from the ion-exchange sorbent. The final 2 mL SPE MAX extracts now contains all 7 K2 metabolites. Figure 6 demonstrates chromatographic results for JWH-18, XLR-11, and UR-144 K2 metabolites between a standard and optimized MAX protocol. As expected for the acidic metabolites, both extraction protocols give excellent recovery. However for the XLR-11 and JWH-18 metabolite, the optimized MAX protocol clearly shows higher recoveries with the pooled elution approach.
The chromatographic profile for a methanol standard (un-extracted), water extracted standard, and a urine sample at 1 ppb level is shown in Figure 7. It is worth mentioning the stable baseline in both the water extract and urine extract. The extraction protocol is producing a very clean extract with an extraction time of 30 minutes. In this application, the JWH-18 D11 deuterated was utilized as internal standard (IS) for all synthetic cannabinoids. The post addition of the IS in water extract and urine extract shows a 7% and 8% matrix effect (suppression), respectively. These low matrix effect values reflect the cleaning efficiency of the optimized MAX extraction protocol for urine matrix.
The overall recovery ratio for urine, plasma, and edibles sample show that all recovery values, measured against a post spiked deuterated internal standard, are within an acceptable range of 75% to 112% (Table 5). When analyzing biological and food sample types, the extraction recoveries are most often overwhelmed by matrix effects, which can lead to either suppression or enhancement in the MS detector. These effects are related to the inability of the extraction protocol to remove interferences from the raw sample. Overall, the matrix effect is below 10% for the urine and edible samples. The plasma sample shows an 18% suppression effect, which lead to the conclusion that the optimized MAX extraction method may need further clean up. Since, the recovery values for all K2’s are well within acceptable recovery range, no further optimization work was deemed necessary. Urine samples from forensic cases showed trace level detection for all seven K2’s, with the exception of AB-PINACA with values ranging from 50 pg/mL (part per trillion–ppt) up to 191 ng/mL (part per billion–ppb) (Table 6).
The edible samples posed to be a challenge during extraction process, requiring a homogenization process to convert the solid sample into a compatible liquid for the SPE extraction. In this instance, a simple heating step was implemented for the edibles sample. A mixture of 50/50 water/methanol or 50/50 water/acetonitrile heated at 70 °C produced a colored and clear extract in about 30 minutes. For comparison purpose, another extraction technique using ceramic ball bearing at high speed was also evaluated for edible samples and surprisingly produced a similar extract quality in 5 minutes. As shown in Table 5, the 50/50 water/methanol solution produced good recovery values for six K2’s, with the exception of AB-PINACA at 63%. The extraction recovery for AB-PINACA can be increased to 103% by using a 50/50 water/acetonitrile instead. However, with the acetonitrile solution, the extraction shows a 0% extraction for UR-144 metabolite.
The overall performance of the optimized MAX extraction method gave an excellent linearity range as shown in Table 7. The R2 values for all analytes ranged from 0.993 to 0.998 values. The limit of detection (LOD) for all analytes gave a 3x signal at 0.001 ng/mL (ppt). The extraction protocol used for this application gave an excellent performance analyzing well over 1000 sample injections.
<LOQ: peak detected but not quantifiable.
ND: Not detected.
>2.5: greater than the upper limit of quantitation.
Table 7. Linear range and detection limits.
This application demonstrated the automated and fast method development capability of the ACQUITY UPLC with 2D Technology for the analysis of synthetic cannabinoids in urine, plasma and edible samples. The quantification limit was set at 50 ppt using a 1.0 g of sample. The micro extraction protocol offered the option to evaluate several elution parameters in a short time period. The elution optimization was completed within a 4 hrs hands-on work and the 2D LC results were analyzed using an over-night run multi-methods sample list (18 hrs). With the extraction protocol optimized, the final protocol produced a clean extract in 30 minutes without any evaporation to dryness and reconstitution into initial mobile phase conditions.
720006015, May 2017