Screening for reactive metabolites is commonly carried out in pharmaceutical drug discovery/development as part of the risk assessment of a compound, or compound class. The reactive metabolite hypothesis implicates bioactivation of drug compounds and subsequent haptenization or inactivation of proteins with clinical toxicity. To that end, significant effort has been made towards reducing the propensity of candidate drugs to undergo metabolic activation.
One way that reactive metabolites can be assessed is through the use of in vitro incubations fortified with trapping reagents such as glutathione (GSH). The formation of reactive intermediates can be followed by detection and characterization of “trapped” glutathione adducts using a variety of LC-MS approaches. Popular methods for detecting GSH conjugates include monitoring the ESI+ signature GSH neutral loss of 129,1 ESI- precursor ion scanning for the 272 diagnostic product ion,2 or using 1:1 stable isotope labeled GSH and detection based on a signature isotope difference with similar peak intensity under ESI- conditions.3
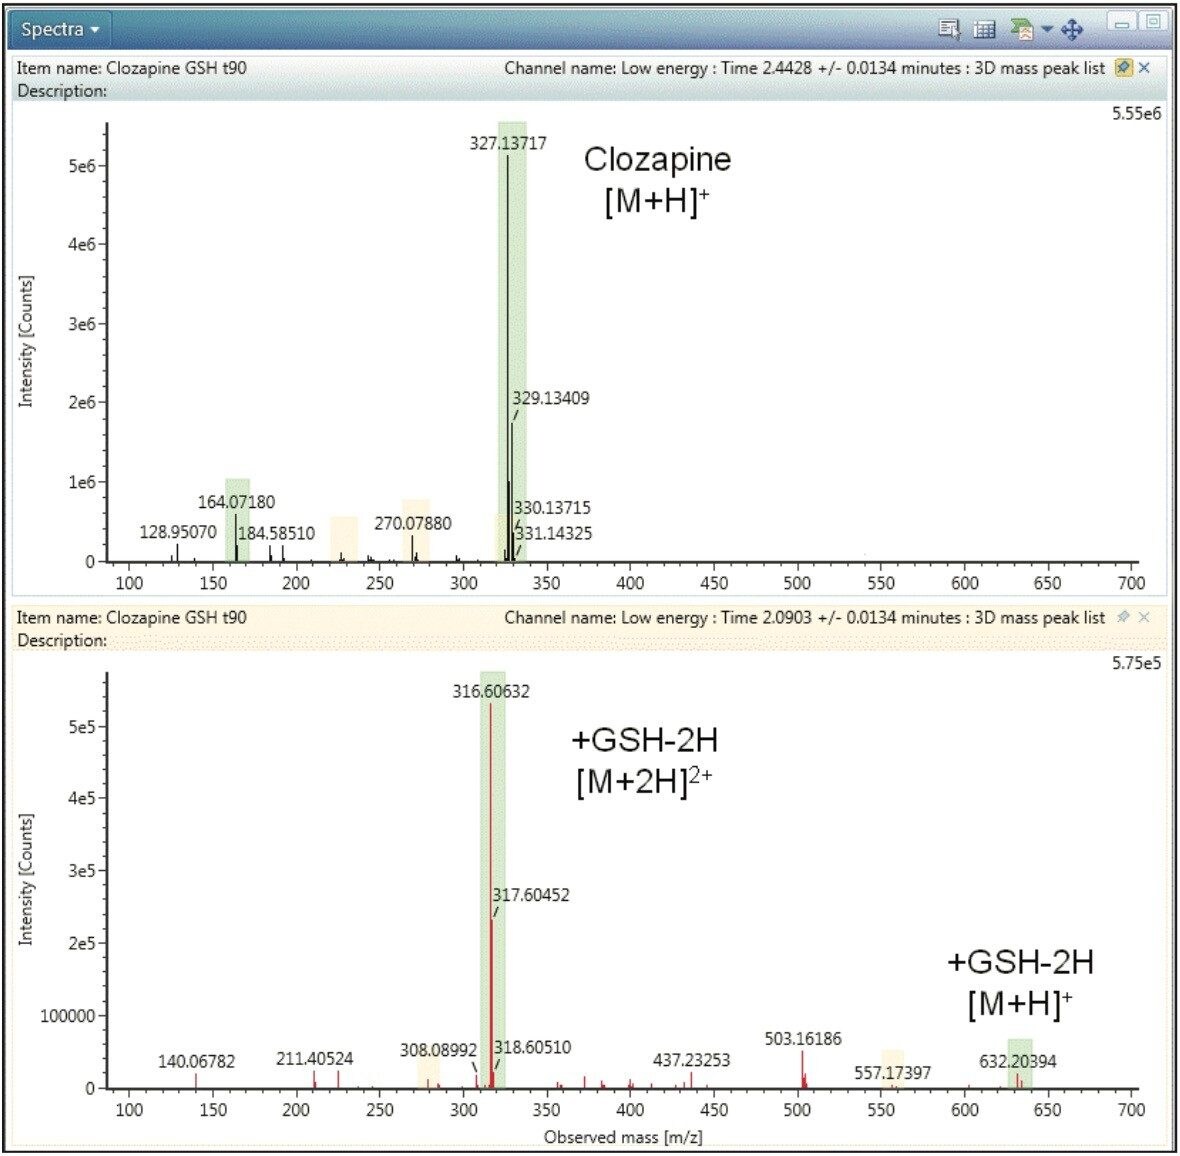
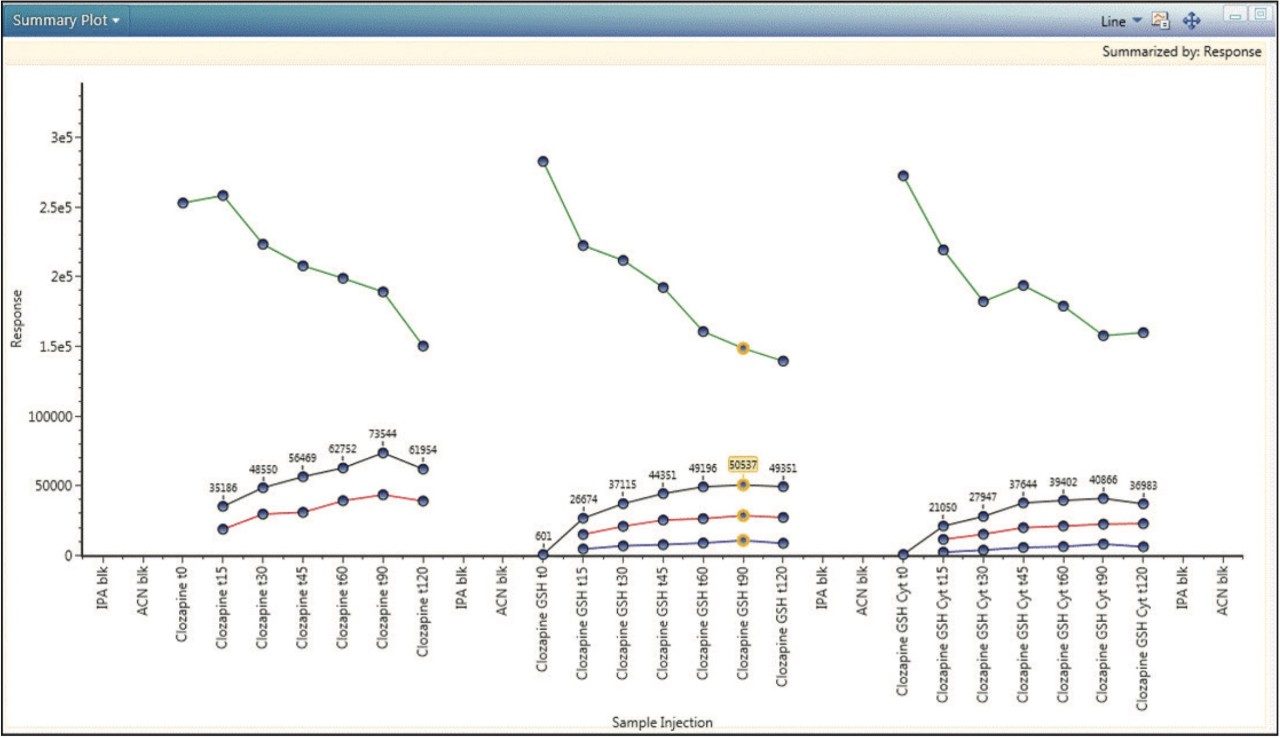
In addition to understanding the rate and pathways of formation for glutathione-containing metabolites, information on parent compound is often desired to estimate conversion rate of the compound in the study. Another complication of glutathione adducts is that they often exist as multiple-charged species with detection based on positive electrospray ionization, the widely used ionization technique for the majority of parent compounds. A failure to detect metabolites at low levels, and low and/or variable response for precursor ions and their product ions, can result in false negatives.
High-resolution mass spectrometry (HRMS) approaches are becoming more popular as gathering detailed precursor and product ion information is possible. Software tools can then comprehensively interrogate full scan data for expected and difficult-to-predict reactive intermediates.
Since Waters introduced MSE based data acquisition, which provides simultaneous acquisition of full scan precursor and product ion data, it has been possible to perform a generic data acquisition and produce fragment ion information in a non-selective manor, thus simplifying data acquisition.4
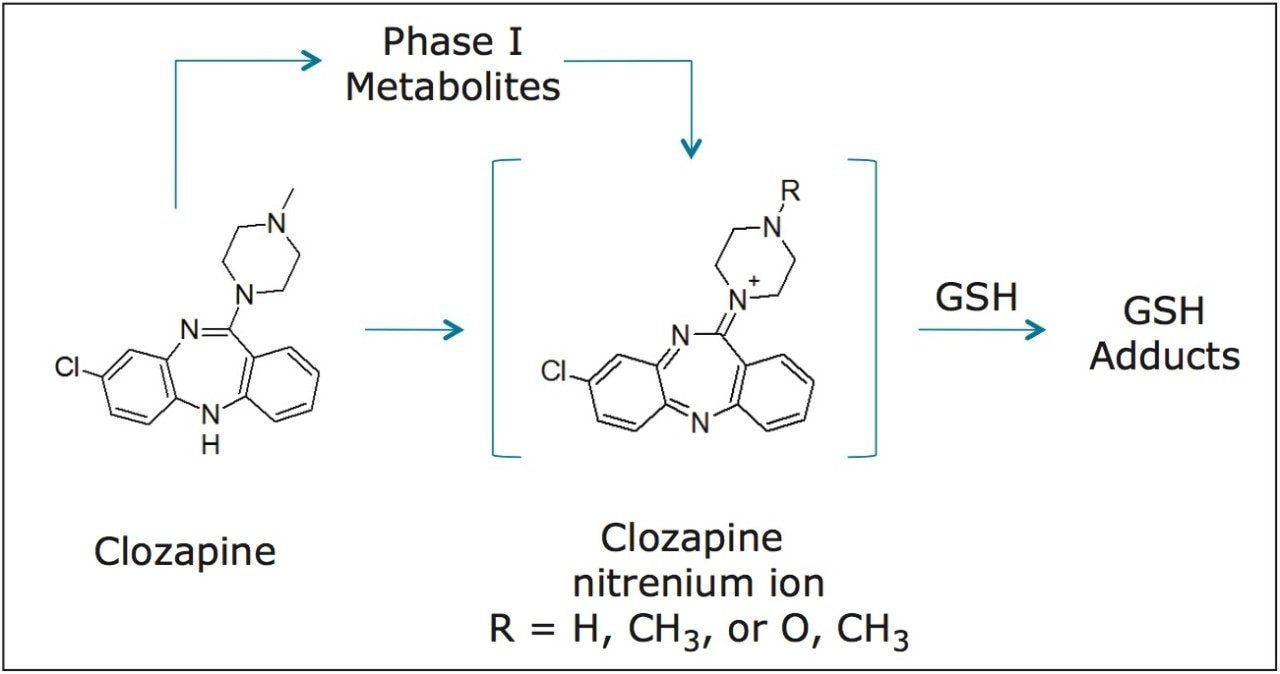
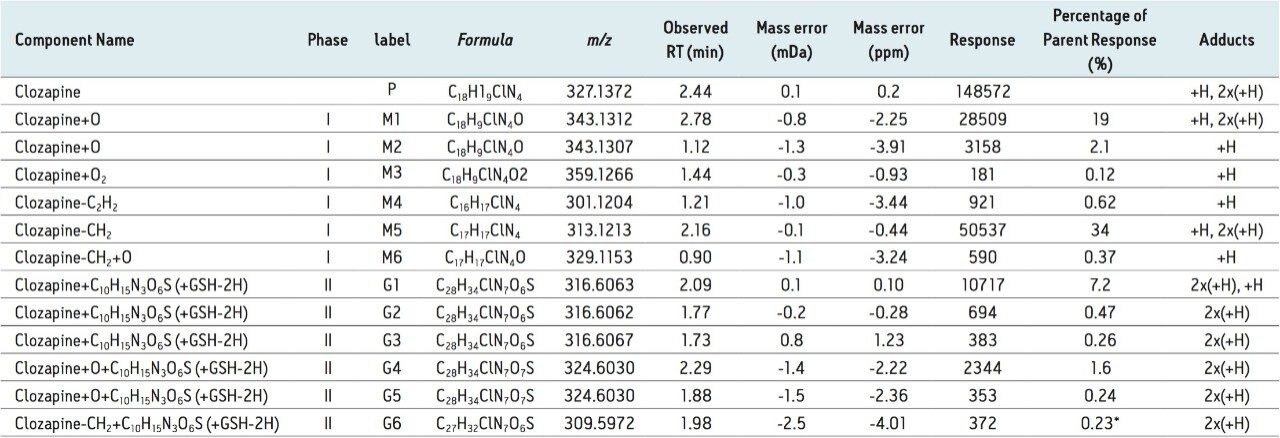
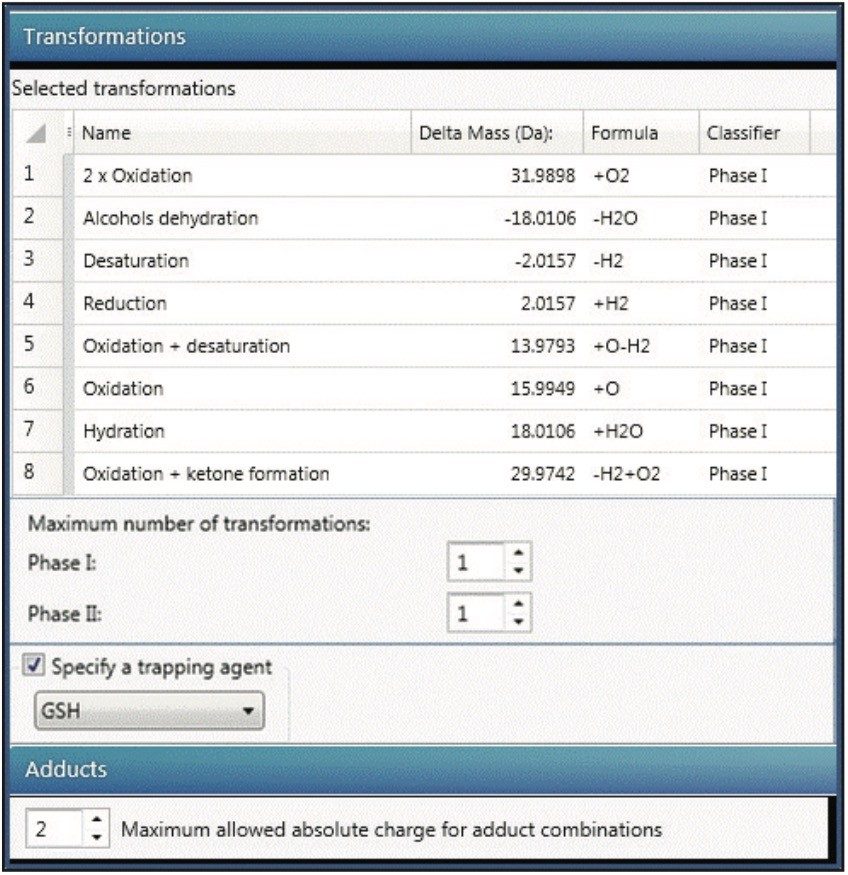
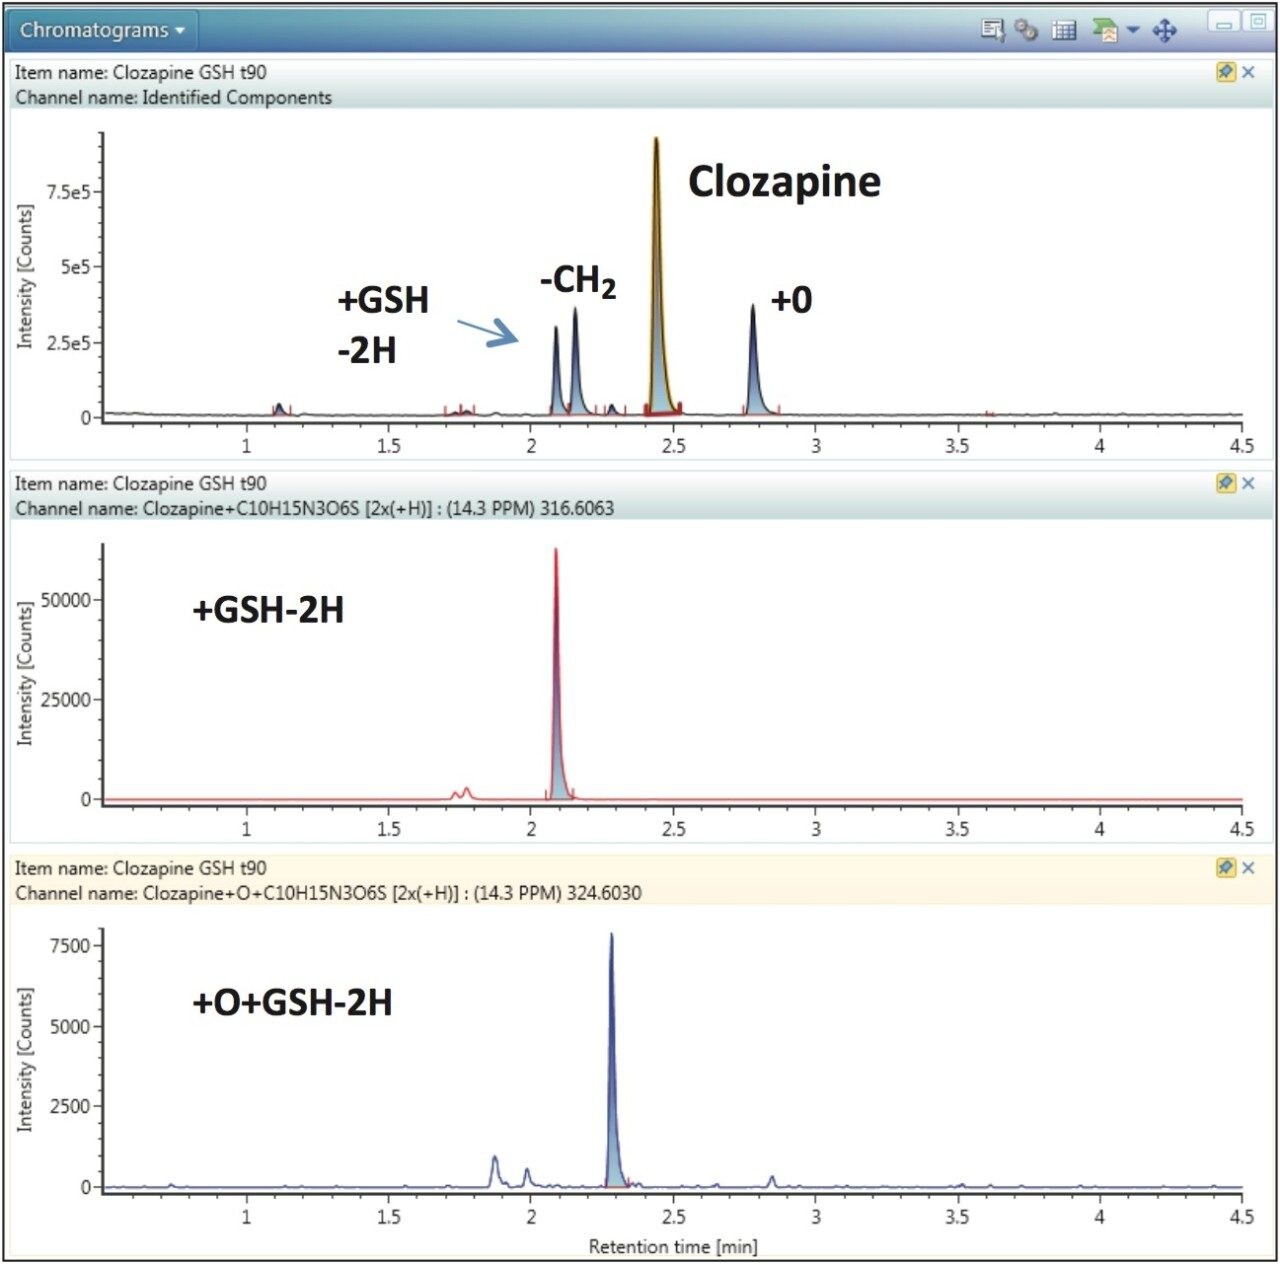
This application note demonstrates the use of MSE data acquisition for detecting reactive metabolites using clozapine as a model compound. Through integrated charge state deconvolution and detection using the Metabolite Identification Application Solution in UNIFI, all metabolites, including parent, phase I metabolites, and phase II GSH conjugates are detected and tracked across the dataset automatically.