• Application Note

Rapid Analysis of Pharmaceutical Compounds in Dried Blood Spots using UPLC and Tandem Quadrupole MS/MS

Rapid Analysis of Pharmaceutical Compounds in Dried Blood Spots using UPLC and Tandem Quadrupole MS/MS

  • Joanne Mather
  • Paul D. Rainville
  • Waters Corporation
Dried blood spot test

Abstract

This application note demonstrates the use of ACQUITY UPLC coupled with Xevo TQ MS for method development and high sensitivity quantification of drugs and their metabolites from dried blood spot samples.

Benefits

The high sensitivity available by combining ACQUITY UPLC with the tandem quadrupole Xevo TQ MS makes it an ideal solution for analyzing samples derived from DMPK studies in a dried blood spot format.

  • Fewer animals are used in trials, reducing operating costs
  • Assay sensitivity meets sensitivity requirements for low dosed and low exposure compounds
  • Method development is streamlined by collecting simultaneous full-scan MS and MRM data to detect and confirm the identity of drug metabolites

Introduction

The collection of blood from small rodent safety studies and clinical trials onto Guthrie type filter paper cards has the potential to reduce both costs and animal usage, Figure 1. This capability has been demonstrated by Spooner et al1-4 as well as others5-7 (For further explanation see sidebar, “Blood spot cards”). Typically 15 μL of blood is spotted onto the card for each sample from which a 3 or 6 mm punch is sampled, giving a sample volume in the region of 3 to 6 μL. In this application note we present the use of ACQUITY UPLC coupled with Xevo TQ MS for method development and high sensitivity quantification of drugs and their metabolites from dried blood spot samples.

Dried blood spots on card.
Figure 1. Dried blood spots on card.

Experimental

Sample preparation

The samples, calibration line, and QCs were prepared by spiking authentic standard in solution into fresh rat blood. The samples were spotted, 15 μL, onto Whatman DMPK cards type A, B, and C. The cards were sampled using a 3-mm punch, dissolved in 100 μL of methanol, shaken for 1 hour, then centrifuged for 1 minute. The supernatant was removed and water added (1:1), before injection onto the LC-MS system.

LC conditions

LC system:

ACQUITY UPLC System

Column:

ACQUITY UPLC BEH C18, 1.7 μm, 2.1 x 50 mm

Gradient:

Reversed phase over 2 minutes

MS conditions

MS system:

Xevo TQ MS

Ionization:

Electrospray MS operating in positive ion mode with the simultaneous collection of both MRM and full scan MS data (RADAR mode)

Collision energy, capillary voltage, and cone voltage were optimized for each individual compound

Blood Spot Cards

Traditional DMPK rodent safety assessment studies produce approximately 1 mL of plasma for each sample. The plasma samples are produced from approximately 1.5 to 2 mL of blood, requiring the sacrifice of an animal for each time point. The pharmacokinetics curves produced are derived from a composite of 2 to 3 animals per time point. The use of blood spot cards as a sampling media requires that only 15 to 20 μL of blood is required for each time point. This has several advantages:

  • No need to sacrifice the animal at sample occasion
  • The pharmacokinetics curve produced is more representative as it is derived from one animal and not a composite
  • Fewer animals are used
  • Less compound is required
  • There is no need to store and ship the samples frozen

Results and Discussion

Background cards signal

The blood spot cards are available in two main formats: treated and untreated. The treated cards are treated with chemicals to render any blood borne virus harmless, however the chemicals in the card can be dissolved during the extraction process and could interfere with the analyte signal. It is therefore critical during method development that the background signal from the card is monitored such that the chromatography can be adjusted to provide resolution from the analyte ion.

The Xevo TQ MS features a novel collision cell design, incorporating T-Wave Technology, which allows the simultaneous collection of full-scan data and MRM data using the RADAR acquisition mode. The data in Figure 2 shows the full-scan and MRM data for each of the three cards after spiking with alprazolam (1 ng/mL) in solvent and extraction with methanol.

Full scan data for three types of DMPK cards.
Figure 2A. Full scan data for three types of DMPK cards. A and B are both chemically treated, C is untreated.

T-Wave Collision Cell

  • The T-Wave-enabled collision cell minimizes ion transit times and provides optimum performance for fast analyses.
  • Where short cycle times are required for narrow chromatographic peaks or multiple MRM transitions (e.g., in parallel analyses), the T-Wave cell maintains signal intensity and minimizes interchannel crosstalk – even at very short dwell times.
  • The T-Wave cell delivers enhanced sensitivity and resolution for class-specific monitoring, using precursor ion or neutral loss analysis, which is superior to standard multi-pole collision cells – even at higher scan speeds.
MRM data for three types of DMPK cards.
Figure 2B. MRM data for three types of DMPK cards.

As we can see from this data, the untreated card (DMPK C) exhibits a significantly lower background signal than that of the treated cards. The full-scan MS data of each of the cards shows the treated cards have an increasingly intense ion current as the LC gradient increases. This is also reflected in the response of analyte ion where the signal is reduced with the treated cards compared to the untreated one.

Sensitivity

The low sample spot and sampling volume means that only 3 to 6 μL of blood are actually used for the analysis. In a typical safety assessment study the compound under test is dosed once or twice a day intravenously or orally at levels of 3 to 200 mg/Kg. For a compound that is not sequestered into an organ/fat or rapidly eliminated, this results in circulating levels of the drug and/or metabolite thatare greater than 5 ng/mL at the later time points (24 hours). These levels are well within the detection range of today’s modern LC-MS/MS analytical systems when operated in MRM mode. However, for low dosed, rapidly cleared, or inhaled compounds, the circulating levels are typically much lower; in the 1 to 10 pg/mL range. Therefore greater levels of sensitivity are required from the analytical instrumentation to accurately quantify these types of samples from a dried blood spot.

UPLC Technology exploits the chromatographic potential of sub-2-μm porous particles, and has been demonstrated by many scientists to provide 3 to 5 fold more sensitivity than traditional HPLC8-10 (go online to www.waters.com/uplc for more details on UPLC). This extra sensitivity when combined with the best-in-class performance of the Xevo TQ MS provides the ideal analytical platform for the rapid analysis of DMPK samples from blood spot cards.

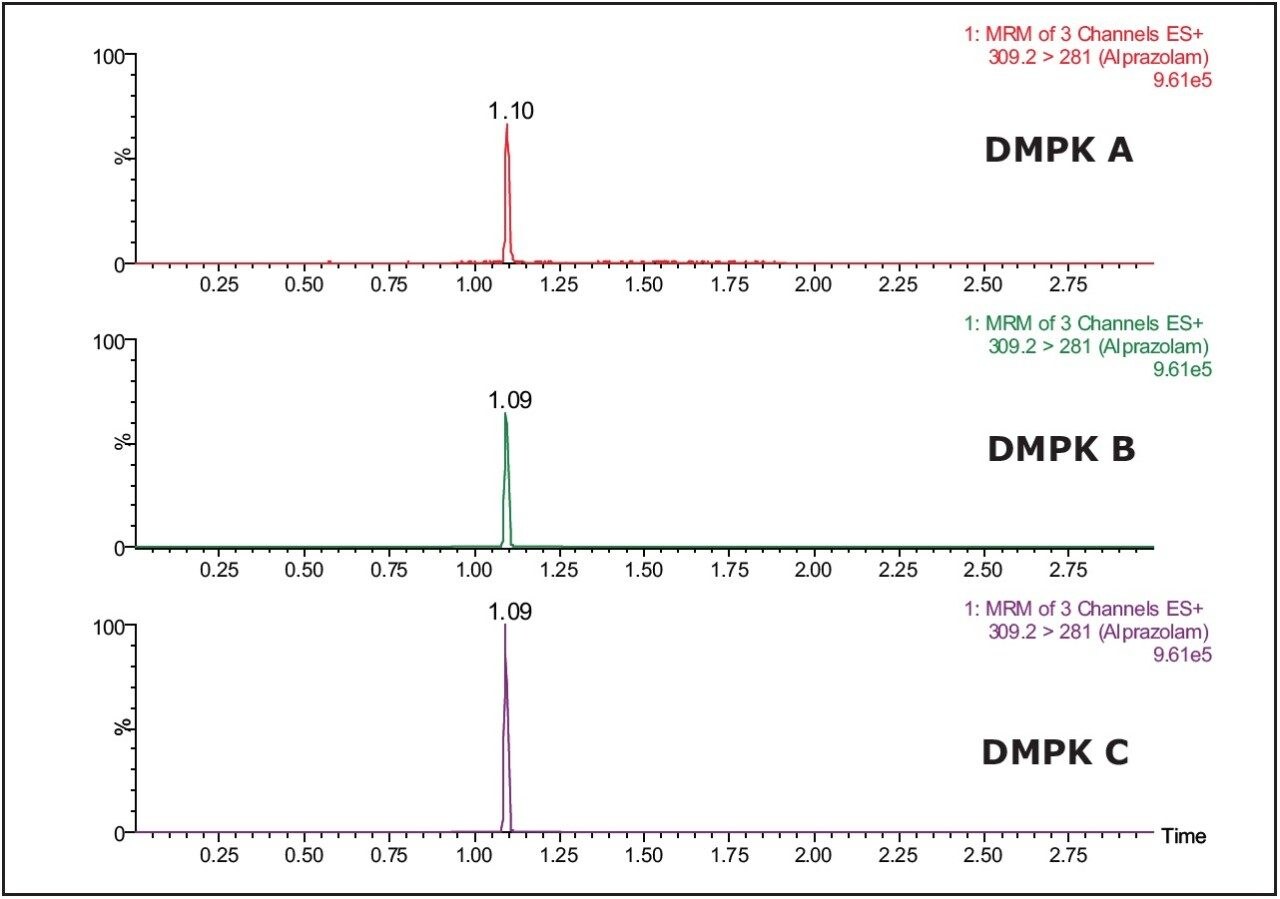
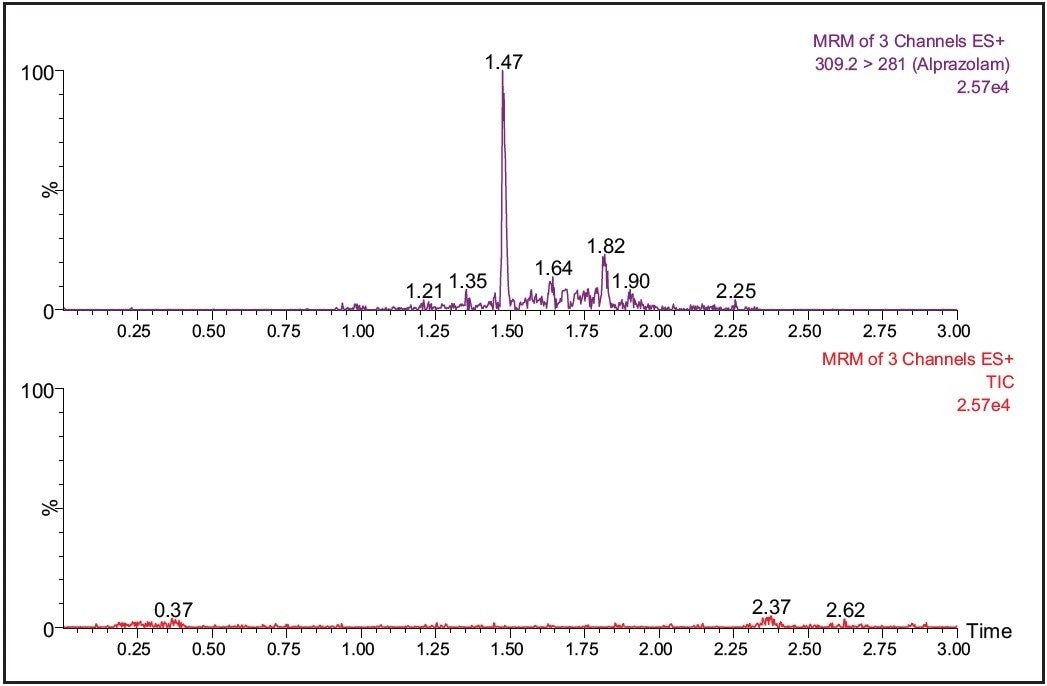
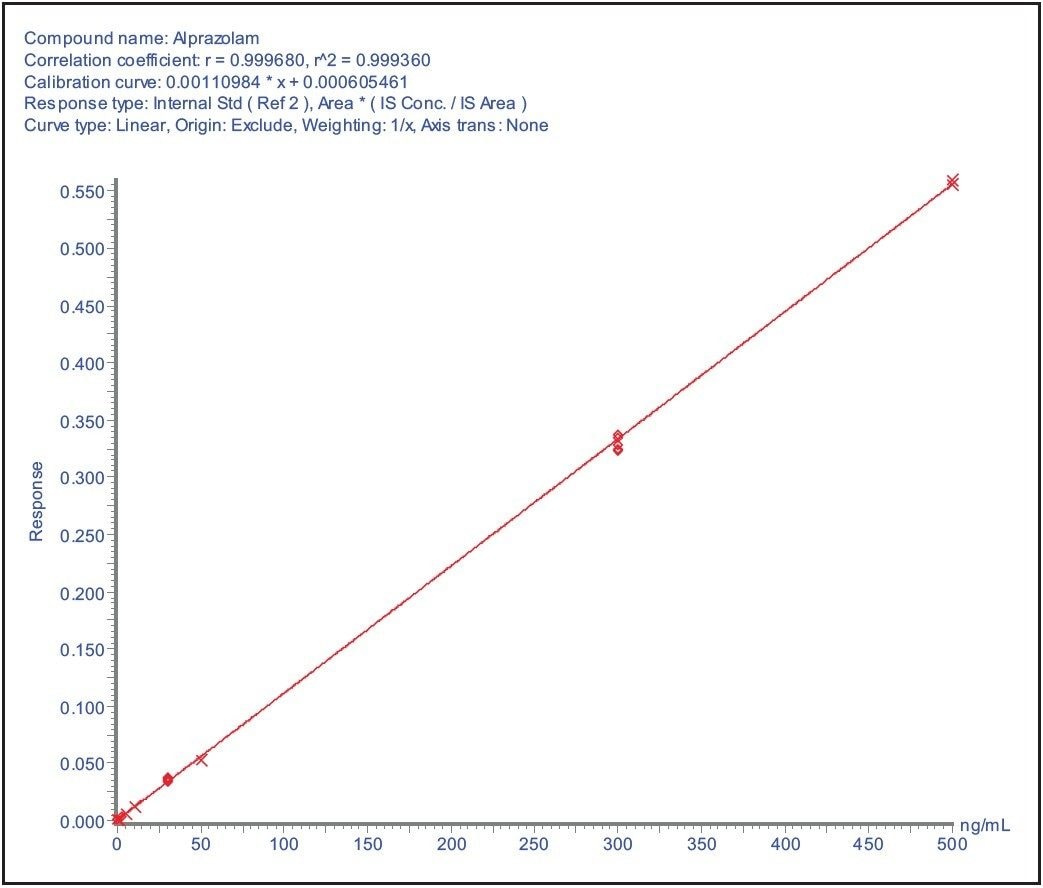
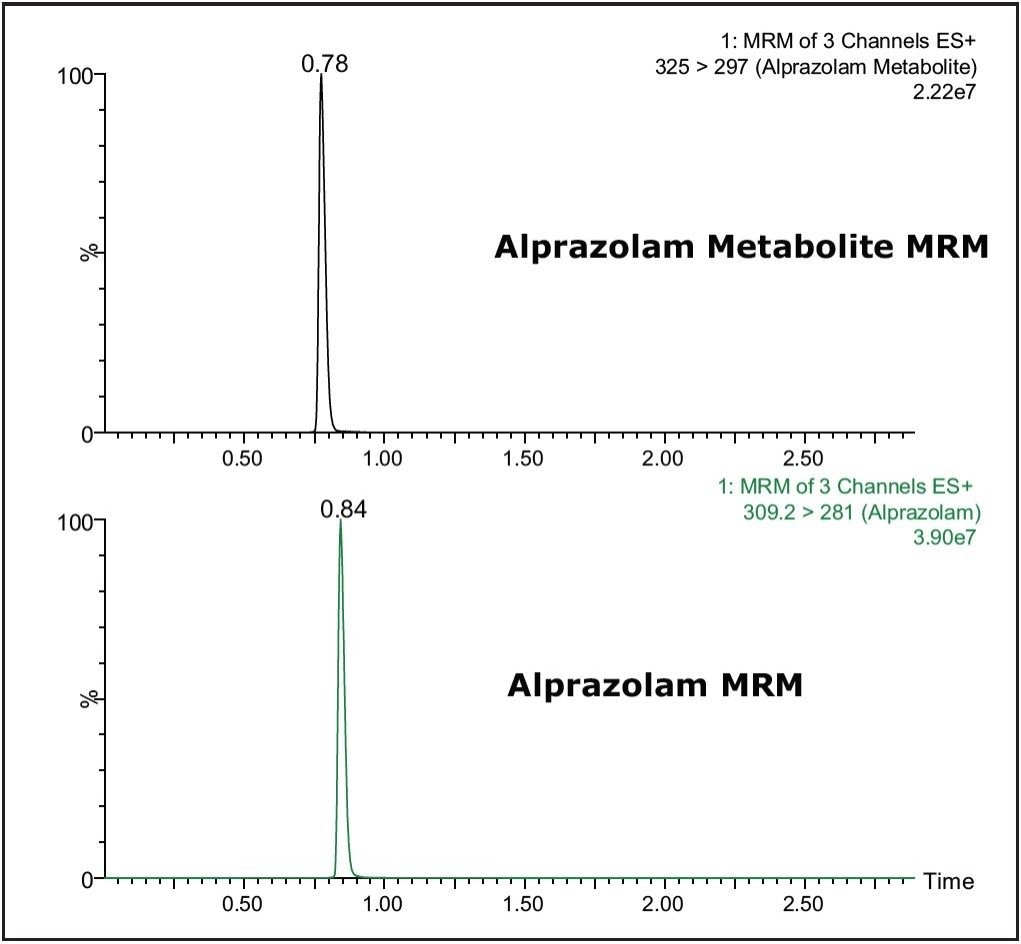
The data displayed in Figure 3A shows the LLOQ and blank from the analysis of alprazolam in spiked into blood and spotted (15 μL) onto a blood spot card. The calibration line, Figure 3B, shows that the analysis was linear over the range of 100 pg/mL to 500 ng/mL. For this assay it was not necessary to obtain a lower level of sensitivity; however the LLOQ could be lowered to 10 pg/mL by injecting a larger volume of sample. This assay sensitivity level should be sufficient to define the pharmacokinetics of all but the lowest exposure compounds.

Upper chromatogram: LLOQ 100pg/mL. Lower chromatogram: Blood spot blank.
Figure 3A. Upper chromatogram: LLOQ 100pg/mL. Lower chromatogram: Blood spot blank.
Calibration line 100 pg/mL to 500 ng/mL.
Figure 3B. Calibration line 100 pg/mL to 500 ng/mL.

Method Development


During the method development process for a conventional DMPK study, it is necessary to adjust the chromatography to minimize the coelution of the analyte of interest from endogenous components in the matrix. When developing methods for dried blood spots there is the further complication of background matrix from the card, which must also be resolved from the analyte molecule. The ability of the Xevo TQ MS to simultaneously collect MRM and full-scan data in RADAR mode allows the scientist to monitor the analyte signal and the background signal at the same time. This allows the background signal of the sample to be monitored for interferences which may cause ion suppression. The analyte peak can then be manipulated to a position in the chromatogram with minimal interference.

The data shown in Figure 4 illustrates the MRM and full-scan signal for the analyte drug molecule and background signal from two different chromatography conditions. We can see from this data that the chromatogram on the right of Figure 4 has less background interference than the chromatogram on the left.

Left chromatogram: Initial gradient conditions, MRM and background data. Right chromatogram: Shortened gradient condition, MRM and background data.
Figure 4. Left chromatogram: Initial gradient conditions, MRM and background data. Right chromatogram: Shortened gradient condition, MRM and background data.

Radar

  • With RADAR you can collect data in both multiple reaction monitoring (MRM) and full-scan spectral acquisition modes at the same time. In addition, RADAR mode acquires all detectable ions in both positive and negative full-scan MS, arming you with a depth of knowledge about your sample not previously possible from a traditional quantitative assay. RADAR is only possible because of the Xevo TQ MS’s ability to rapidly alternate between MS, MS/MS, positive, and negative ion modes without compromising performance in any mode.

Reproducibility

A requirement of any bioanalytical assay is that it is reliable and reproducible. To evaluate the reproducibility of the blood spot assay, a calibration line and QCs were produced in blood, spotted onto the cards, extracted, and analyzed by UPLC-MS/MS. The data presented in Table 1 show the reproducibility of the QC data. We can see from this data that the reproducibility across the QCs ranged from 2.08% to 4.9%. This data gives confidence that the high sensitivity assays can be developed with good reproducibility using blood spot cards and UPLC-MS/MS.

Reproducibility of QC data from six replicas per concentration.
Table 1. Reproducibility of QC data from six replicas per concentration.

Metabolites

The detection and quantification of metabolites is a necessary part of modern bioanalysis. Using its RADAR acquisition mode, the Xevo TQ MS is able to collect in a single analytical run both MS and MRM data, which can be exploited to detect and confirm the identity of drug metabolites during a bioanalysis assay. The data displayed in Figure 5 show the detection of the 4-hydoxy metabolite of Alprazolam from a sample derived from a dried blood spot. The MS/MS spectra acquired from the metabolite peak was triggered from the MRM signal related to the metabolite peak. The spectrum was obtained on the trailing edge of the peak using the enhanced sensitivity mode of ScanWave. The increased sensitivity of the Scan Wave MS/MS data acquisition approach increases the scientists’ capability to confirm the identity of metabolite peaks during a bioanalysis assay.

Detection of Alprazolam and 4-hydoxy metabolite of Alprazolam.
Figure 5A. Detection of Alprazolam and 4-hydoxy metabolite of Alprazolam.
MS/MS spectra acquired from the metabolite peak.
Figure 5B. MS/MS spectra acquired from the metabolite peak.

Scanwave Technology

  • The Xevo TQ MS uses a novel collision cell design to improve sensitivity. ScanWave technology allows ions within the collision cell to be accumulated and then separated according to their mass-to-charge ratio (m/z). Synchronizing the release of these ions with the scanning of the second quadrupole mass analyzer significantly enhances the signal intensity of full-scan product ion spectra. Simply put, this enables you to more easily confirm the identities and structures of your analytes of interest.

Conclusion

The collection of samples derived from DMPK studies in a dried blood spot format offers a great opportunity to reduce animal usage while also reducing operating costs. The lower sample volumes produced from these dried blood spot assays requires increased assay sensitivity for low dosed and low exposure compounds. The increased sensitivity produced by the ACQUITY UPLC/Xevo TQ MS system combination addresses the issue of assay sensitivity. The system’s dual scan MRM capability simplifies methods development allowing the analyte to be resolved from the endogenous blood components and the chemicals present in the blood spot cards, while also ensuring the analyte is resolved from its metabolite(s).

References

  1. Direct quantitative bioanalysis of drugs in dried blood spot samples using a thin-layer chromatography mass spectrometer interface. Abu-Rabie P, Spooner N. Anal Chem. 2009 15;81(24):10275-84
  2. Dried blood spots as a sample collection technique for the determination of pharmacokinetics in clinical studies: considerations for the validation of a quantitative bioanalytical method. Spooner N, Lad R, Barfield M. Anal Chem. 2009 15;81(4):1557-63
  3. Application of dried blood spots combined with HPLC-MS/MS for the quantification of acetaminophen in toxicokinetic studies. Barfield M, Spooner N, Lad R, Parry S, Fowles S. J Chromatogr B Analyt Technol Biomed Life Sci. 2008 1;870(1):32-7
  4. Evaluation of ultra-performance liquid chromatography in the bioanalysis of small molecule drug candidates in plasma. vGoodwin L, White SA, Spooner N. J Chromatogr Sci. 2007 45(6):298-304
  5. Dried blood spot sampling in combination with LC-MS/MS for quantitative analysis of small molecules. Li W, Tse FL. Biomed Chromatogr. 2010 24(1):49-65
  6. Blood spots as an alternative to whole blood collection and the effect of a small monetary incentive to increase participation in genetic association studies.vBhatti P, Kampa D, Alexander BH, McClure C, Ringer D, Doody MM, Sigurdson AJ. BMC Med Res Methodol. 2009 13;9:76
  7. Analysis of mycophenolic acid in dried blood spots using reversed phase high performance liquid chromatography. Wilhelm AJ, den Burger JC, Chahbouni A, Vos RM, Sinjewel A. J Chromatogr B Analyt Technol Biomed Life Sci. 2009 Nov 15;877(30):3916-9
  8. Ultraperformance liquid chromatography tandem mass spectrometric method for direct quantification of salbutamol in urine samples in doping control. Ventura R, Ramírez R, Monfort N, Segura J. J Pharm Biomed Anal. 2009 5;50(5):886-90.
  9. Pulse gradient, large-volume injection, high-throughput ultra-performance liquid chromatographic/tandem mass spectrometry bioanalysis for measurement of plasma amrubicin and its metabolite amrubicinol. Li Y, Sun Y, Du F, Yuan K, Li C. J Chromatogr A. 2008 6;1193(1-2):109-16.
  10. Development of a highly sensitive and selective UPLC/MS/MS method for the simultaneous determination of testosterone and 5alpha-dihydrotestosterone in human serum to support testosterone replacement therapy for hypogonadism. Licea-Perez H, Wang S, Szapacs ME, Yang E. Steroids. 2008 Jul;73(6):601-10

Featured Products

720003408, March 2010

Back To Top Back To Top