Development of a UPLC Method for a Forced Degradation Study of Radioligand Therapy Precursor PSMA-617
Kenneth Berthelette, Melissa Aiello, Christopher Collins, Thomas H Walter
Waters Corporation, United States
Published on September 17, 2025
Abstract
In this application note, we describe a forced degradation study of the radioligand therapy precursor PSMA-617 and the development of a suitable UPLC-MS method to separate the degradants. Before starting the method development activities, a problem arose due to the use of glass sample vials. This issue was resolved using QuanRecovery™ Vials, which are made of polypropylene that has been surface modified to mitigate hydrophobic adsorption. The UPLC™ system and columns used for this work employ MaxPeak™ High Performance Surface (HPS) technology to avoid interactions of the sample components with metal surfaces. By using inert hardware in all aspects of the analysis, the results are of the highest quality possible, providing a good starting point for future activities, like purification and structural elucidation of the degradants. Full separation of PSMA-617 and the degradants was achieved using a 2.1 x 100 mm ACQUITY™ Premier CSH™ Phenyl-Hexyl Column and an optimized gradient.
Benefits
- Higher peak areas, narrower peaks and reduced tailing were achieved for PSMA-617 and several degradants using a MaxPeak Premier Column compared to a stainless steel column
- Baseline separation was achieved for PSMA-617 and all degradants
- Isobaric compounds were resolved allowing for identification by retention time instead of mass-to-charge ratio
Introduction
Drug characterization is a vital part of the development process and usually requires an assessment of stability and identification of the compounds generated from degradation of the active pharmaceutical ingredients. In the case of radioligand therapy compounds, which deliver a radionuclide to a target site, stability testing of the final drug is more complex. During administration in a clinical setting, the compound is subjected to typical metabolic pathways,1 but it may also potentially self-degrade due to the radiation from the bound radionuclide.2 The complexity of understanding how a radioligand therapy drug breaks down necessitates multiple rounds of testing, some of which can be done concurrently.
Three steps are performed to get a thorough assessment of compound stability and degradation. First, the precursor, which does not have the radionuclide bound, can be subjected to stress conditions in a lab to assess overall stability and determine what degradants, if any, are formed. Second, a “cold metal” version of the drug, bound with a stable metal ion can be subjected not only to stress conditions, but also administered to rats or mice for metabolic profiling. Lastly, the “hot metal” version of the drug can be formed and allowed to degrade on its own via radiation-catalyzed degradation. These three steps can provide a complete picture of the stability and degradation products of the drug.
This application note examines the first of the three steps in characterizing the stability and degradation pathways of radioligand therapy compounds: forced degradation of the precursor compound. PSMA-617, the precursor to PLUVICTO® from Novartis, was subjected to typical pharmaceutical forced degradation conditions. Once the precursor was sufficiently degraded, a UPLC-MS method was developed to separate the degradants and intact PSMA-617. To find the best set of conditions, the systematic screening protocol was used to speed up method development, and a suitable separation was achieved after one week of testing, including necessary method optimization steps. MaxPeak Premier Columns were used along with an ACQUITY Premier System. MaxPeak Premier Columns, which use inert column hardware, have previously been shown to improve the detection of PSMA-617 and the DOTA chelating group incorporated in the compound.3
Experimental
Sample Description
A stock solution of PSMA-617 was created at 1 mg/mL in water. Four separate 100 µL aliquots were removed and placed into QuanRecovery Vials for degradation. To each vial, 10 µL of either a catalyst or diluent was added. For thermal degradation, 10 µL water was added, and the vial was subjected to 70 °C for 22 hours. For acidic degradation, 10 µL of 1N HCl was added, and the vial was held at 70 °C for 22 hours. For basic degradation, 10 µL of 1N NaOH was added, and the vial was subjected to 70 °C for 22 hours. Lastly, for peroxide degradation, 10 µL of 3% H2O2 was added, and the vial was held at 70 °C for 22 hours. All four vials were combined into a single well on a QuanRecovery Plate for analysis.
Method Conditions
Reversed Phase LC Conditions
|
LC system: |
ACQUITY UPLC H-Class System with CM, 2 CM-Aux, PDA, and ACQUITY QDa™ Detector equipped with High Performance Surface (HPS) System tubing |
|
Detection: |
SIRs and MS Full Scan (ESI+) UV @ 254nm |
|
Vials and plates: |
QuanRecovery with MaxPeak HPS 700 µL Plate (p/n:186009184) QuanRecovery with MaxPeak HPS 300 µL Vials (p/n:186009186) |
|
Columns: |
ACQUITY Premier BEH™ C18, 2.1 x 50 mm, 1.7 µm (p/n: 186009452) ACQUITY Premier CSH Phenyl-Hexyl, 2.1 x 50 mm, 1.7 µm (p/n: 186009474) ACQUITY Premier HSS PFP, 2.1 x 50 mm, 1.8 µm (p/n: 186010036) ACQUITY Premier CSH C18, 2.1 x 50 mm, 1.7 µm (p/n: 186009460) Atlantis Premier BEH C18 AX, 2.1 x 50 mm, 1.7 µm (p/n: 186009366) ACQUITY Premier HSS T3, 2.1 x 50 mm, 1.8 µm (p/n: 186009467) ACQUITY Premier CSH Phenyl-Hexyl, 2.1 x 100 mm, 1.7 µm (p/n: 186009475) ACQUITY UPLC CSH Phenyl-Hexyl, 2.1 x 100 mm, 1.7 µm (p/n: 186005407) |
|
Columns: |
30 °C |
|
Sample temperature.: |
10 °C |
|
Injection volume: |
1.0 µL |
|
Flow rate: |
0.5 mL/min |
|
Mobile phase A: |
Water |
|
Mobile phase B: |
Acetonitrile |
|
Mobile phase C: |
Methanol |
|
Mobile phase D1: |
2% Formic Acid in Water |
|
Mobile phase D6: |
200 mM Ammonium Hydroxide in Water |
|
Initial gradient conditions: |
5% of either D1 or D6 was used to maintain a constant modifier concentration. Initial conditions of 5% organic were followed by a linear gradient to 95% organic over 6.86 minutes (3.0% organic/ column volume). The composition was held at 95% organic for 1.14 minutes (6 column volumes) then returned to the initial conditions and held for 2.28 minutes to re-equilibrate (10 column volumes). The total run time was 10.30 minutes. |
Data Management
|
Chromatography software: |
Empower™ Chromatography Data System (CDS) |
Results and Discussion
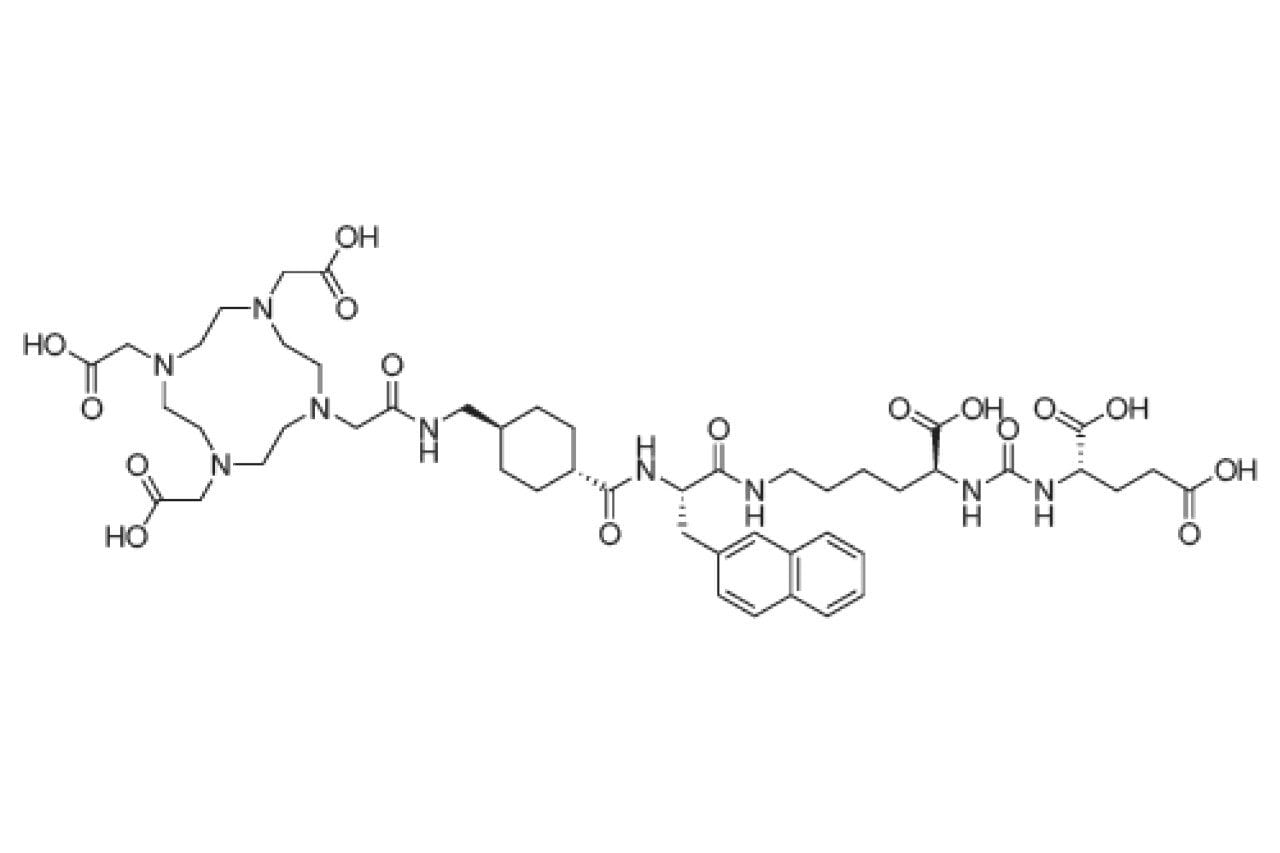
The radioligand therapy precursor PSMA-617 was subjected to a forced degradation study for this work. Figure 1 shows the chemical structure of PSMA-617. The initial step in performing this study was to determine if the compound degrades at room temperature and no stress, i.e. no catalyst added. Typically, the room temperature test shows no degradation, but may reveal some unexpected interactions. For PSMA-617, the use of LCGC Certified glass vials led to the apparent loss of the analyte within one hour, as shown in Figure 2.
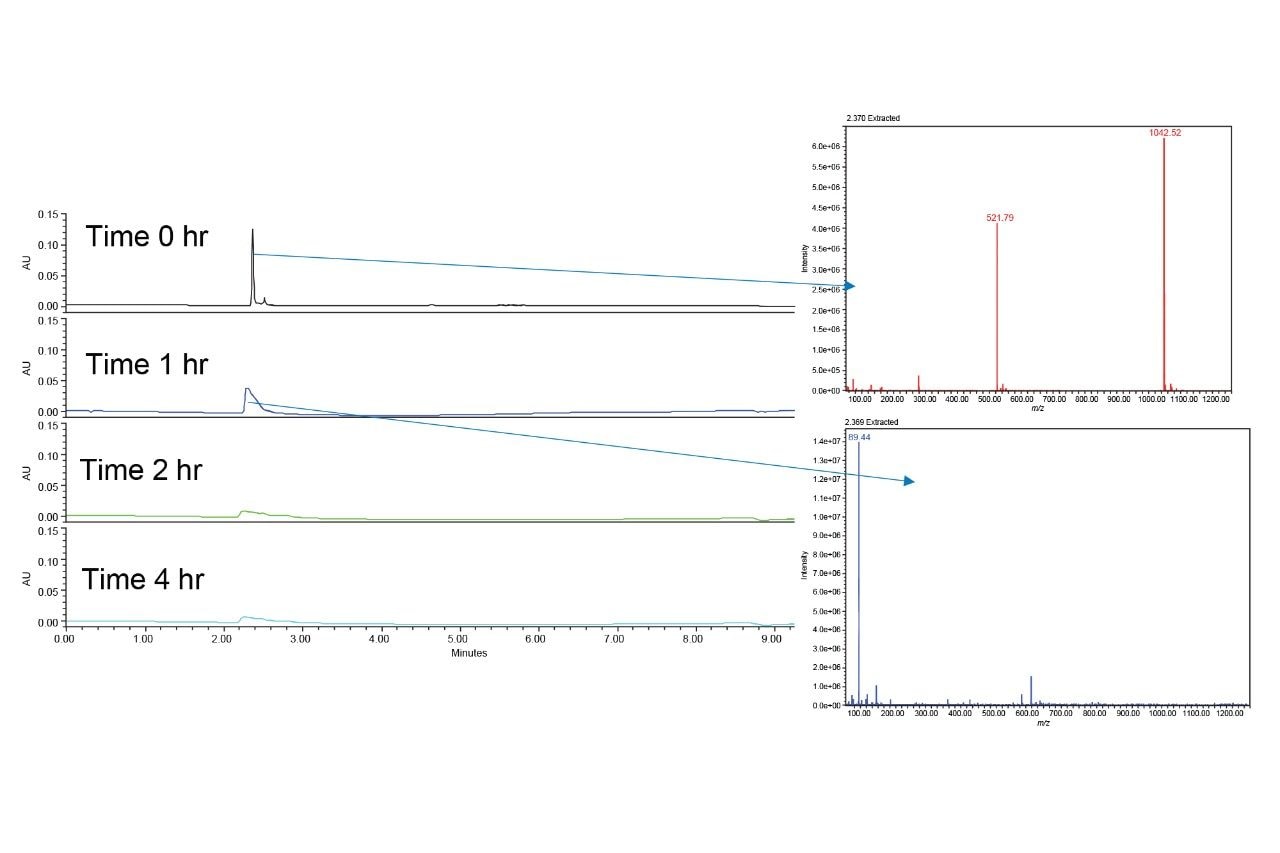
After just one hour, the chromatographic peak for PSMA-617 broadened and became asymmetrical. The corresponding mass spectra in ESI+ mode showed that PSMA-617 was no longer present, indicating an unexpected interaction with the vials. The mass spectrum of the peak after one hour is completely different from that observed in the initial injection, which showed not only the M+H ion, 1042.52 m/z, but also the doubly charged mass of 521.79 m/z. To further investigate this, QuanRecovery Vials were used. QuanRecovery Vials are made of polypropylene and are surface modified to mitigate hydrophobic interactions between analytes and the surface of the vials.4,5 Figure 3 shows the results obtained using QuanRecovery Vials for the analysis of PSMA-617.
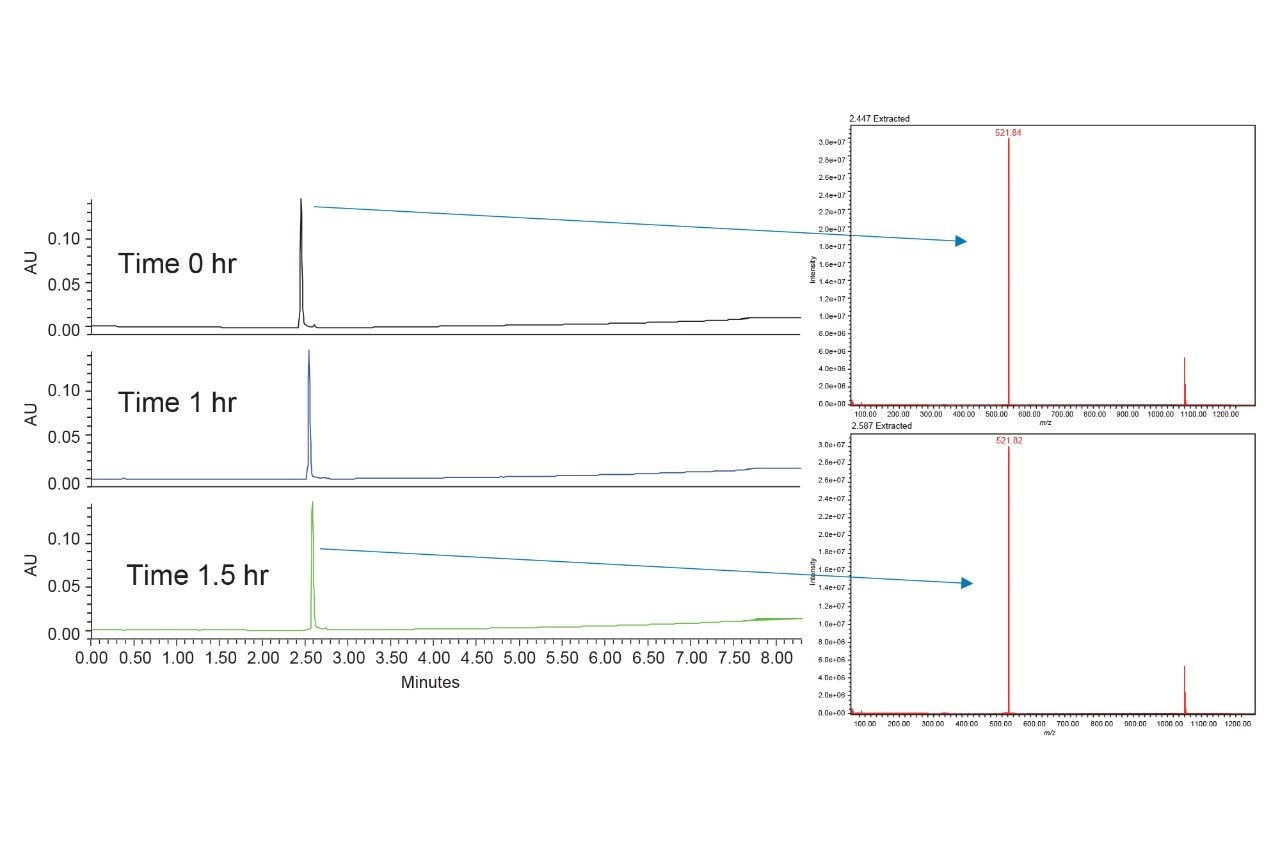
Using QuanRecovery Vials, the PSMA-617 peak was still detectable after 1.5 hours both by UV and MS. The mass spectra shows a strong doubly charged mass, and the M+H ion is still detectable. This indicates that the compound is likely to interact with the glass vials, specifically metal impurities like iron in the glass leading to analyte adsorption onto the glass. Given that PSMA-617 contains a strong chelating group, DOTA, this would make sense. Moving forward, all work was done using QuanRecovery Vials or plates to ensure that the sample container was not affecting the results. It was determined through testing that high temperature conditions using acidic, basic, and peroxide catalysts provided sufficient degradation of PSMA-617. By combining the solutions, a single sample was created to develop a UPLC-MS method to separate all degradants, regardless of how they were generated.
To develop the method quickly and efficiently, the systematic screening protocol was employed. This approach has been used successfully to develop methods for forced degradation samples as well as other complex mixtures.6–9 The first step of the systematic screening protocol requires testing high and low pH modified mobile phases with a high-pH stable C18 column to determine which conditions provide the best retention for the analytes. Figure 4 shows the separation of the forced degradation sample using an ACQUITY Premier BEH C18 Column.
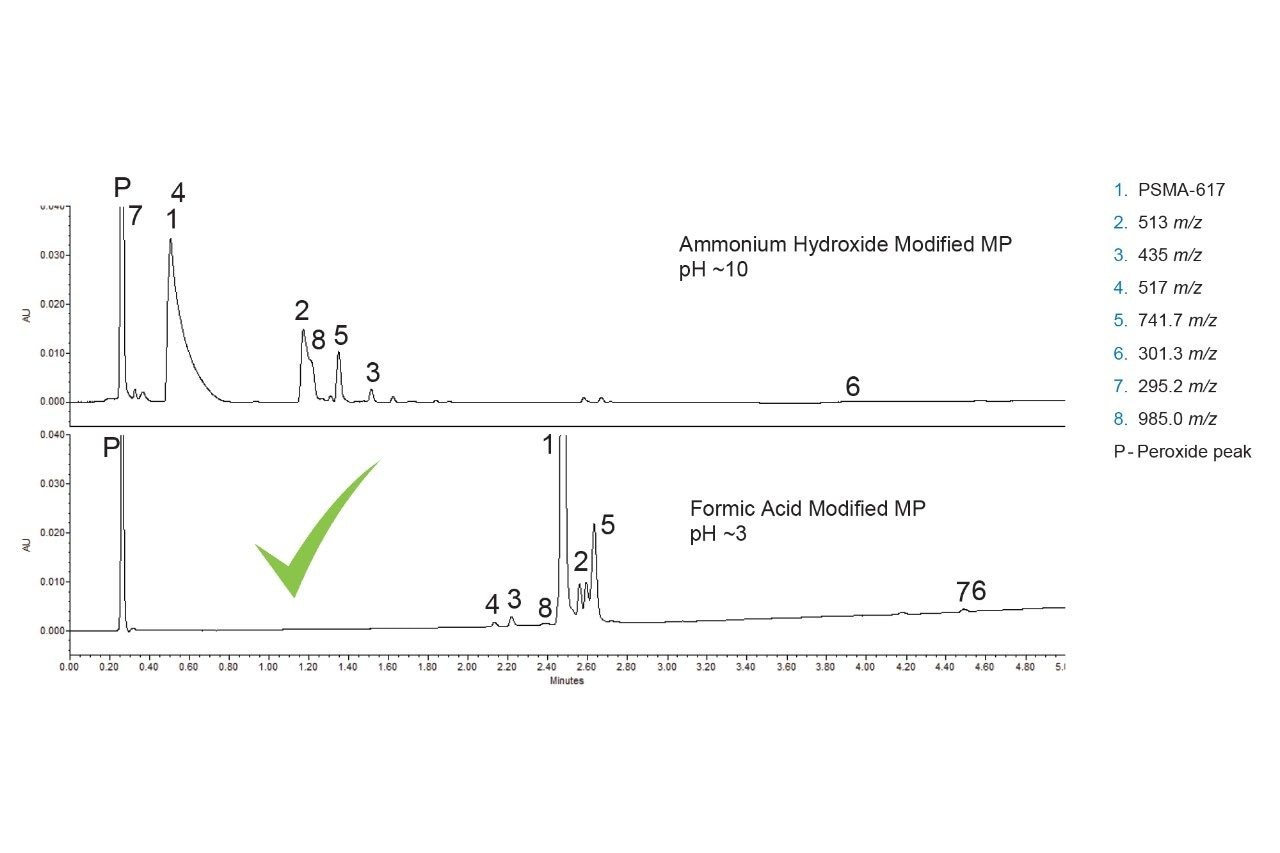
The high pH modified mobile phase resulted in lower overall retention for the analytes detected, indicating that they are predominantly acidic. Peak 7 eluted in the void with the peroxide peak, while most of the other peaks eluted under two minutes. Conversely, the use of the low pH modified mobile phase yielded greater retention, with most analytes eluting between two and three minutes. It should be noted that three peaks have the same mass-to-charge ratio of 513 (Component 2). Separating these three peaks is desirable as it would allow for follow-up studies to identify them. From these results, the pH modifier of the mobile phase can be locked in and used for all subsequent testing. The selection of the mobile phase modifier also provides information needed to select columns for the next step, which is column screening.
Selecting columns can be challenging as there are a lot of stationary phases to choose from. Knowing the mobile phase pH that will be used helps guide that decision since some stationary phases are not stable at high pH. For this sample, a low pH modifier was selected, which allows for a wider selection of columns to be used. The UPLC system used in this work was configured to allow up to 6 columns to be tested, so an additional five columns were chosen to compare to the BEH C18 Column used in the initial screening.
The first column selected was the ACQUITY Premier CSH Phenyl-Hexyl Column, which uses a charged-surface hybrid particle. CSH stationary phases have been shown to not only improve peak shapes for basic analytes when using mobile phases containing formic acid but also provide a weak anion-exchange functionality to better retain ionized acidic analytes.10–11 A Phenyl-Hexyl group is attached to the base particle, which provides different selectivity compared to C18 groups due to the pi electrons in the phenyl moiety. When using mobile phases not containing acetonitrile, analytes having pi electrons can interact with the phenyl groups in the stationary phase, altering their retention.
The next column selected was an ACQUITY Premier HSS PFP Column, which contains high-strength silica particles bonded with pentafluorophenyl groups. This stationary phase can undergo pi-pi interactions with analytes containing pi electrons as well as dipole-dipole and hydrogen bond interactions. Next, an ACQUITY Premier CSH C18 Column was selected as the analytes were well retained with the BEH C18 Column but may benefit from the charged-surface CSH particle. The fifth column chosen was an Atlantis™ Premier BEH C18 AX Column, which contains a mixed-mode reversed-phase/anion-exchange stationary phase providing improved retention of acidic analytes. Lastly, an ACQUITY Premier HSS T3 Column was chosen which contains a silica-based mid-coverage C18 stationary phase that provides improved retention of ionized basic analytes. While insufficient retention is not a problem for these analytes, greater retention can make method optimization easier, particularly gradient slope adjustments.
The 6 columns were tested using both acetonitrile and methanol as the strong solvent, modified with 0.1% formic acid. Figures 5 and 6 show the resulting chromatograms with acetonitrile and methanol respectively.
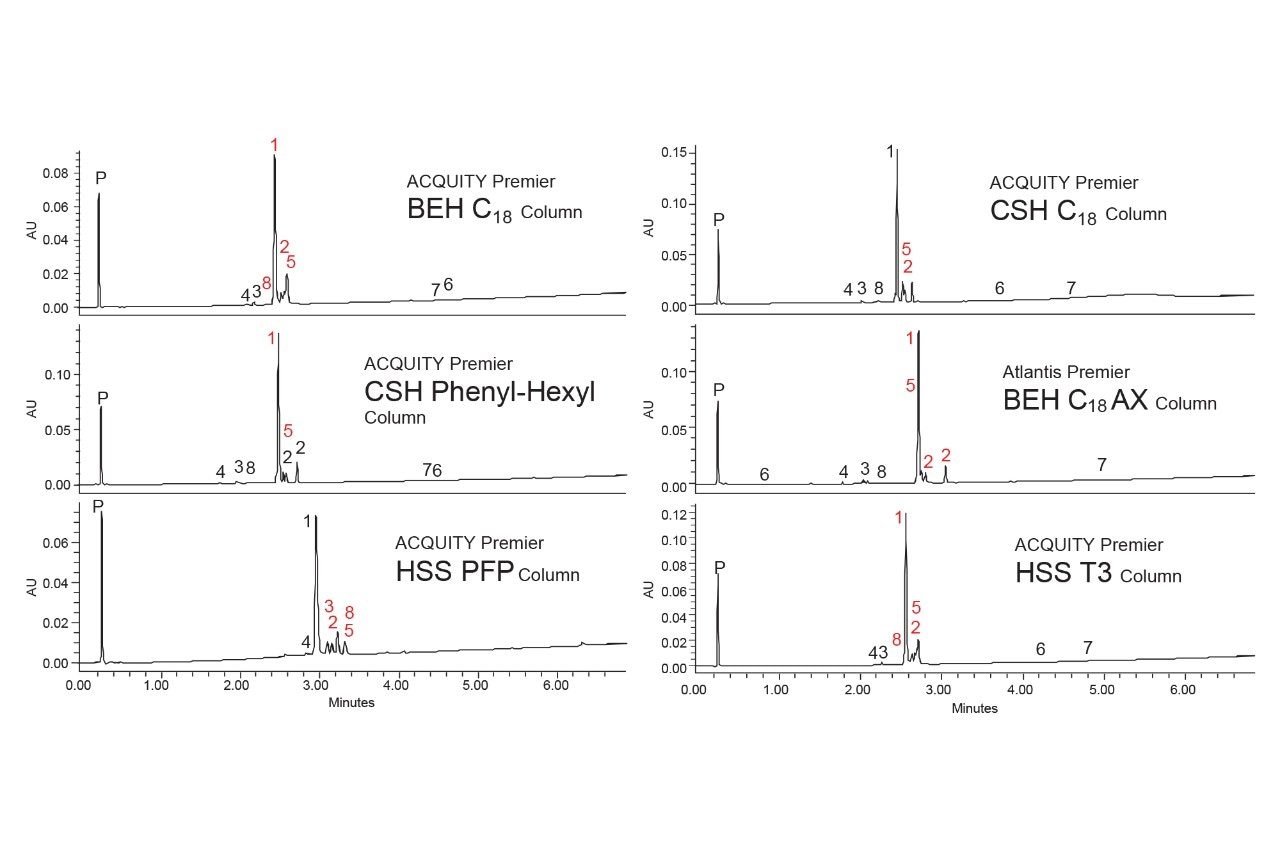
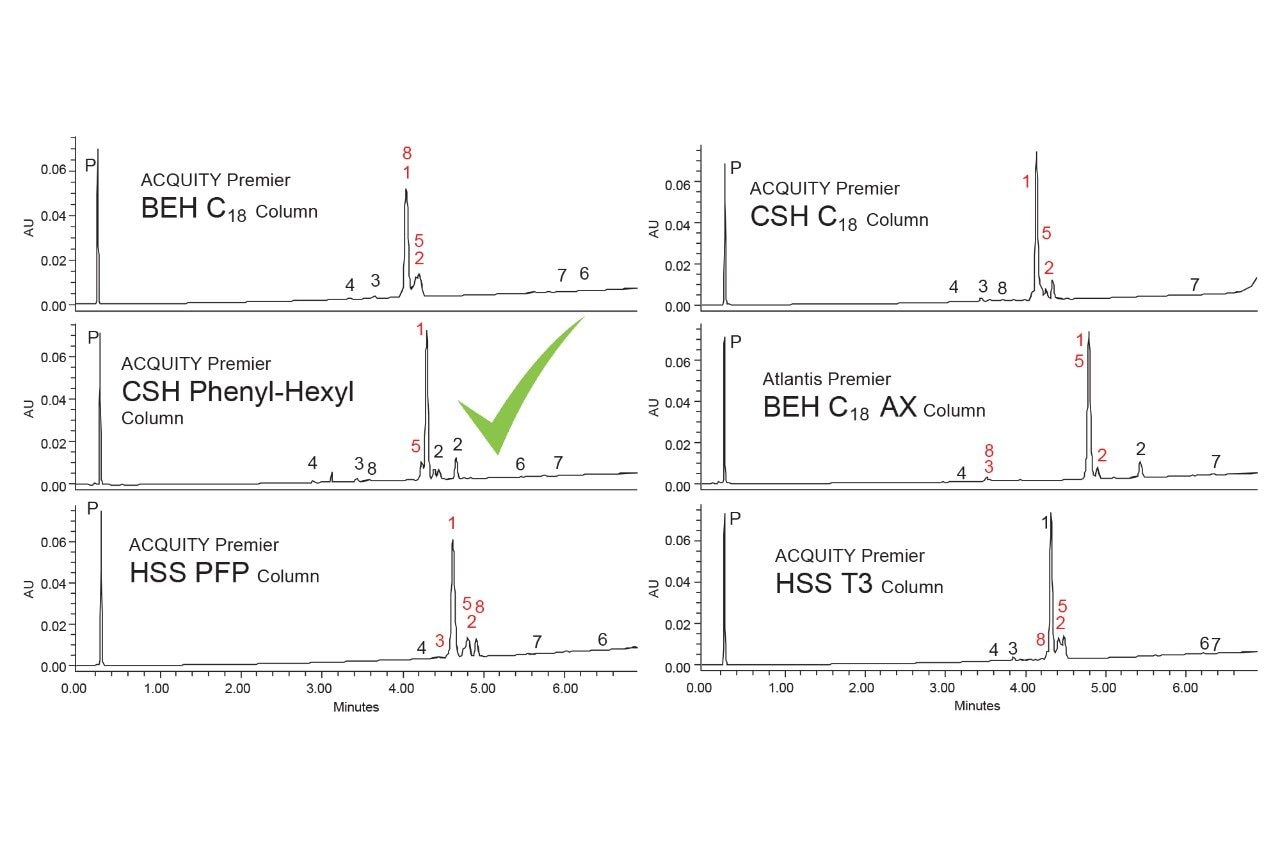
None of the tested conditions provided complete separation of this group of analytes. The best separation was obtained using an ACQUITY Premier CSH Phenyl-Hexyl Column with methanol as the strong solvent. All the other columns tested, regardless of strong solvent, had at least two sets of co-eluting peaks, particularly components 2, 3, 5 and 8. The CSH Phenyl-Hexyl Column only resulted in one set of co-eluting peaks, components 1 and 5. When using acetonitrile, the two analytes nearly coeluted, while with methanol component 5 elutes slightly before component 1. This provides a slightly better separation which may be improved with further optimization.
Method optimization is not a streamlined process and relies heavily on the interpretation of the data from the column screening step. Given the results shown in Figure 6, performing a gradient slope adjustment is a logical step. Decreasing the gradient slope can prove powerful as it affects how rapidly an analyte moves through the column. Increased interaction with the stationary phase can lead to increased separation, but also peak broadening, so the two effects must be balanced. Before changing the gradient slope, the initial gradient composition was first adjusted. The initial scouting experiments used a 5–95% methanol gradient, with the earliest compound eluting at approximately 2.7 minutes. Calculating the percentage of methanol at that point, and accounting for gradient delay indicated that 30% methanol would be an appropriate starting composition. The middle chromatogram in Figure 7 shows the results obtained using a gradient starting at 30% methanol and the same gradient slope as the scouting experiments, 3% strong solvent per column volume (%/Vc).
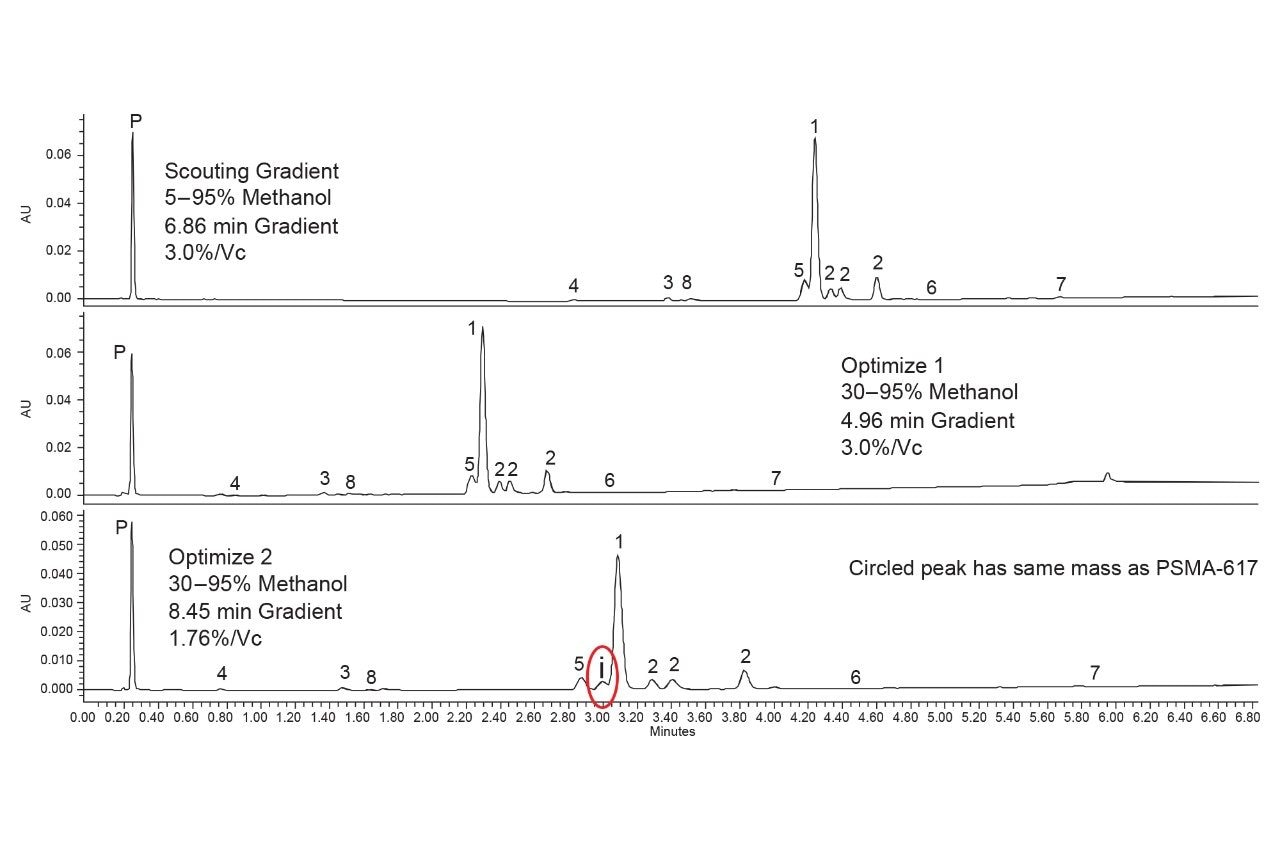
Adjusting the gradient starting composition had the expected effect, reducing the retention times without affecting the separation of the compounds. This is still an important step in optimization as it keeps the run time low during the next step, which is slope optimization. To modify the gradient slope, reducing it in this case, the %/Vc must be adjusted, which correlates inversely to gradient run time. Assuming the flow rate is kept constant, a shallow gradient takes longer to run than a steep gradient with the same starting and end points. By adjusting the starting composition first, the run times are kept as low as possible. The second optimization step performed was a decrease of the gradient slope from 3.0 to 1.76 %/Vc. The new slope was selected to keep the analysis time low while increasing the resolution of the critical peaks. As seen in the bottom chromatogram in Figure 7, the identified components were successfully separated using the shallower gradient. However, in optimizing the method a new impurity (identified as i) was found which has the same mass as PSMA-617. Having an isobaric compound eluting close to the main compound is particularly problematic as the MS detector can’t distinguish between the two analytes. This can have a negative impact on purity testing, especially where MS detection is used to assess peak uniformity.
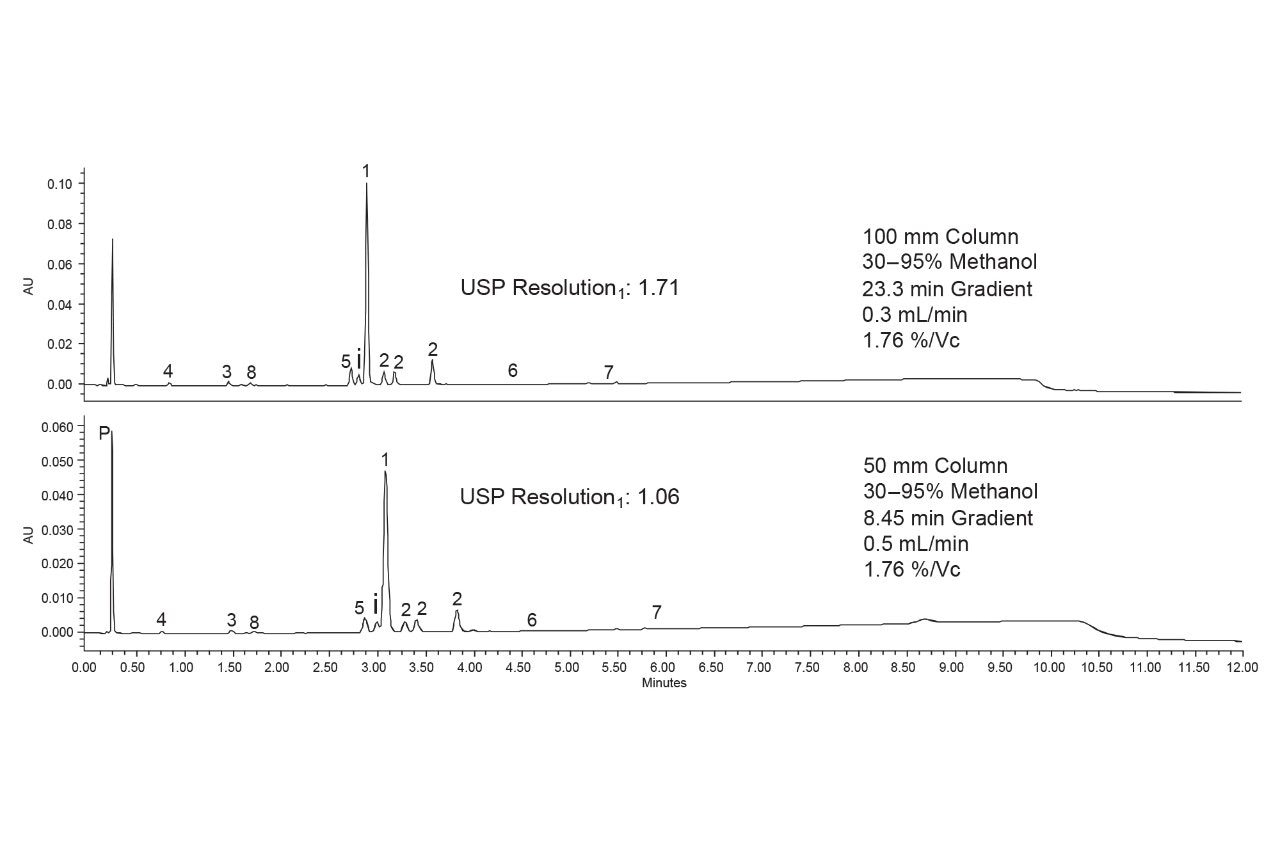
One final optimization step was performed to better resolve the newly discovered impurity from the PSMA-617 peak. A 2.1 x 100 mm ACQUITY Premier CSH Phenyl-Hexyl Column was used, and the shallow gradient was scaled up using conditions provided by the ACQUITY Columns Calculator.12 A lower flow rate was employed due to pressure limitations of the system. Figure 8 compares the separations on the 50 and 100 mm columns. Using the longer column provided sufficient resolution of the isobaric impurity and PSMA-617. With a USP resolution of 1.71, the two are baseline resolved, as are all the other degradants.
The final method conditions were next used with both an ACQUITY Premier CSH Phenyl-Hexyl Column and an ACQUITY UPLC CSH Phenyl-Hexyl Column to confirm the need for MaxPeak HPS column and system hardware for this analysis. Additionally, while this hardware is needed for the analysis of PSMA-617, understanding which degradants, if any, experience interactions with the stainless-steel surfaces can provide insight into their identity. Figure 9 shows the separations achieved using both stainless steel and inert column hardware. The stainless-steel column gave lower peak heights for most of the analytes as well as broader and more asymmetrical peaks. Notably the isobaric impurity that elutes between peaks 1 and 5 was also shorter when using the stainless-steel column, indicating significant interaction. Peak areas, USP tailing factors and peak widths at 13.4% were monitored for three replicate injections on each column. The average values for each analyte on each column are shown in Table 1.
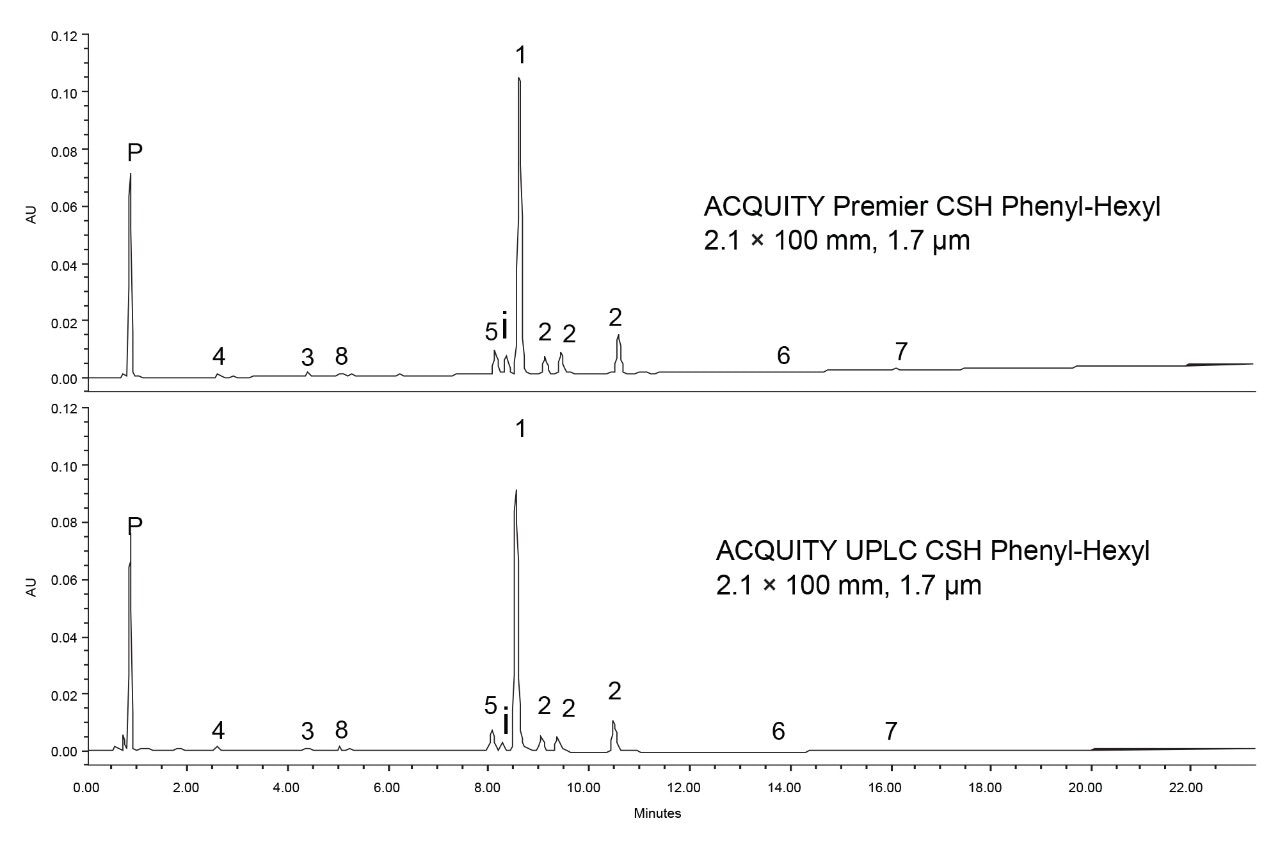
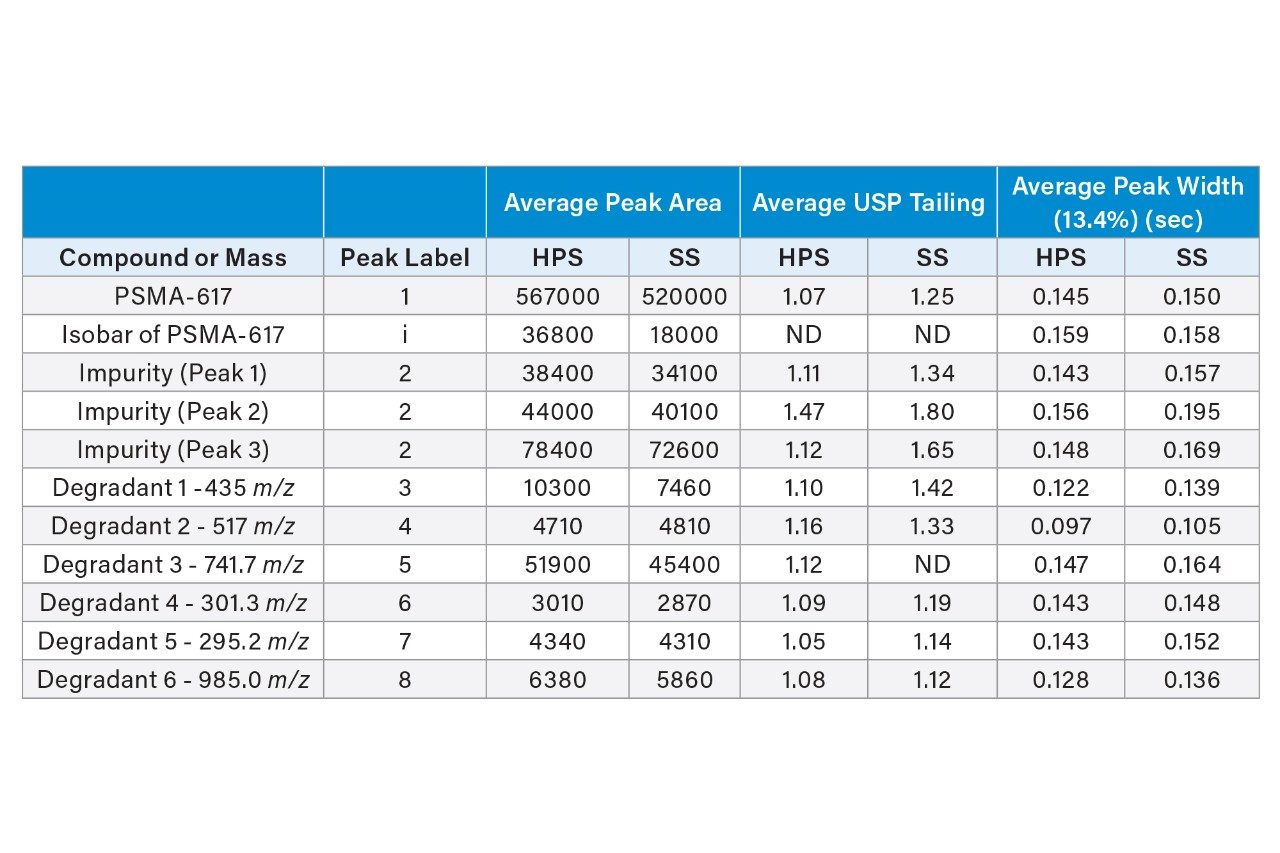
As expected, the use of the MaxPeak HPS Column improved the overall separation quality, particularly in regard to peak areas and USP tailing values. PSMA-617 showed an approximate 8% higher peak area when the HPS column was used, with a tailing factor of 1.07 compared to 1.25 when the stainless steel column was employed. Similar improvements were seen for most of the degradants with only two showing no change in peak area between the two columns, Degradant 5 and Degradant 2 (peaks 7 and 4, respectively). These two compounds still benefit from HPS column hardware with reduced tailing factors and peak widths. The degradants that did show interaction may contain the DOTA chelating group, or possibly other acidic moieties which interact with the metal hardware. By using the MaxPeak Premier Columns and ACQUITY Premier LC System, a better characterization of the degradants can be obtained.
Conclusion
This application note looked at the forced degradation of PSMA-617, a radioligand therapy precursor. First an assessment of sample containers was made as glass vials caused the PSMA-617 compound to adhere to the container. Using QuanRecovery Vials resolved this issue and allowed the forced degradation testing to commence. Once the compound was sufficiently degraded, a UPLC method was developed using the systematic screening protocol and MaxPeak Premier Columns. This protocol balances speed of analysis with sufficient data collection to ensure that the best method can be selected quickly. MaxPeak Premier Columns employ inert column hardware eliminating unwanted interactions of analytes with the column hardware, ensuring that the data collected is accurate and of the highest quality. A final set of conditions was realized using an ACQUITY Premier CSH Phenyl-Hexyl Ccolumn and a formic acid modified methanol mobile phase. Coupling the systematic screening approach with MaxPeak Premier Columns eliminates doubt in the method development process.
References
- Fu Y, Farnham J, Li W, Powers B, Humphries D, Picard F. LC-MS/MS Bioanalysis of Radioligand Therapeutic Drug Candidate for Preclinical Toxicokinetic Assessment. Anal Chem. (2023) 95, 28, 10812–10819.
- Larenkov A, Mitrofanov I, Pavlenko E, Rakhimov M. Radiolysis-Associated Decrease in Radiochemical Purity of 177Lu-Radiopharmaceuticals and Comparison of the Effectiveness of Selected Quenchers against This Process. Molecules 2023, 28, 1884.
- Berthelette K, Aiello M, Collins C, Kalwood J, Walter TH. Analysis of Radioligand Therapy Components using Reversed-Phase and HILIC Columns. Waters application note. 720008710. https://www.waters.com/nextgen/us/en/library/application-notes/2025/analysis-of-radioligand-therapy-components-using-reversed-phase-and-hilic-columns.html
- QuanRecovery Vials and Plates. https://www.waters.com/nextgen/gb/en/products/vials--plates--and-certified-containers/quanrecovery-vials-and-plates.html
- Tackling non-specific binding of biotherapeutics using LC-MS Compatible QuanRecovery Sample Plates with MaxPeak High Performance Surfaces. https://lcms.cz/labrulez-bucket-strapi-h3hsga3/720006528en_8c401d1379/720006528en.pdf
- Berthelette K, Collins C, Kalwood J, Haynes K. Method Development of Orlistat Forced Degradation Sample using MaxPeak Premier Columns and QDa Mass Detection. Waters application note. 720008225. https://www.waters.com/nextgen/us/en/library/application-notes/2024/method-development-of-orlistat-forced-degradation-sample-using-maxpeak-premier-columns-and-qda-mass-detection.html
- A Complete Solution to Perform a Systematic Screening Protocol for LC Method Development. Waters White Paper. https://www.waters.com/nextgen/us/en/library/library-details.html?documentid=720005268&t=waters-ACompleteSolutiontoPerformaSystematicScreeningProtocolforLCMethodDevelopment-720005268
- Berthelette K, Collins C, Haynes K. Method Development of Proteolysis Targeting Chimera (PROTAC) Compound ARV-825 Forced Degradation Sample Using the Systematic Screening Protocol. Waters application note. 720008328. https://www.waters.com/nextgen/us/en/library/application-notes/2024/method-development-of-proteolysis-targeting-chimera-protac-compound-arv-825-forced-degradation-sample-using-the-systematic-screening-protocol.html
- Berthelette K, Collins C, Kalwood J, Haynes K. Using the Systematic Screening Protocol and MaxPeak Premier Columns to Separate Seven Janus Kinase Inhibitors. Waters application note. 720008528 https://www.waters.com/nextgen/us/en/library/application-notes/2024/using-the-systematic-screening-protocol-and-maxpeak-premier-columns-to-separate-seven-janus-kinase-inhibitors.html
- Fountain K, Hewitson H, Iraneta P, Morrison D. Practical Applications of Charged Surface Hybrid (CSH) Technology. Waters application note. 720003720. https://www.waters.com/nextgen/us/en/library/application-notes/2010/practical-applications-charged-surface-hybrid-csh-technology.html
- Smith K, Rainville P. Improved Analytical Sensitivity and Chromatographic Peak Shape for the Quantification of TCA Cycle Analytes in Human Plasma using the ACQUITY Premier System Solution. Waters application note. 720007107. https://www.waters.com/nextgen/us/en/library/application-notes/2020/improved-analytical-sensitivity-and-chromatographic-peak-shape-for-the-quantification-of-tca-cycle-analytes-in-human-plasma-using-the-acquity-premier-system-solution.html
- Waters Column Calculator User Guide Infographic. https://www.waters.com/nextgen/us/en/library/library-details.html?documentid=720007024&t=waters-WatersColumnsCalculatorUserGuide-720007024
720009042, September 2025