A Look at Column Reproducibility: Analysis of Endogenous Caffeine and Metabolites in Human Urine using Three Historical Batches of 1.8 µm HSS T3 Stationary Phase
Abstract
Urinalysis using Liquid Chromatography-Mass Spectrometry (LC-MS) and liquid chromatography with tandem mass spectrometry (LC-MS/MS) is a common test in both the clinical and metabolomic markets.1–3 A single assay, developed for a given group of analytes, can be performed for thousands for samples with the results having implications in patient health and in drug development and discovery. As such the reliability of the assay conditions, as well as the chromatographic column, are of paramount importance. Examining column reproducibility during method development adds certainty that a developed method will be applicable for as long as it is needed. LC-MS/MS analysis of urinary caffeine metabolites in urine was performed and shows that the HSS T3 stationary phase is a reliable stationary phase, as three batches made over a five-year span provide comparable results.
Benefits
- Comparable batch to batch performance for three historical batches of HSS T3 material
- Improved signal and detection using solid phase extraction compared to dilute and shoot methodology
Introduction
Having high quality products, particularly LC stationary phases and columns, ensures that the data generated for an assay is accurate and reproducible over time. The quality of LC stationary phases can be measured by batch to batch reproducibility testing for a given assay to ensure that each manufactured lot of material performs similarly. Most batch-to-batch tests are performed using three batches of material made within a certain time period, such as those within a method validation kit. While these kits work well, their use may only provide a snapshot of the overall quality of the product. To get the full picture, historical batches of material should be tested, as this provides a better scope of overall product quality.
The ACQUITY™ HSS T3 stationary phase is a commonly used C18 bonded phase using fully porous silica particles. This phase is designed to retain polar analytes better than a traditional C18 without compromising the separation of hydrophobic compounds by offering a lower ligand density stationary phase. The lower ligand density increases interaction with the base particle while being compatible with 100% aqueous mobile phases. This phase has been used in many applications and publications for separations ranging from small molecule pharmaceuticals in dosage form to bioanalytical applications.4–6 To demonstrate the quality of the HSS T3 material, three columns were packed with different batches of material. These materials were made five years apart ranging from 2016 to 2021. All three columns were then used to separate endogenous caffeine and metabolites in human urine after solid phase extraction (SPE) and dilute and shoot sample preparation.
Experimental
Sample Description
Human urine was diluted 1:1 with water prior to injection for the dilute and shoot experiment. For SPE, the sample was loaded onto a Oasis™ HLB 1 cc 30 mg cartridges (p/n: WAT094225) and washed with two times 1 mL of water before elution with two times 0.5 mL 100% acetonitrile. The eluate was dried under nitrogen at 60 °C and reconstituted in 100 µL Milli-Q water for analysis.
Method Conditions
|
LC Conditions |
|
|
LC systems: |
ACQUITY UPLC™ I-Class Plus with Binary Solvent Manager (BSM), Sample Manager Flow Through Needle (SM-FTN), and PDA Detector |
|
Detection: |
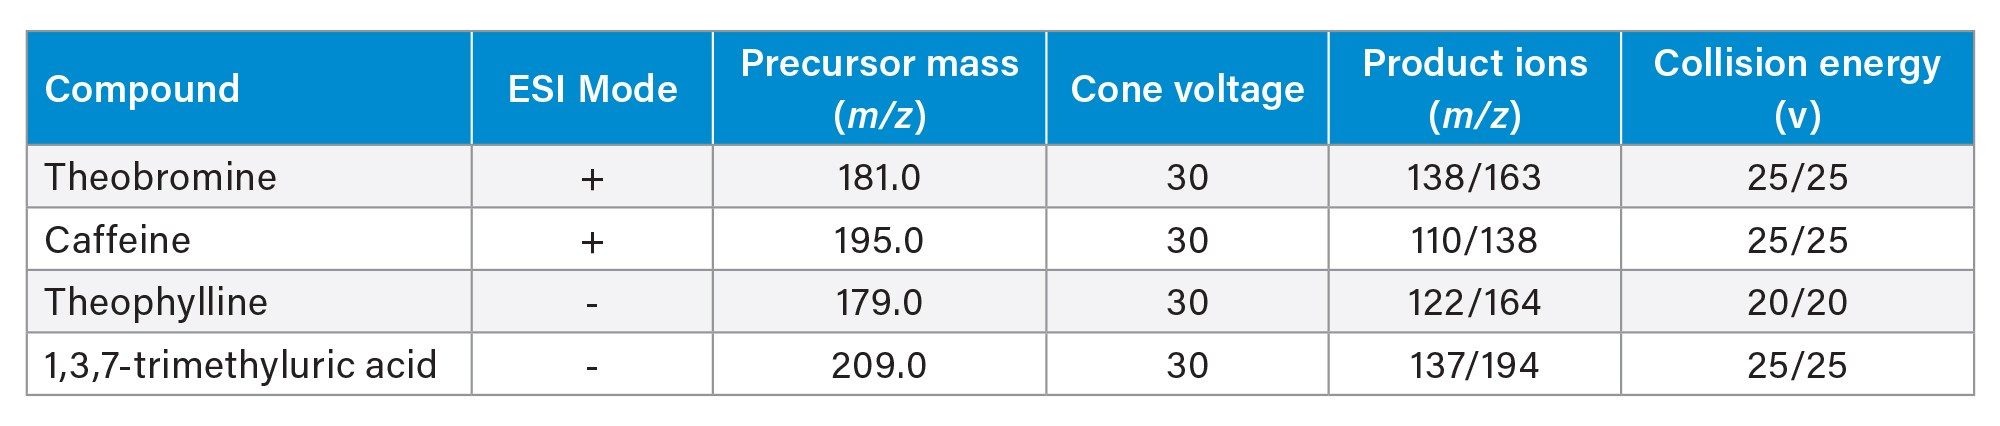
MRMs of caffeine metabolites outlined in Table 1 |
|
Column(s): |
ACQUITY UPLC HSS T3 1.8 µm, 2.1 x 50 mm (p/n: 186009467) Three batches of material: 188 – Manufactured Oct-2016 233 – Manufactured Nov-2019 270 – Manufactured Nov-2021 |
|
Column temp.: |
30 °C |
|
Sample temp.: |
10 °C |
|
Injection volume: |
5.0 µL |
|
Flow rate: |
0.6 mL/min |
|
Mobile phase A: |
0.1% Formic Acid in milli-Q water |
|
Mobile phase B: |
0.1% Formic acid in acetonitrile |
|
Gradient profile: |
2% to 25% B in 2.5 mins, hold at 25% B for 0.5 mins |
MS Conditions
|
MS system: |
Xevo™ TQ-S micro |
|
Ionization mode: |
ESI+, ESI- |
|
Acquisition range: |
MRMs outlined in Table 1 |
|
Capillary voltage: |
3.0 kV |
|
Cone voltage: |
Analyte dependent (Table 1) |
|
Desolvation temp.: |
500 °C |
|
Desolvation flow: |
500 L/hr |
|
Cone gas flow: |
10 L/hr |
Data Management
|
Chromatography software: |
Masslynx™ V4.1 |
Results and Discussion
Prior to column-to-column reproducibility testing, two different sample preparation techniques were evaluated. Typical dilute and shoot methods are common for urine analysis as the likelihood of endogenous compounds like phospholipids being present is low. Dilution of the sample is still required as urine can contain high concentrations of salts which can affect analyte retention, particularly for polar analytes. This was compared against SPE, which is more often used for plasma and serum matrices to remove phospholipids. SPE can also concentrate the analytes in a sample. This concentrative effect can prove beneficial for urine analysis as some analytes are found at extremely low concentrations. Figure 1 shows an overlay of the four analytes detected by MS/MS using SPE and dilute and shoot sample preparation.
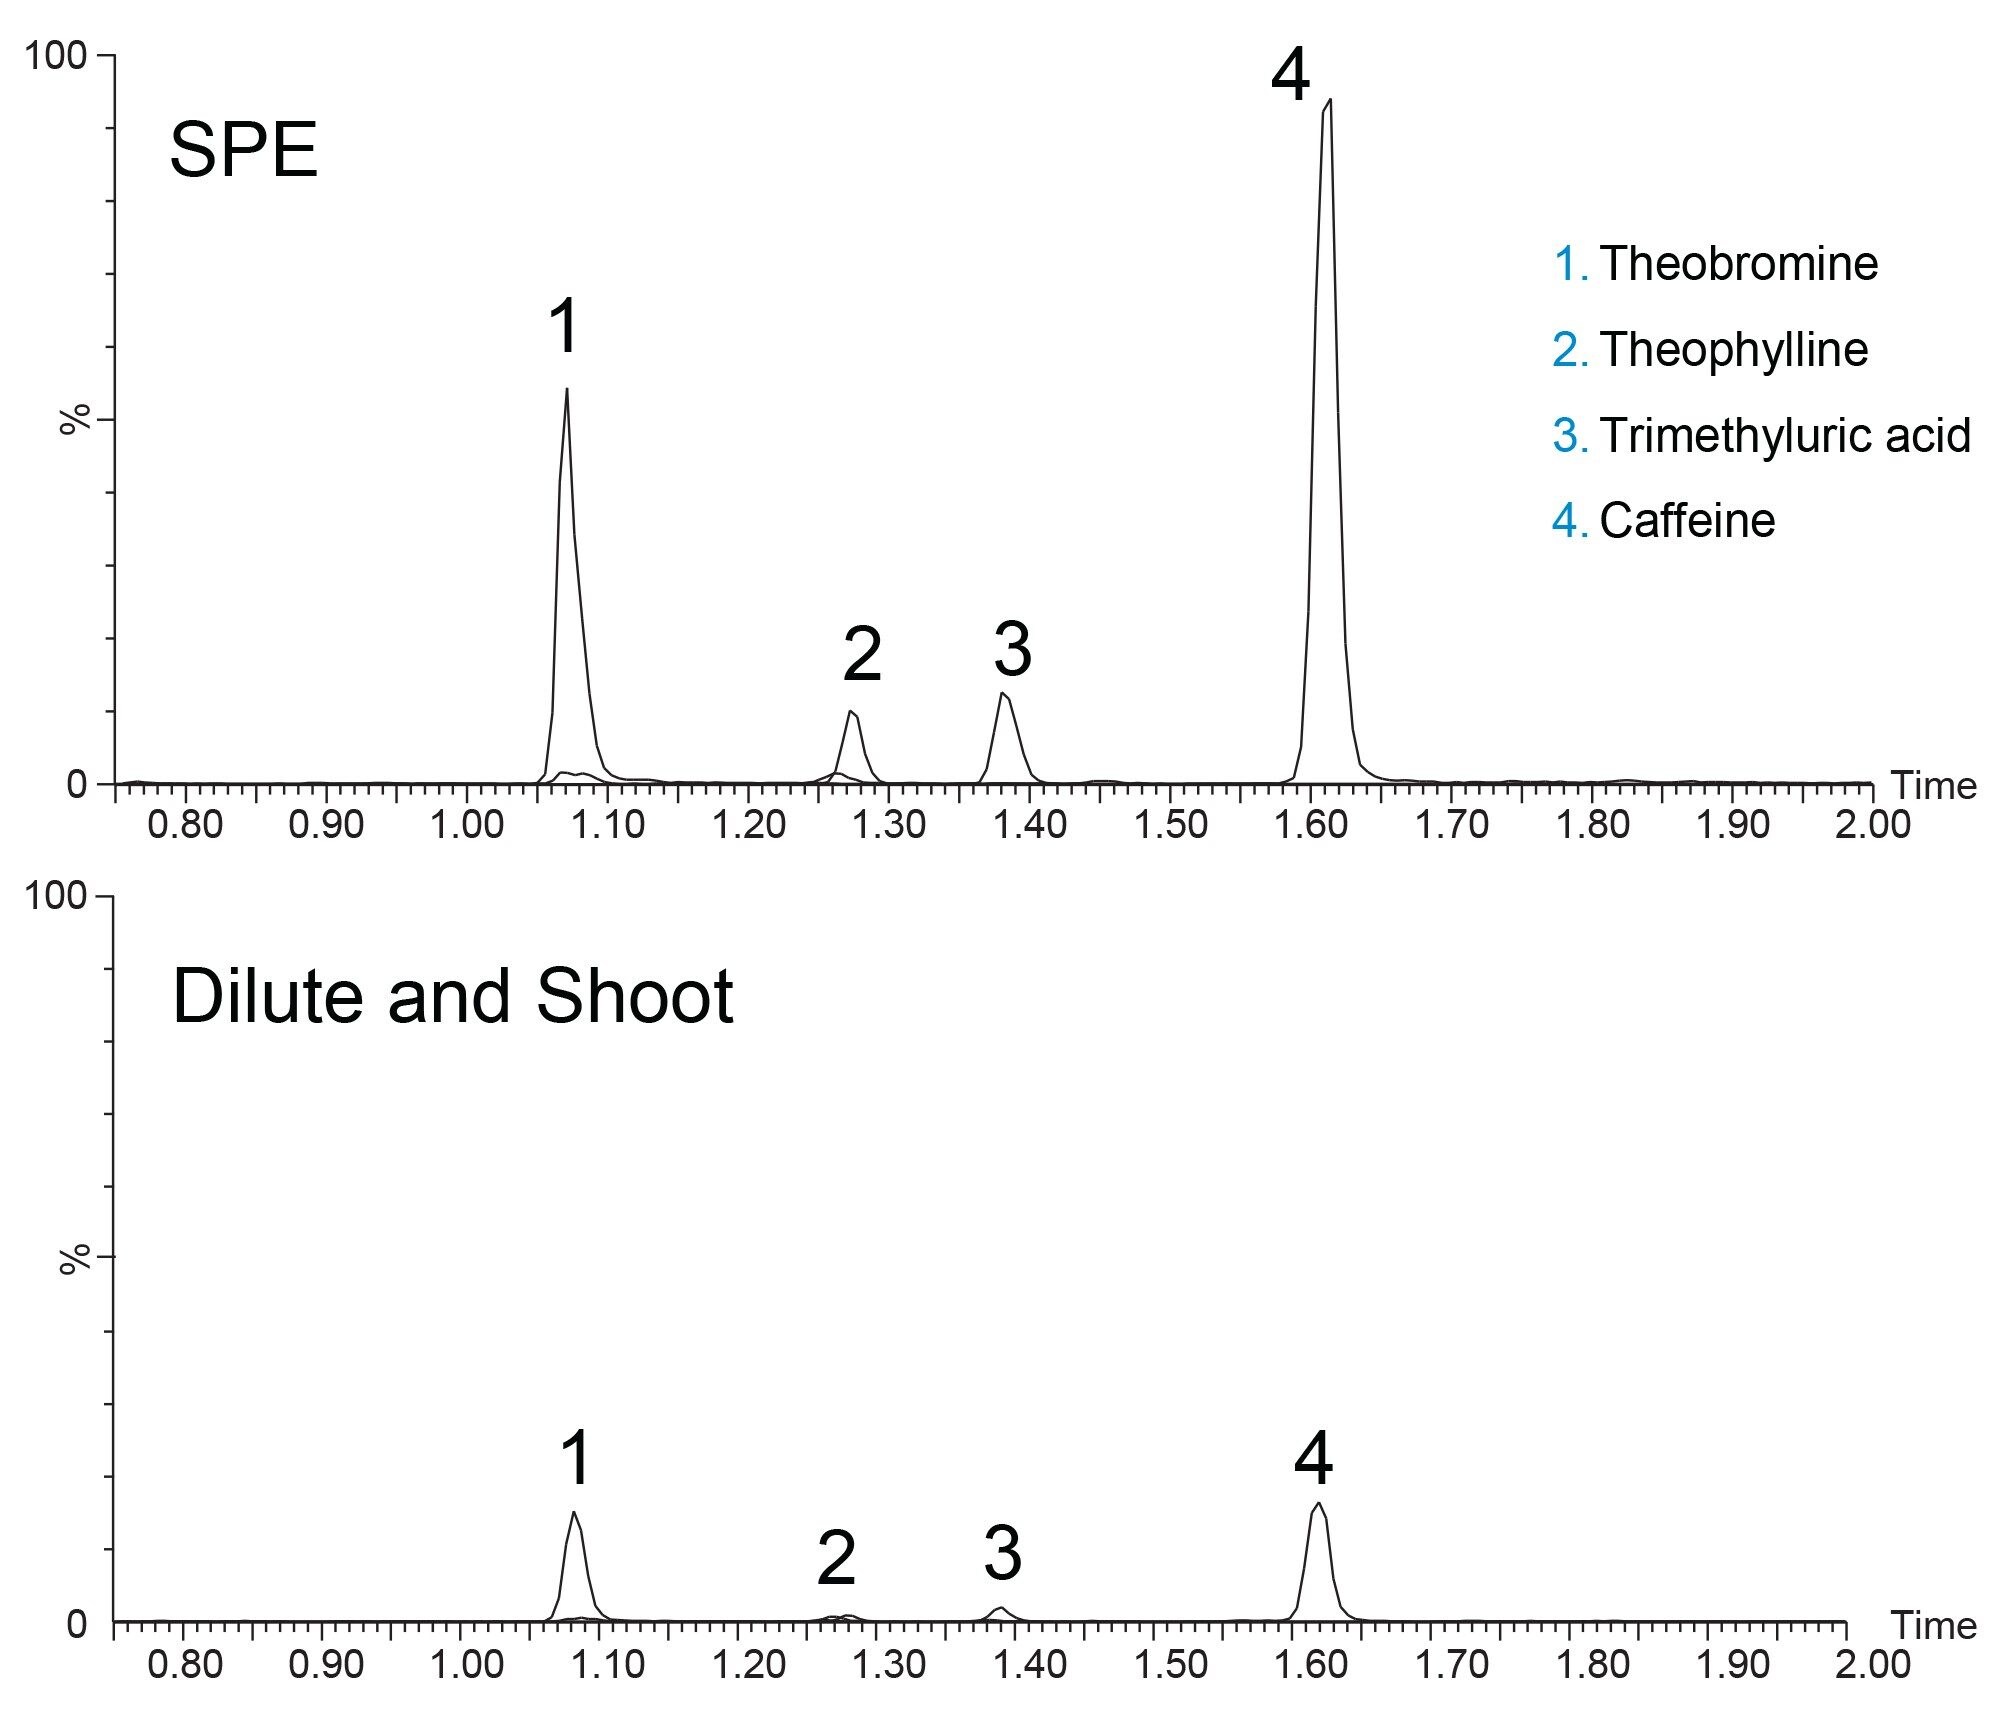
The intensity of the four analytes is considerably higher with SPE compared to dilution. The improved intensity could be due to the concentrative effect of SPE, or from improved ionization efficiency that could result from a cleaner sample. Achieving higher signal allows for lower limits of detection and quantitation, making methods more applicable over a wider dynamic range. Thus, for the batch to batch evaluation, SPE was used.
Three different batches of ACQUITY UPLC HSS T3 sorbent were packed into stainless steel hardware and used to analyze caffeine and its primary metabolites from human urine. The batches of material used to pack the columns were manufactured over a five-year span and all conformed to the rigorous quality control protocols in place for all Waters products. Figure 2 shows the chromatograms of caffeine and three of its primary metabolites, theobromine, theophylline, and 1, 3, 7-trimethyluric acid on all three HSS T3 columns.
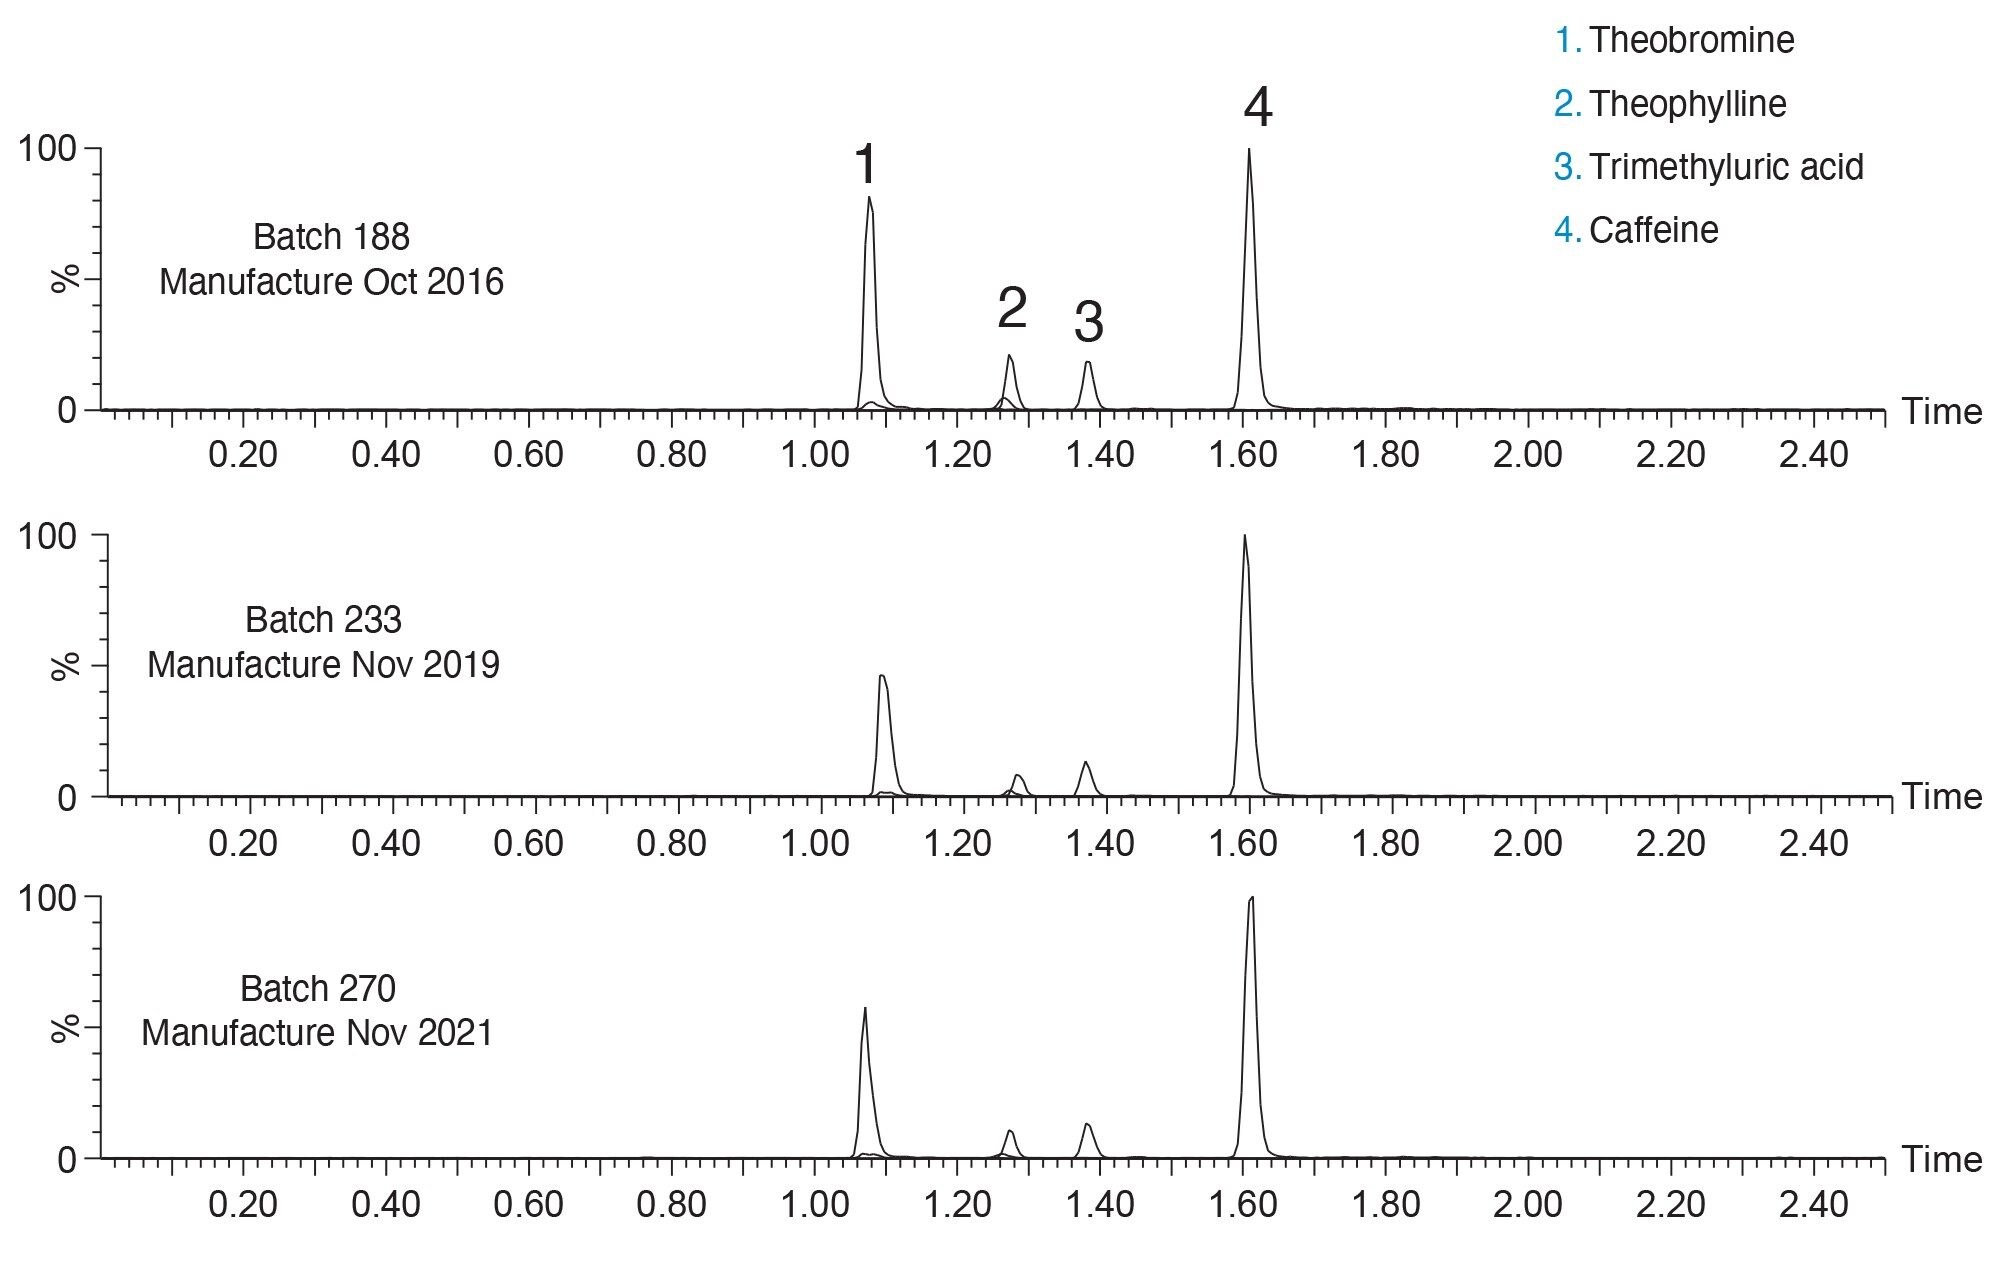
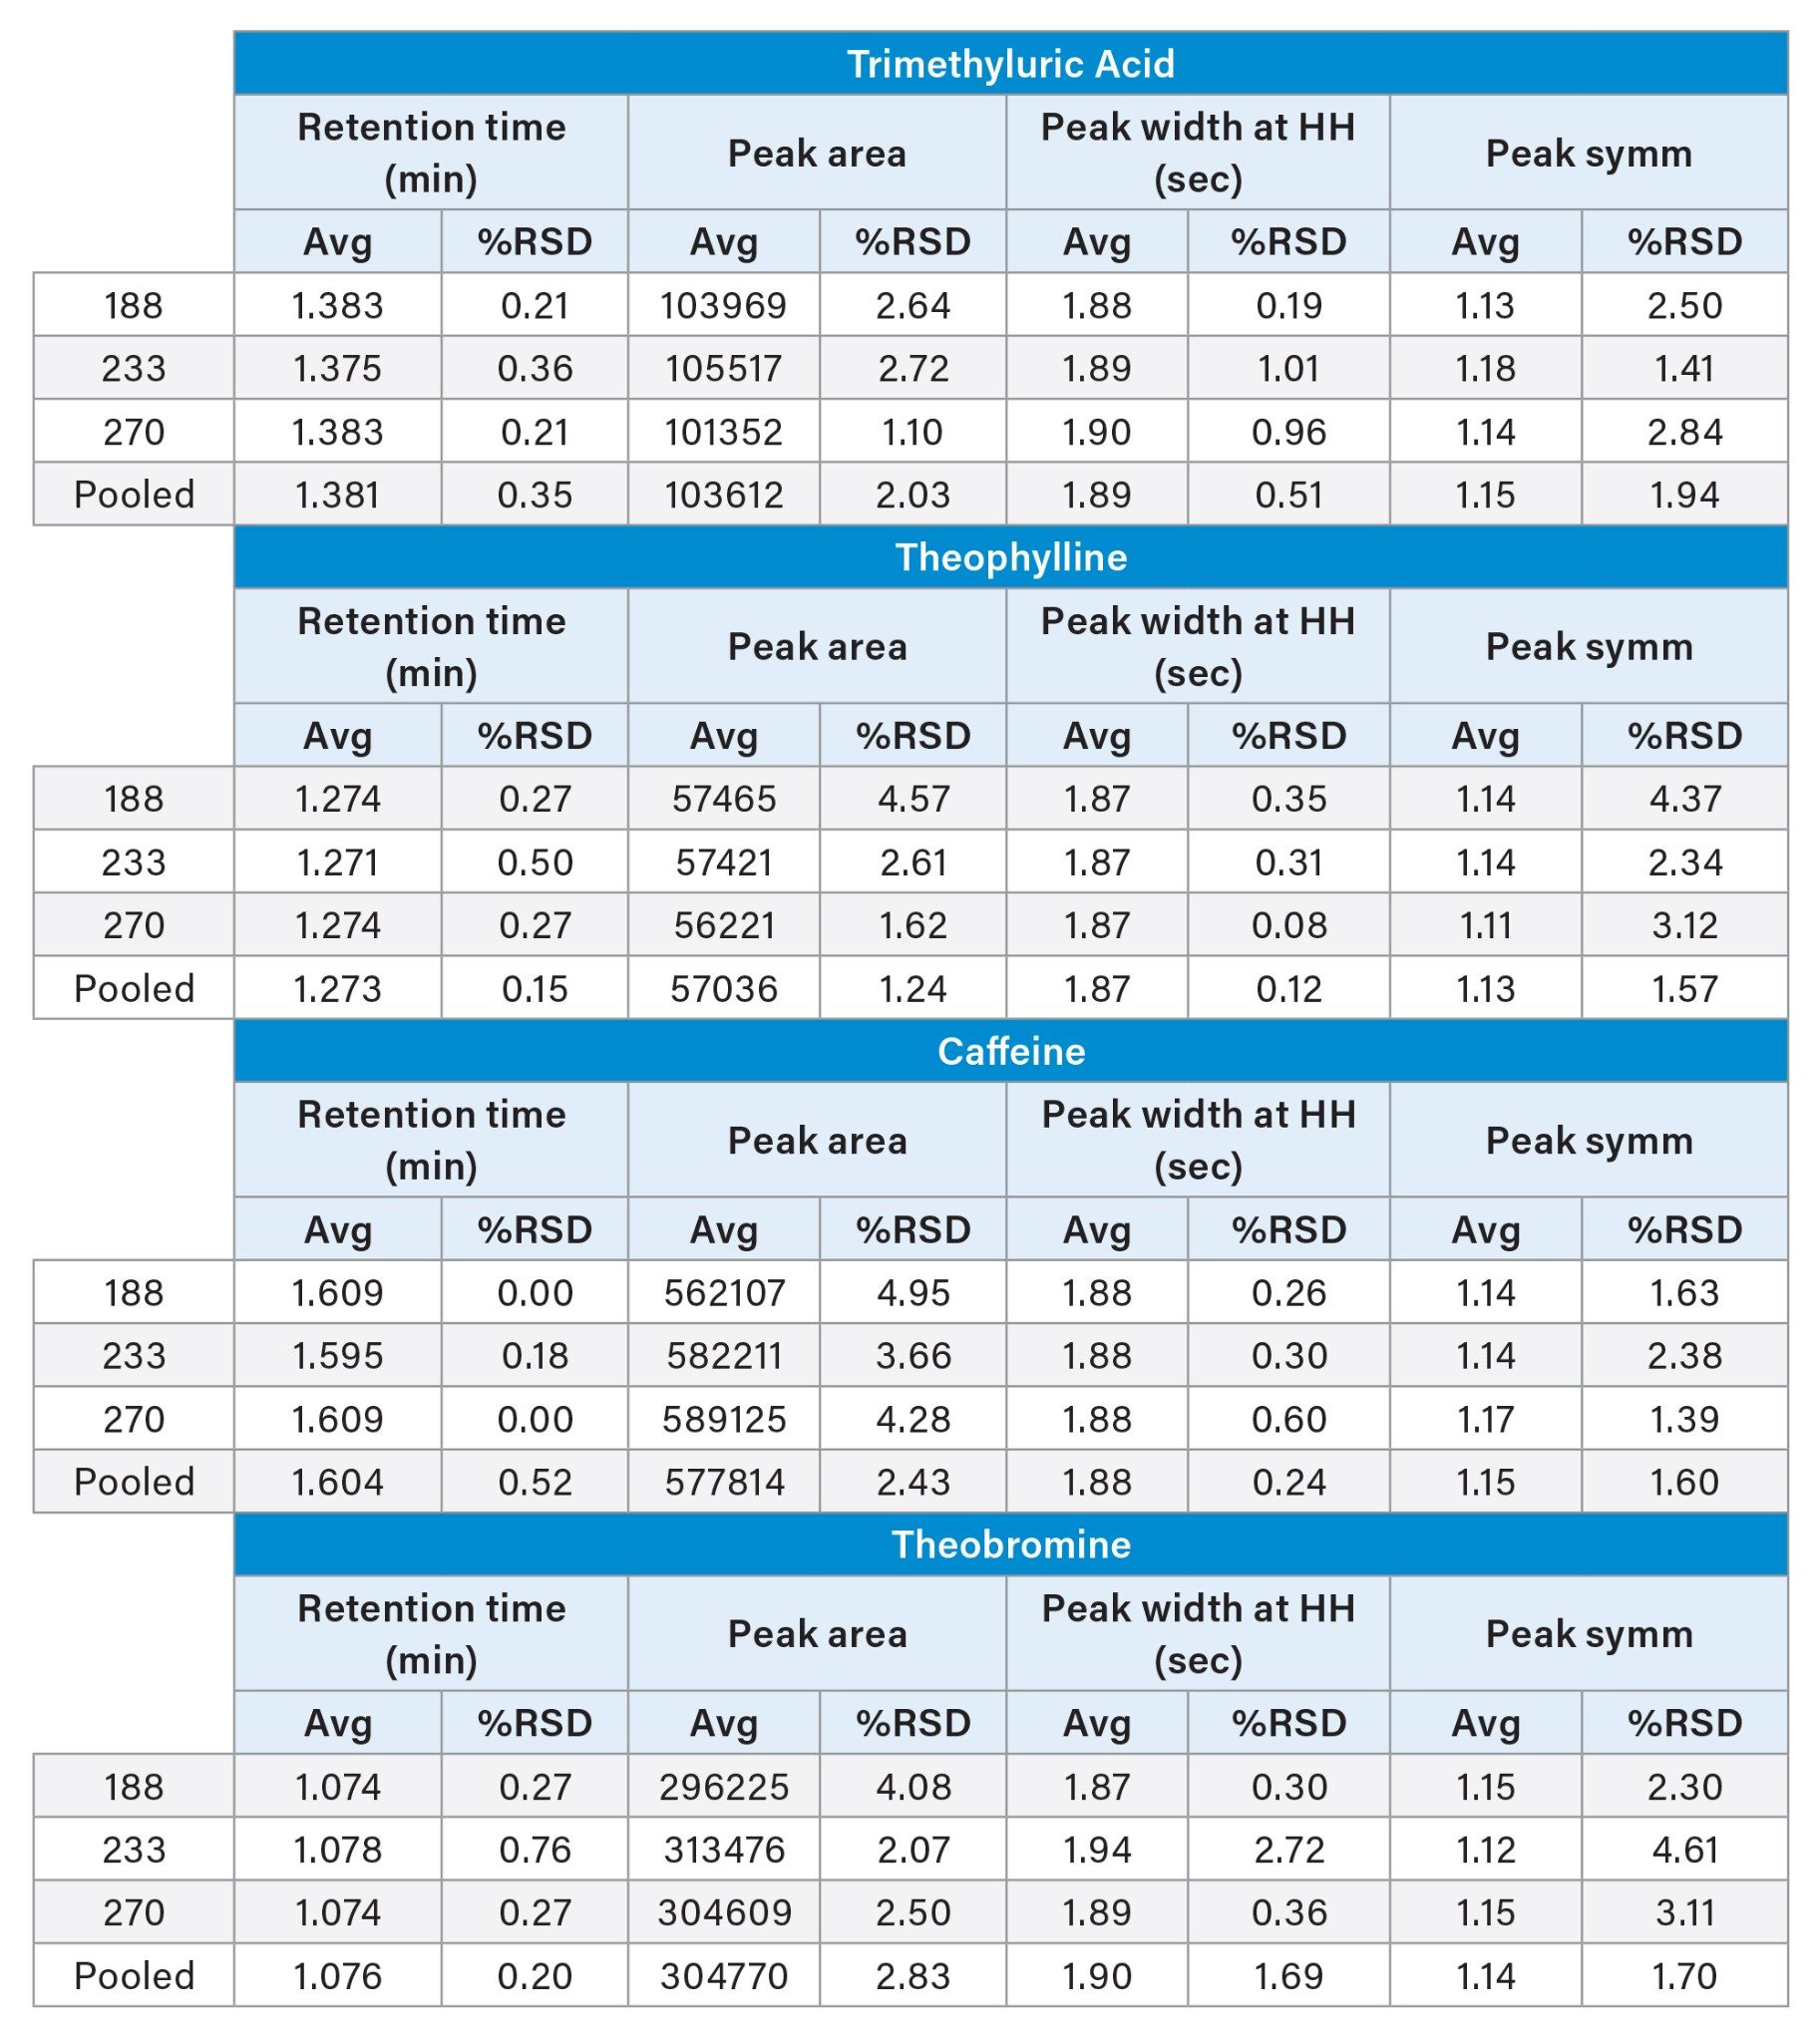
The three columns show comparable retentivity and selectivity for all four analytes. Parameters such as peak area, peak symmetry and peak width show reproducible results across all three columns. As shown in Table 2, %RSDs for peak retention time, peak area, peak width at half height, and peak symmetry are all below 5% for both a given column, as well as pooled data sets.
Conclusion
To demonstrate the quality of Waters’ particle and column manufacturing processes, three batches of ACQUITY HSS T3 stationary phase, manufactured over a five-year span, were used to separate endogenous caffeine and metabolites in human urine. SPE was used for all sample preparation for reproducibility testing as dilution did not produce adequate results.
The three batches showed reproducible chromatographic performance. %RSD values for retention time were <1% for each column as well as the pooled data set (n=9). Additionally, %RSDs for peak area, peak width, and peak symmetry were <5% for each detected analyte. These results indicate that even though the materials were made five years apart, the same quality of data can be generated. This level of assurance, that similar data can be achieved over years, is critical when developing new methods. Knowing that the selected stationary phase will be the same lot-to-lot and year-to-year allows for longer assay lifetimes without the need for additional revalidation.
References
- Wong GF, Lee WM, Li CK. Qualitative Screening of Amphetamine- and Ketamine-type Abuse Drugs in Urine Employing Dual Mode Extraction Column by Liquid Chromatography-Tandem Mass Spectrometry (LC-MS/MS). Journal of Analytical Toxicology. (2022).
- Peng KW, Klotz A, Guven A, Gray K, Friss T, et. al. Multiplexed LC-MS/MS Analysis of Methylsuccinic Acid, Ethylmalonic Acid, and Glutaric Acid in Plasma and Urine. Analytical Biochemistry. (2022).
- Jacyna J, Kordalewska M, Artymowicz M, Markuszewski M, Matuszewski M, Markuszewski M. Pre- and Post-Resection Urine Metabolic Profiles of Bladder Cancer Patients: Results of Preliminary Studies on Time Series Metabolomics Analysis. Cancers. (2022) 1210.
- New LS, Chan ECY. Evaluation of BEH C18, BEH HILIC and HSS T3 (C18) Column Chemistries for the UPLC-MS/MS Analysis of Glutathione, Glutathione Disulfide, and Ophthalmic Acid in Mouse Liver and Human Plasma. Journal of Chromatographic Science. (2008). 209–214.
- Mohamed, M. Stability Indicating New RP-UPLC Method for Simultaneous Determination of a Quaternary Mixture of Paracetamol, Pseudoephedrine, Chlorpheniramine, and Sodium Benzoate in (Cold-Flu) Syrup Dosage Form. Journal of AOAC International. (2022).
- Sottani C, Grignani E, Cottica D, et. al. Development and Validation of a Bioanalytical UHPLC-MS/MS Method Applied to Murine Liver Tissue for the Determination of Indocyanine Green Loaded in H-Ferritin Nanoparticles. Frontiers in Chemistry 2022.
- Thorn C, Aklillu E, McDonagh E, Klein T, Altman R. PharmGKB summary: Caffeine Pathway. Pharmacogenet Genomics. (2012) 389–395.
- Caffeine and Caffeine Metabolites – Urine Lab Procedure. Method UHPLC-ESI-MS/MS. Method number 4063.08. https://wwwn.cdc.gov/nchs/data/nhanes/2011-2012/labmethods/CAFE_G_MET.pdf Access 14-March-2022.
720007605, April, 2022