In this application note, we describe a streamlined N-linked glycan analysis solution for comparing an innovator biologic with a biosimilar, infliximab.
Waters has developed a total glycan analysis solution – beginning with the sample preparation using the GlycoWorks RapiFluor-MS N-Glycan Kit, transitioning to automated data collection and processing, continuing to data interpretation, and concluding with report generation using the Glycan Application Solution with UNIFI. This total solution significantly increases throughput, streamlines the entire workflow, simplifies sample preparation, and enables a broader community to successfully engage in glycan analysis.
UNIFI Software allows many different types of investigations to be conducted, and this application note demonstrated a comparison of innovator vs. biosimilar mAbs. For this type of comparative study, the tools within UNIFI Software allow users to quickly identify which glycans are present at different abundance levels between the different sample types.
This application note demonstrates the capability of our total N-linked glycan analysis solution, including: sample preparation and labeling using the GlycoWorks RapiFluor-MS N-Glycan Kit; analytical analysis using an ACQUITY UPLC H-Class Bio System coupled with a Xevo G2-XS QTof, controlled by UNIFI; and data processing/analysis using the Glycan Application Solution with UNIFI (FLR with MS confirmation) for innovator vs. biosimilar infliximab glycan profile comparisons.
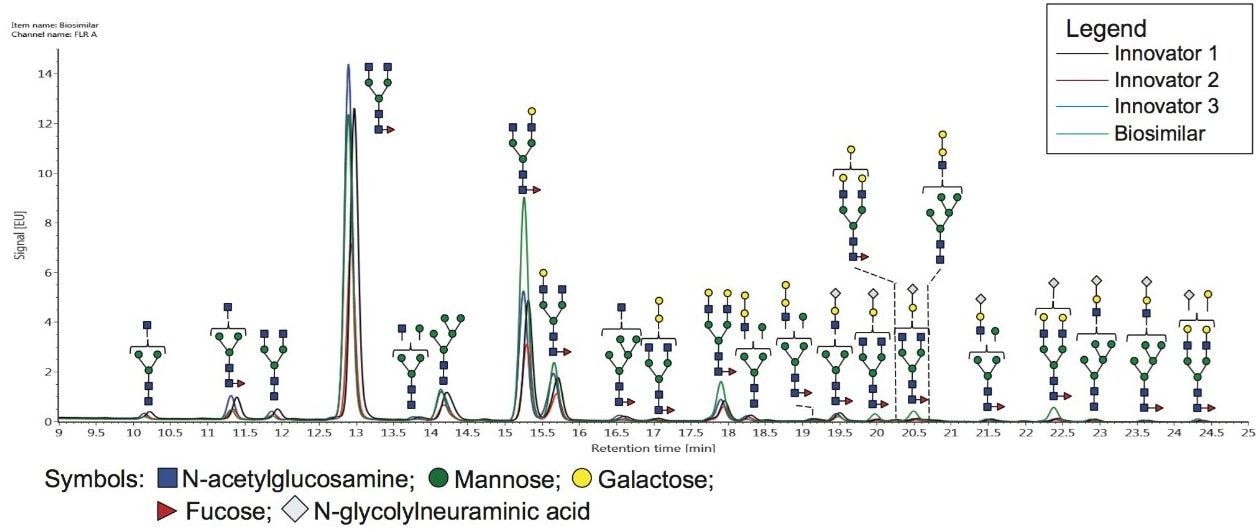
Over the next few years, the patents for a number of innovator monoclonal antibody- (mAb) based pharmaceuticals will expire, allowing other companies to introduce less expensive “generic” products onto the market. These so-called biosimilars must be subjected to characterization tests in order to determine that their physicochemical properties match those of the innovator molecule. One such test is a glycan profiling comparison between the innovator and biosimilar candidate mAbs. Since N-linked glycans are known to influence a number of drug properties – for example, levels of core fucosylation can mediate the antibody-dependent cellular cytotoxicity of mAb products – the glycan profiles of biosimilar mAbs should ideally mimic those of the innovator molecules, qualitatively and quantitatively, as closely as possible.1
In this application note, we describe a streamlined N-linked glycan analysis solution for innovator vs. biosimilar comparisons. This beginning-to-end platform is comprised of three main components: chemistry (sample preparation), hardware (analytical analysis), and software (data collection and analysis). Our solution begins with a simplified and straightforward sample preparation procedure using the Waters GlycoWorks RapiFluor-MS (RFMS) N-Glycan Kit. This kit not only introduces an easy-to-use glycan sample preparation protocol that can reduce invested time to less than one hour, but it also enhances optical and mass spectrometry signals for RFMS-labeled glycans.2
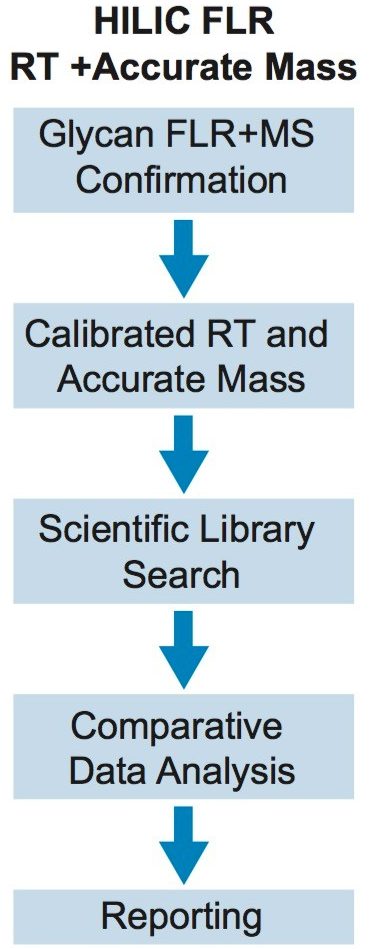
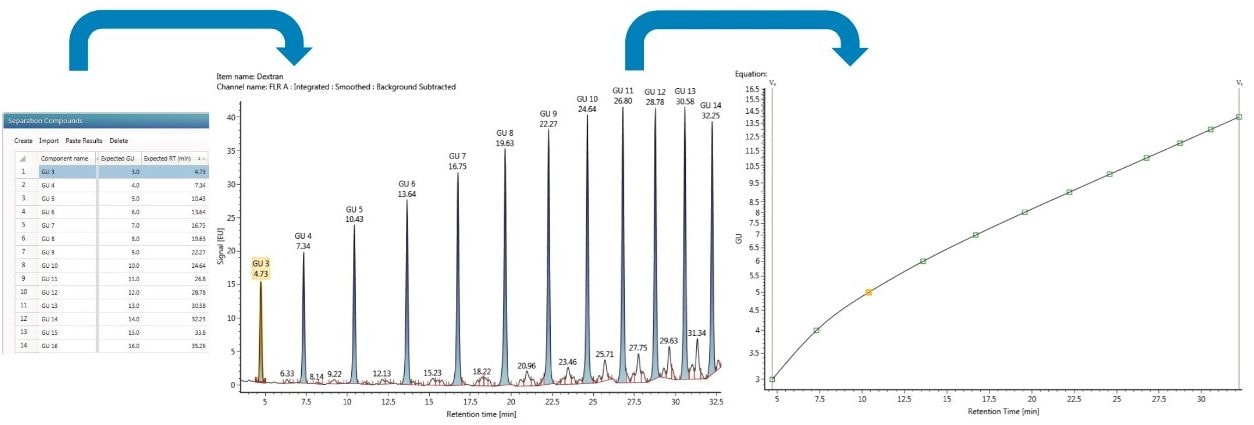
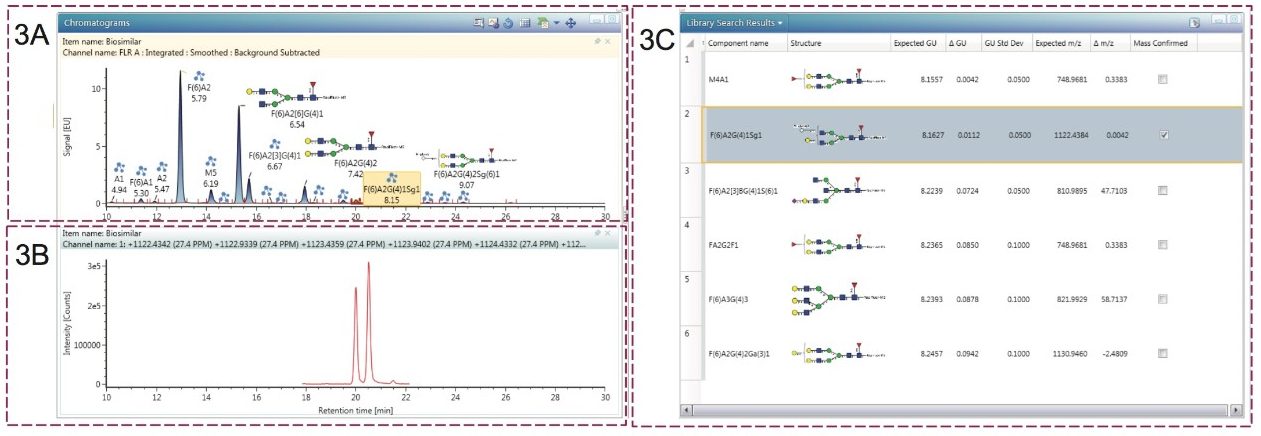
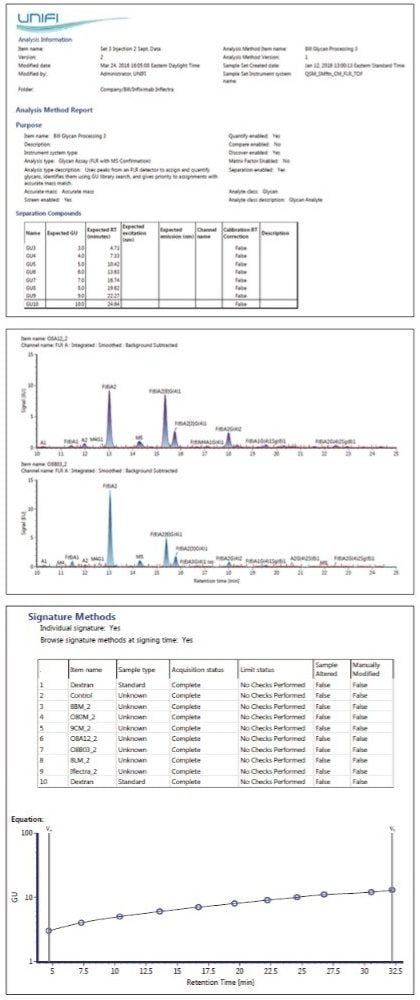
After preparation, the samples were analyzed using an ACQUITY UPLC H-Class Bio System consisting of solvent, sample, and column managers, and a fluorescence (FLR) detector interfaced directly to a Xevo G2-XS QTof Mass Spectrometer. The analytical system was controlled by UNIFI Software, which was also used to process the data using the Glycan Application Solution (FLR with MS confirmation) workflow. A key component of this feature is a scientific library search function, based on Glucose Units (GU), for glycan assignment.
We utilized a prerelease demo GU library of RFMS-labeled glycans to illustrate its value.3 In collaboration with the National Institute for Bioprocessing Research and Training (NIBRT) in Dublin, Ireland, we are currently in the final developmental stages of a full-scale GU library for RFMS-labeled N-linked glycans, similar to the library we previously developed for 2-aminobenzamide- (2-AB) labeled glycans.4
Column: |
ACQUITY UPLC Glycan BEH Amide, 1.7 μm, 2.1 mm x 150 mm |
Column temp.: |
60 °C |
Mobile phase A: |
50 mM ammonium formate, pH = 4.4 in LC-MS grade water |
Mobile phase B: |
LC-MS grade acetonitrile |
Detection: |
ACQUITY UPLC FLR, Ex 265 nm/Em 425 nm |
Time |
%A |
%B |
Flow (mL/min) |
Curve |
---|---|---|---|---|
0 |
25 |
75 |
0.4 |
6 |
35 |
46 |
54 |
0.4 |
6 |
36.5 |
80 |
20 |
0.2 |
6 |
39.5 |
80 |
20 |
0.2 |
6 |
43.1 |
25 |
75 |
0.2 |
6 |
47.6 |
25 |
75 |
0.4 |
6 |
55 |
25 |
75 |
0.4 |
6 |
Data acquisition mode: |
Positive sensitivity |
|
Capillary: |
3.00 kV |
|
Sampling cone: |
80 V |
|
Source temp.: |
120 °C |
|
Desolvation temp.: |
300 °C |
|
Cone gas flow: |
20 L/h |
|
Desolvation gas flow: |
800 L/h |
|
Data acquisition range: |
500–2000 m/z |
|
Lockmass: |
Glu Fibrinopeptide B at 100 fmol/μL in 50:50 water–acetonitrile, 0.1% formic acid |
|
Data management: |
UNIFI Scientific Information System, Glycan Application Solution with UNIFI, GU Library search tolerance (ΔGU): 0.2 |
Samples from three different batches of innovator infliximab (Remicade®), originating from an SP2/0 mouse cell line, were purchased from Jenssen Biotech, Inc. (Horsham, PA). One batch of biosimilar infliximab (Inflectra®) – produced by a Chinese hamster ovary (CHO) cell line – was obtained from an outside collaborator. All of the samples were stored at -80 °C before analysis.
The GlycoWorks RapiFluor-MS N-Glycan Kit coupled with the Glycan Application Solution (FLR with MS confirmation) with UNIFI provides users with a total N-linked glycan analysis solution, beginning with sample preparation and continuing through to data collection/analysis and ultimately reporting. The need for an easy, beginning-to-end solution is exemplified by the biopharmaceutical industry where the N-linked glycans on products act as critical quality attributes and must be monitored throughout the development of a therapeutic protein. During this process, detailed N-linked glycan information is required; frequently, many samples must be analyzed quickly to expedite the product development. Similarly, this type of analysis is required by companies developing biosimilar mAbs where the profiles should mirror those of the innovator profile as closely as possible to demonstrate similarity.
A primary goal of our solution was to simplify the entire process and enable a broader user base to successfully engage in glycan analysis. Traditionally, N-linked glycan structural characterization has been a laborious process, requiring tandem MS analyses, exoglycosidase digestions, etc., and has been undertaken only by highly skilled and trained scientists. A key feature of the Glycan Application Solution with UNIFI (FLR with MS confirmation) is the ability to conduct library searches for glycan structural identification – opening the door to many other scientists to successfully perform N-linked glycan analyses.
The Glycan Application Solution (FLR with MS confirmation) workflow has five main steps, as shown in Figure 1: FLR and accurate mass data collection; data processing, including normalization of HILIC retention times to GU values and Lockmass calibration; GU library searching of RFMS-labeled glycans; comparative analysis; and reporting. This total solution allows users to conduct a variety of glycan analysis experiments, including the innovator vs. biosimilar comparisons shown here.
Following the analytical analysis, the results are processed. The first step is to convert the HILIC retention times for RFMS-labeled glycans to GU values. This is done by including an analysis of a novel RFMS-labeled dextran ladder with known GU values in the sample set and using a cubic spline fit, as shown in Figure 2, to determine the GU values of innovator and biosimilar glycans.6 Conversion of retention times to GU values reduces day-to-day, instrument-to-instrument, laboratory-to-laboratory, and column-to-column variations frequently associated with HILIC retention times. Using GU values rather than raw retention times facilitates a straightforward and more reproducible library search for glycan structural identification.
The processed results for a run of the N-linked glycans derived from the biosimilar are presented in Figure 3. In this screenshot of the “Review” tab, 3A shows the FLR trace annotated by UNIFI Software with the glycans identified by the GU library search. Clicking on any of the structures displays the extracted mass chromatogram, as shown for the selected glycan in 3B. 3C depicts the library search results. Here, all of the glycans within the tolerance (ΔGU) window – 0.2 for this study – are displayed. To improve the accuracy of the search, MS data is used for confirmation.
For the particular glycan selected in 3A, an ion at the m/z value of 1122.4379 was observed and matched a glycan in the scientific library search results within a 5 ppm window. No other candidate glycans could be mass confirmed for this GU value, thus reliably confirming the structure. In total, the library search identified 23 mass-confirmed glycans for the innovator mAb and 22 for the biosimilar product, all of which were present on the innovator molecule.
To compare the results of different sample origins, several tools within UNIFI may be utilized. Under the “Investigate” tab, selected FLR traces can be stacked for a direct comparison (Figure 4). This trace demonstrates that at least qualitatively, the two samples are indeed quite similar.
In this application note, we use the following glycan nomenclature: F- Fucose; G- Galactose; Sg- N-glycolylneuraminic acid, Ga- α-linked Galactose; A1- Monoantennary, A2- Biantennary. Numbers with parentheses indicate the preceding monosaccharide’s linkage while those not in parentheses indicate the preceding characteristic’s number. For example, F(6)A3G2GaSg represents a core fucosylated triantennary glycan with 2 galactoses directly attached to an antenna, 1 galactose linked via an α linkage, and one antenna terminated with an N-glycolylneuraminic acid.
To begin to identify glycans that are expressed at different abundance levels, a difference plot between two samples can be generated in the “Investigate” tab. This plot compares the raw FLR peak intensities. Such a plot is shown in Figure 5, where the biosimilar mAb is shown as the top trace in green, the innovator product is the black trace on the bottom, and the difference in peak intensity between the two samples is shown as the red trace. From this plot, the F(6)A2 structure (refer to the caption of Figure 4 for the nomenclature used throughout this application note) was observed with similar levels on both mAbs – based on the peak intensities – and was the most abundant glycan. The second most abundant glycan, F(6)A2G(3)1, appears to be more abundant on the biosimilar mAb – again, based on peak intensity.
Other potential changes of interest may be associated with several lower-abundance glycans that eluted later in the analysis, as seen in the inset of this figure. These glycans were terminated with N-glycolylneuraminic acid and the difference plot suggests that these structures may be elevated in their abundances on the biosimilar pharmaceutical. It is important to note that the enhanced MS signal intensity afforded by RFMS is critical to mass confirmation of the GU library search results for these lower abundance glycans and those possessing sialic acids.
To confirm the changes observed in the difference plot, a summary plot of all of the samples designated as “unknown” in the sample set is available under the “Review” tab. Several different parameters may be selected for this comparison; for this study, “% amount” was used. When this parameter is selected, the results are reported as normalized values where normalization is given as a percentage of the total FLR peak areas of all glycans identified for the selected glycan. This type of plot of is shown in Figure 6A for the F(6)A2G2Sg glycan and demonstrates that this particular glycan may be elevated in the biosimilar product.
Figure 6B presents a summary plot for a glycan with a pair of galactose units connected via an α linkage. According to the plot, this particular glycan appears to be elevated in its abundance level on the innovator mAb. While these plots only show one injection for this study, the results were reproducible and repeatable (RSDs less than 1%) when averaged across the triplicate sample preparations. In general, the results generated by the tools in UNIFI indicate that the glycan profiles between the innovator and biosimilar mAbs are quite comparable for the higher abundance glycans, and are in good agreement with a previous study – though some differences may be present for lower-abundance species.7
Reporting is another feature available in UNIFI Software (Figure 7). Reports are highly customizable. Basic information such as the sample list, instrumental parameters, and GU calibration can be included. Advanced information may include annotated FLR traces, extracted mass chromatograms, and summary table.
Waters has developed a total glycan analysis solution – beginning with the sample preparation using the GlycoWorks RapiFluor-MS N-Glycan Kit, transitioning to automated data collection and processing, continuing to data interpretation, and concluding with report generation using the Glycan Application Solution with UNIFI. This total solution significantly increases throughput, streamlines the entire workflow, simplifies sample preparation, and enables a broader community to successfully engage in glycan analysis. UNIFI Software allows many different types of investigations to be conducted, and this application note demonstrated a comparison of innovator vs. biosimilar mAbs. For this type of comparative study, the tools within UNIFI Software allow users to quickly identify which glycans are present at different abundance levels between the different sample types.
720005753, July 2016