In this application note, we demonstrate how data collection using ACQUITY UPLC with the SYNAPT MS provides high chromatographic resolution, ample sensitivity, and superior mass accuracy to identify many of the impurities in the quetiapine hemifumarate drug substance. MSE provides simultaneous acquisition of both high and low collision energy, maximizing the information gathered from a single injection. This analytical workflow was followed by a deliberate data processing workflow that streamlines the fragment analysis and structural elucidation process and provided greater confidence in the end results. This workflow-based approach delivers the rapid and systematic set of comprehensive results that are needed to identify and confirm impurities in an API impurity profile.
The ability to understand the levels of pharmaceutical impurities is not only a regulatory necessity, but a business imperative. Analytical determination of impurities is often time-constraining and resource-consuming. Analysts require a range of mass spectrometry capabilities as well as sophisticated software to facilitate data processing of these complex impurity data sets.
Here, we explore a multidisciplinary approach to impurity analysis using a systematic workflow that is capable of highly specific and highly sensitive detection and determination of impurities that are present in quetiapine hemifumarate active pharmaceutical ingredient (API) drug substance. The designed approach incorporates superior chromatographic resolution, confident impurity identification, and rapid structural elucidation facilitated by intelligent and user-friendly software. This workflow-based methodology improves the ability to evaluate known and unknown impurities in a pharmaceutical drug substance.
Using a variety of software solutions within a central chromatographic data system, results are reported in the MetaboLynx XS data browser. The software intelligently processes chromatographic and exact mass data to report retention times, peak area, mass accuracy, and isotope distribution values for m/z found. Elemental compositions are confirmed for known impurities and proposed for unknown impurities. The software also performs a fragment analysis, correlating the precursor ion information of the low-energy-collision MS scan to that of the product ion information of the high-energy MS scan. The high-collision energy MS scan data is imported into the MassFragment Software, where structural fragmentation pathways of the impurity compounds are proposed based on the likelihood of breaking certain bonds.
LC system: |
ACQUITY UPLC |
Column: |
ACQUITY UPLC BEH C18, 100 x 2.1 mm, 1.7 μm |
Temperature: |
65 °C |
Injection vol.: |
3 μL |
Mobile phase A: |
20 mM Ammonium Bicarbonate, pH 10 |
Mobile phase B: |
Acetonitrile |
Detection: |
ACQUITY UPLC PDA at 250 nm |
Time (min) |
Flow (mL/min) |
%A |
%B |
Curve |
---|---|---|---|---|
Initial |
0.800 |
85.0 |
15.0 |
Initial |
1.31 |
0.800 |
85.0 |
15.0 |
6 |
10.49 |
0.800 |
61.0 |
39.0 |
6 |
14.40 |
0.800 |
57.0 |
43.0 |
6 |
18.03 |
0.800 |
5.0 |
95.0 |
6 |
20.00 |
0.800 |
5.0 |
95.0 |
6 |
MS system: |
SYNAPT MS |
Source: |
ES positive |
Capillary: |
1.5 kV |
Sample cone (V): |
40 V for reference 35 V for analyte |
Extraction cone: |
4.0 V |
Desolvation temp.: |
450.0 °C |
Source temp.: |
120.0 °C |
Desolvation flow: |
900.0 L/Hr |
Acquisition range: |
100 to 1000 m/z |
Scan time: |
0.095 sec |
Interscan delay: |
0.02 sec |
Lock mass: |
300 pg/μL Leucine/Enkephalin at 50 μL/min |
MSE settings: |
4 eV low collision energy 20 eV high collision energy |
MetaboLynx XS and MassFragment application managers for MassLynx 4.1 Software
The workflow approach shown in Figure 1 may require several iterations to determine the accurate result for the unknown peak of interest. Evaluation of the data can be more involved depending on the complexity of the compound; however, the general workflow remains constant. The benefit of this approach is that it provides a systematic data-driven association to correlate the variety of data acquired by the two scan functions generated by MSE experiments.
The MetaboLynx XS Application Manager provides the flexibility to apply user-defined filters to configure how the reported data is viewed in the browser window. Some useful techniques to apply meaningful data filters were identified by investigating proper integration parameters. Mass defect filters, the dealkylation tool, spectrum intensity thresholding, and selection of components relative to the compound in the elemental composition tab all proved highly useful in displaying more confident data.
For example, to get elemental composition for every peak found in a chromatogram, the analyst would typically have to combine MS scans and perform background subtraction for each peak of interest and then generate individual elemental composition reports. To streamline this process, the MetaboLynx XS browser populates all impurity peaks integrated in the Tof-MS ES+ chromatographic trace with associated elemental compositions, mass accuracy, and isotope pattern scoring using i-FIT, and displays the results in a single window (Figure 2).
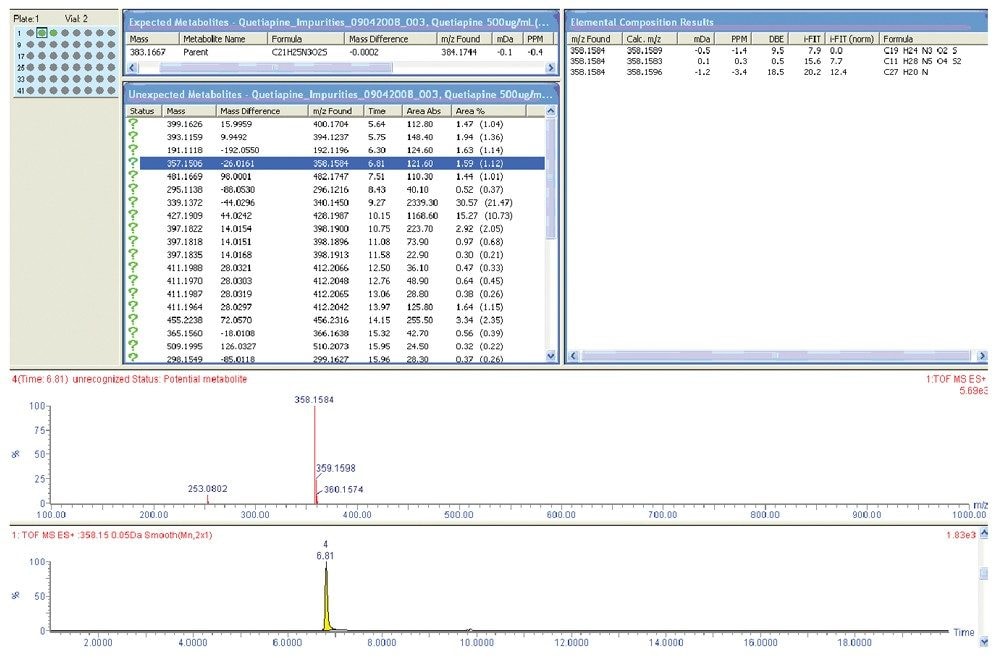
Evaluation of the unknown impurity peaks by exact mass and elemental composition of quetiapine hemifumarate using MetaboLynx XS indicated that the mass accuracy of the API quetiapine was reported to be 0.4 ppm. A total of 80 impurity peaks were listed. Upon adjustments to integration and data filtering, 44 peaks were found to be relevant. Non-relevant peaks were observed to be anomalies of initial integration of noise and peaks with extremely low-level response in UV and MS detection.
Ten known impurities were observed with an average mass accuracy of 1.3 ppm. Two known masses, 398.19xx and 412.20xx, had three and four separate retention times listed, respectively. The masses with multiple chromatographic retention times, which indicated possible structural isomers, were:
[M+H] = 398.19xx observed four peaks, three of which met the reporting threshold. The observed [M+H] = 398.1900, 398.1896, 398.1913 at retention times (RT) of 10.75 min., 11.08 min., and 11.58 min., with measured mass accuracies of 0.5 ppm, 1.5 ppm, and 2.8 ppm, respectively, resulted in an identified elemental composition of C22H28N3O2S
[M+H] = 412.20xx observed five peaks, four of which met the reporting threshold. The observed [M+H] = 412.2066, 412.2048, 412.2065, and 412.2059 at retention times (RT) of 12.50 min, 12.76 min, 13.06 min, and 13.97 min, with measured mass accuracies of 1.7 ppm, 2.7 ppm, 1.5 ppm, and 4.1 ppm, respectively, resulted in an identified elemental composition of C22H29N3O2S. In terms of the unknowns that were identified, of 21 entries for 15 chromatographic peaks:
Peaks identified as doubly charged species:
Peaks with multiple m/z ions; which could be possible coelutions, included:
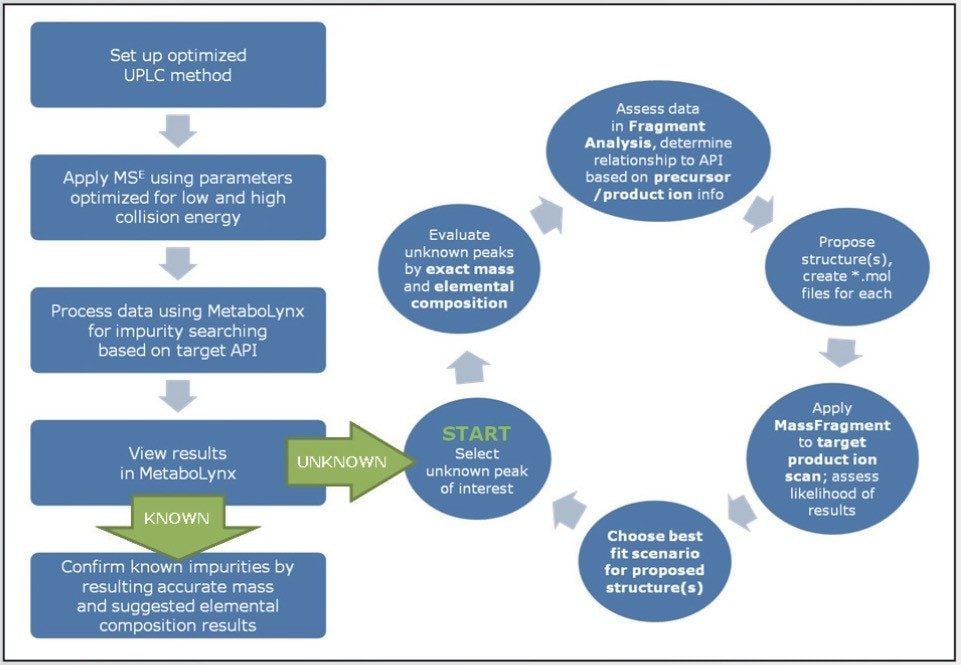
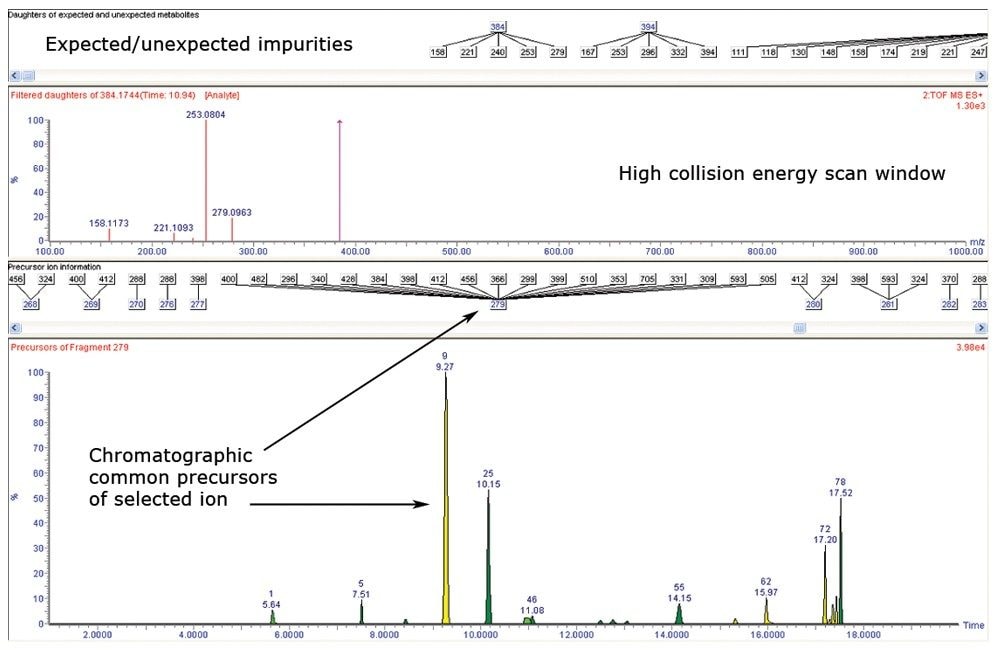
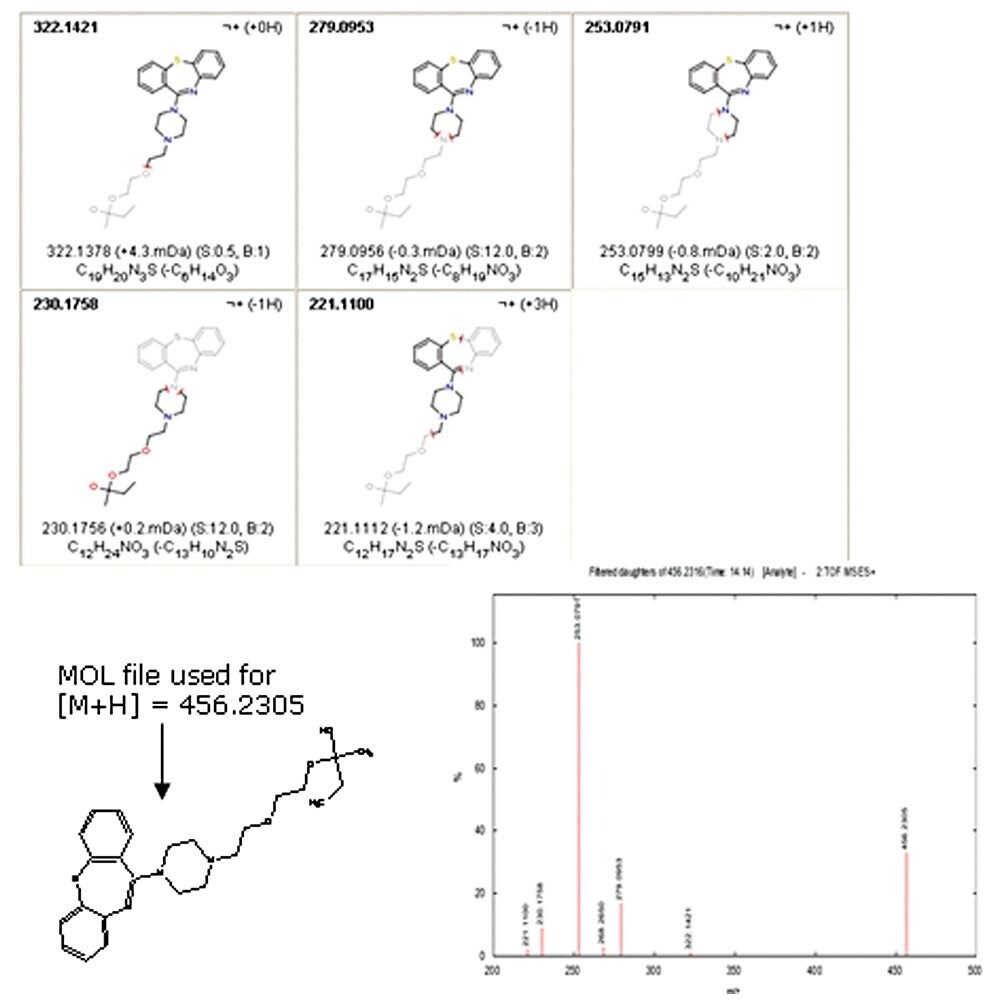
From these data, we can generate and assess the data in the Fragment Analysis function of MetaboLynx XS by determining the relationship to the API based on the MSE precursor/product ion information.
The Fragment Analysis tool aligned the high and low collision energy data that were simultaneously collected during the MSE acquisition. The resulting information was displayed in a collective window where the precursor and the collision-induced product ions were evaluated spectrally and presented chromatographically. The Fragment Analysis window allowed for numerous iterations by the analyst to assess common fragment ions between peaks of interest (Figure 3). Commonalities were observed between known impurity structures and fragmentation patterns that aided in proposing the structures of other unknown impurity entities.
The assessment of the common fragment ions of quetiapine identified the major fragment ions to be m/z 279, 253, 221, and 158:
MassFragment is a chemically-intelligent software tool that combines the aligned high and low collision energy data in the MetaboLynx XS Fragment Analysis window with the user’s input about a hypothesized structure to facilitate structural elucidation. Prior to performing the elucidation procedure, a proposed parent structure (or structures) is saved as a “*.mol” file.
Upon opening MassFragment, a dialog window prompts the selection of the *.mol file. The fragment ion information from the Fragment Analysis product ion’s high-collision-energy scan window of the selected observed impurity mass automatically exports to MassFragment along with the *.mol file. Potential structures are assigned and scored for the precursor ions in the isotopically-filtered spectrum.
Figure 4 shows an example of the report generated by MassFragment for the unknown impurity [M+H] 456.2305. Other conclusions determined by the MassFragment data included:
Data collection using ACQUITY UPLC with the SYNAPT MS provided high chromatographic resolution, ample sensitivity, and superior mass accuracy to identify many of the impurities in the quetiapine hemifumarate drug substance. MSE provided simultaneous acquisition of both high and low collision energy, maximizing the information gathered from a single injection. This analytical workflow was followed by a deliberate data processing workflow that streamlined the fragment analysis and structural elucidation process and provided greater confidence in the end results.
The MetaboLynx browser provided:
Using MetaboLynx’s Fragment Analysis:
Using MassFragment:
In some cases where the peak identification was more challenging, MetaboLynx was able to help formulate decisions about compound determination. The combination of these three software tools, along with the optimized instrument configurations for impurity analysis and efficient MSE acquisition, provided a systematic workflow approach that can readily be applied to identify and confirm known and unknown peaks in an impurity profile.
This workflow-based approach delivers the rapid and systematic set of comprehensive results that are needed to identify and confirm impurities in an API impurity profile.
720003081, June 2015