Identify Optimal Biologic Candidates: Low Volume, Early Stage Developability Assessment with Aura PTx System
Waters Corporation, United States
Published on June 16, 2026
Abstract
Developability assessment requires directly characterizing subvisible particle formation using limited sample volumes. In this study, the Aura™ PTx System was used to evaluate three proteins across industrially relevant buffer and excipient conditions using only 40 µL per condition. Subvisible content was quantified across acetate, citrate, tris, and glycine buffer systems, while fluorescence membrane microscopy (FMM) provided single-particle level insight into protein aggregate formation. These results demonstrate how Aura Technology supports high-throughput, low-volume developability assessment for biologic candidate selection and formulation optimization.
Benefits
- Direct characterization of subvisible particle formation using limited sample volumes.
- Low %CVs across replicate measurements demonstrate measurement robustness.
- Granular information helps researchers better understand the mechanisms and degradation pathways that influence biologic instability.
Introduction
Developability assessment is used during biotherapeutic development to evaluate the manufacturability of leading drug candidates.1,2 Performing this assessment as early as possible identifies candidates with inherent stability risks, mitigating potential failures or expensive, time-consuming formulation efforts required for a suboptimal candidate. Finding the most stable candidates and buffer conditions to reduce subvisible biological aggregation, a critical quality attribute (CQA) linked to immunogenicity, drug efficacy, and product shelf life, is a key goal when assessing a candidate’s developability.3 However, the ability to perform this assessment is severely hampered since sample availability is extremely limited during early stages of the development process. Conducting subvisible particle analysis with traditional legacy techniques such as flow imaging and light obscuration has not been possible due to the high sample volume demands (>500 µL per run). As a result, researchers have turned to other low volume techniques for developability assessment, including size exclusion chromatography (SEC), dynamic light scattering, and differential scanning fluorimetry, that do not predict subvisible particle formation.
This application note describes how Aura Systems transform developability assessment by directly characterizing subvisible content using a high throughput, low volume screen of three different proteins against a platform of 14 industry-relevant buffers and excipients. The most stable protein was identified by quantifying the subvisible content across the different conditions using volumes as low as 5 µL in under three hours of total experimental time. In addition, high contrast images and FMM analysis revealed key insights on the samples’ stability profile.
Experimental
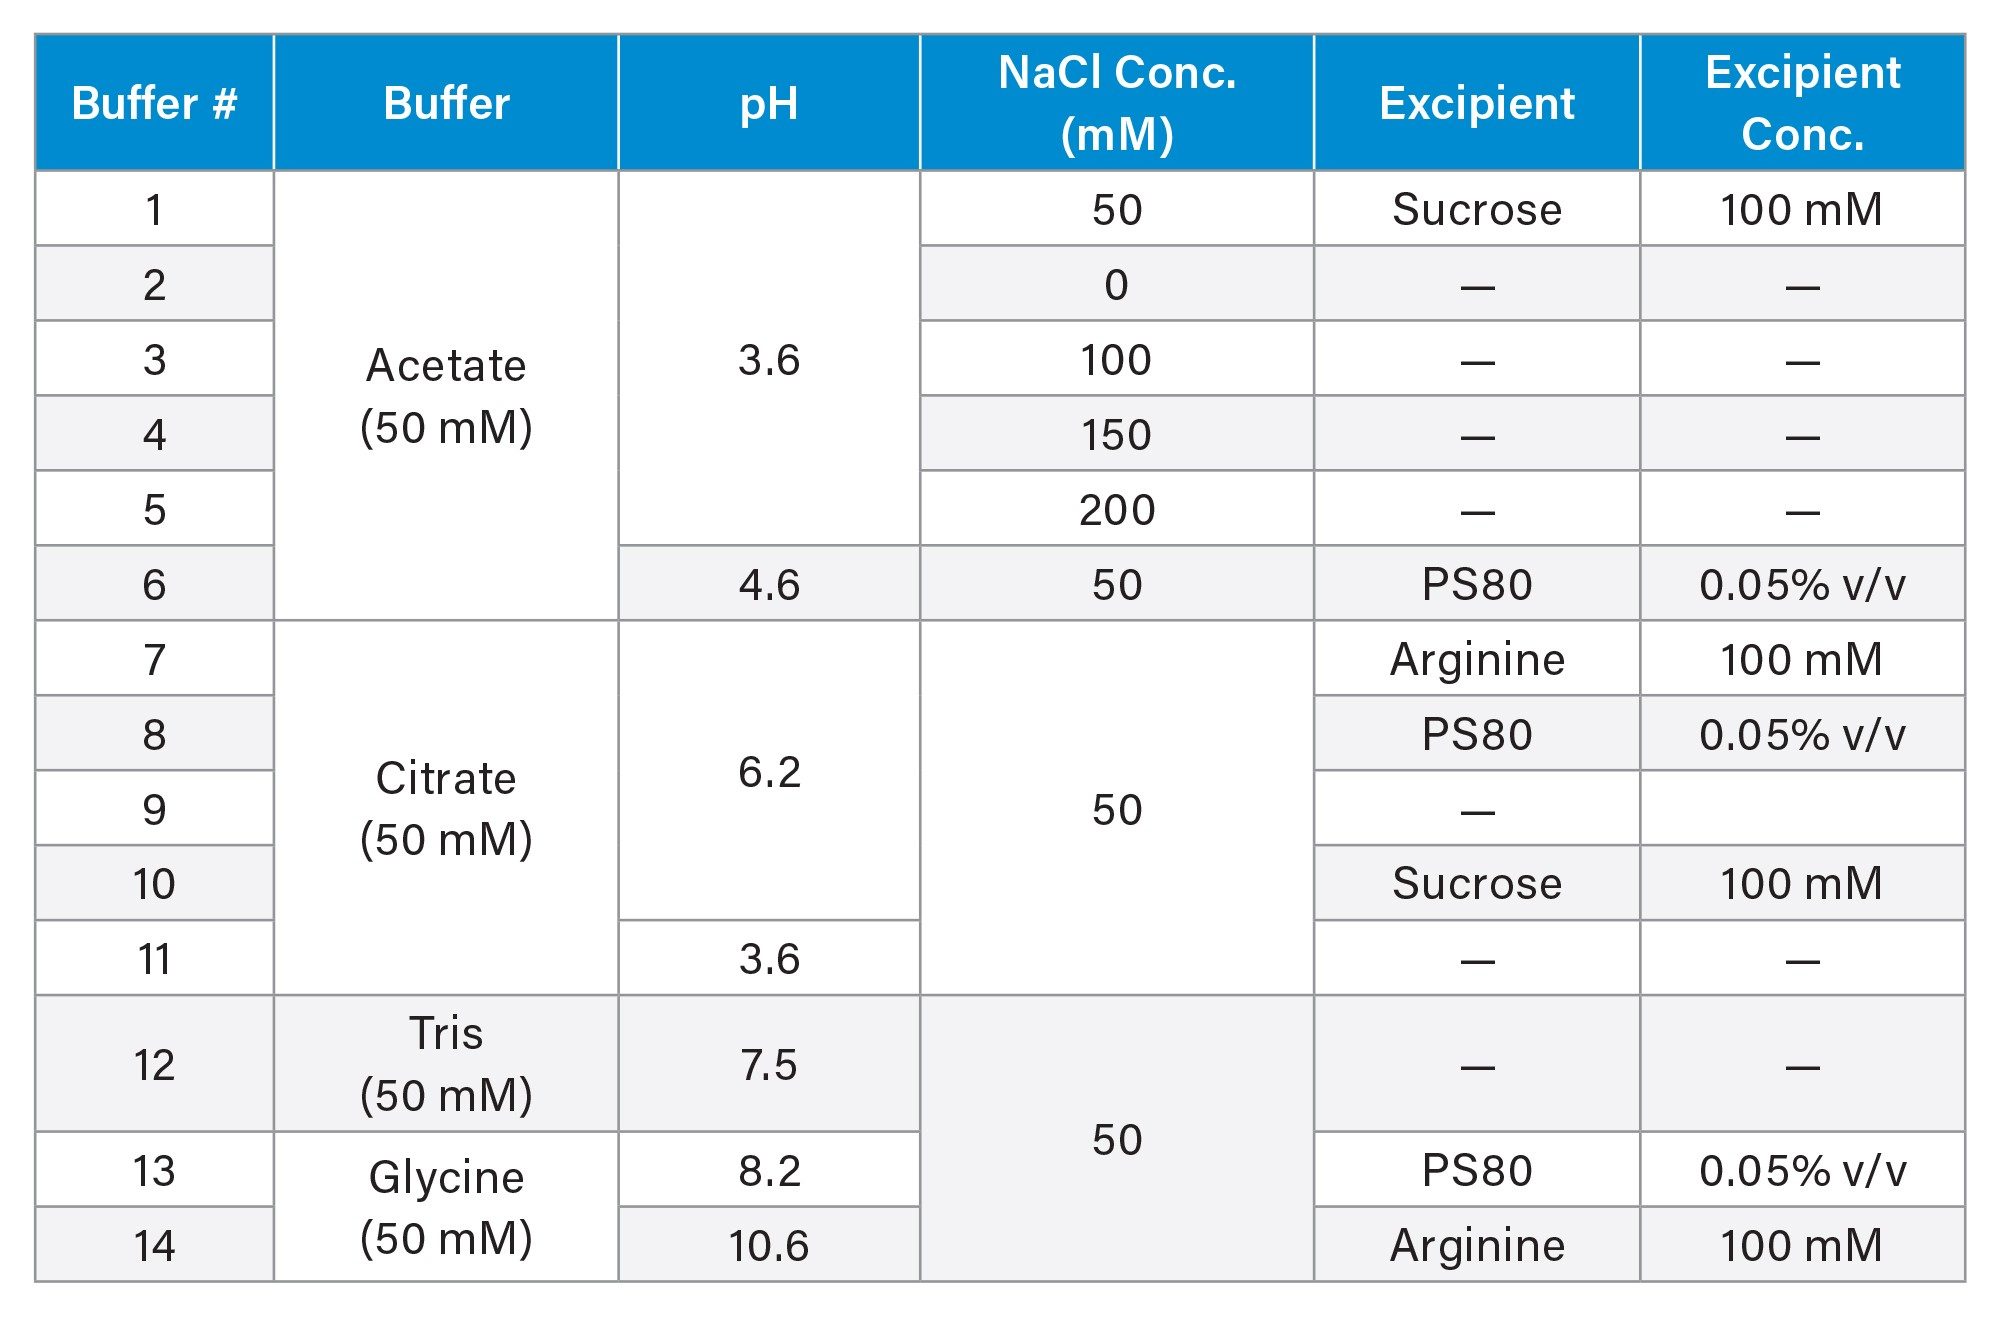
Three proteins and a platform of buffers (Table 1) that are commonly used as part of the commercial manufacturing process were assessed. The buffers were optimized to include excipients that reduce the stresses that occur during low pH viral clearance, elution, storage (air water interfaces), freeze/thaw, and ultrafiltration (UF)/diafiltration (DF)/ tangential flow filtrations (TFF) for buffer exchange of drug substance to drug product. This buffer platform screens the impact of ionic strength, buffer type, salt (NaCl), pH, and stabilizing additives. Each protein (A, B, and C) was formulated in each buffer from lyophilized powder to a final concentration of 0.1 mg/mL. Each sample condition was processed in quadruplicate using 40 µL per well on Aura PTx System.
Results and Discussion
Protein Developability Assessment in Acetate Buffer
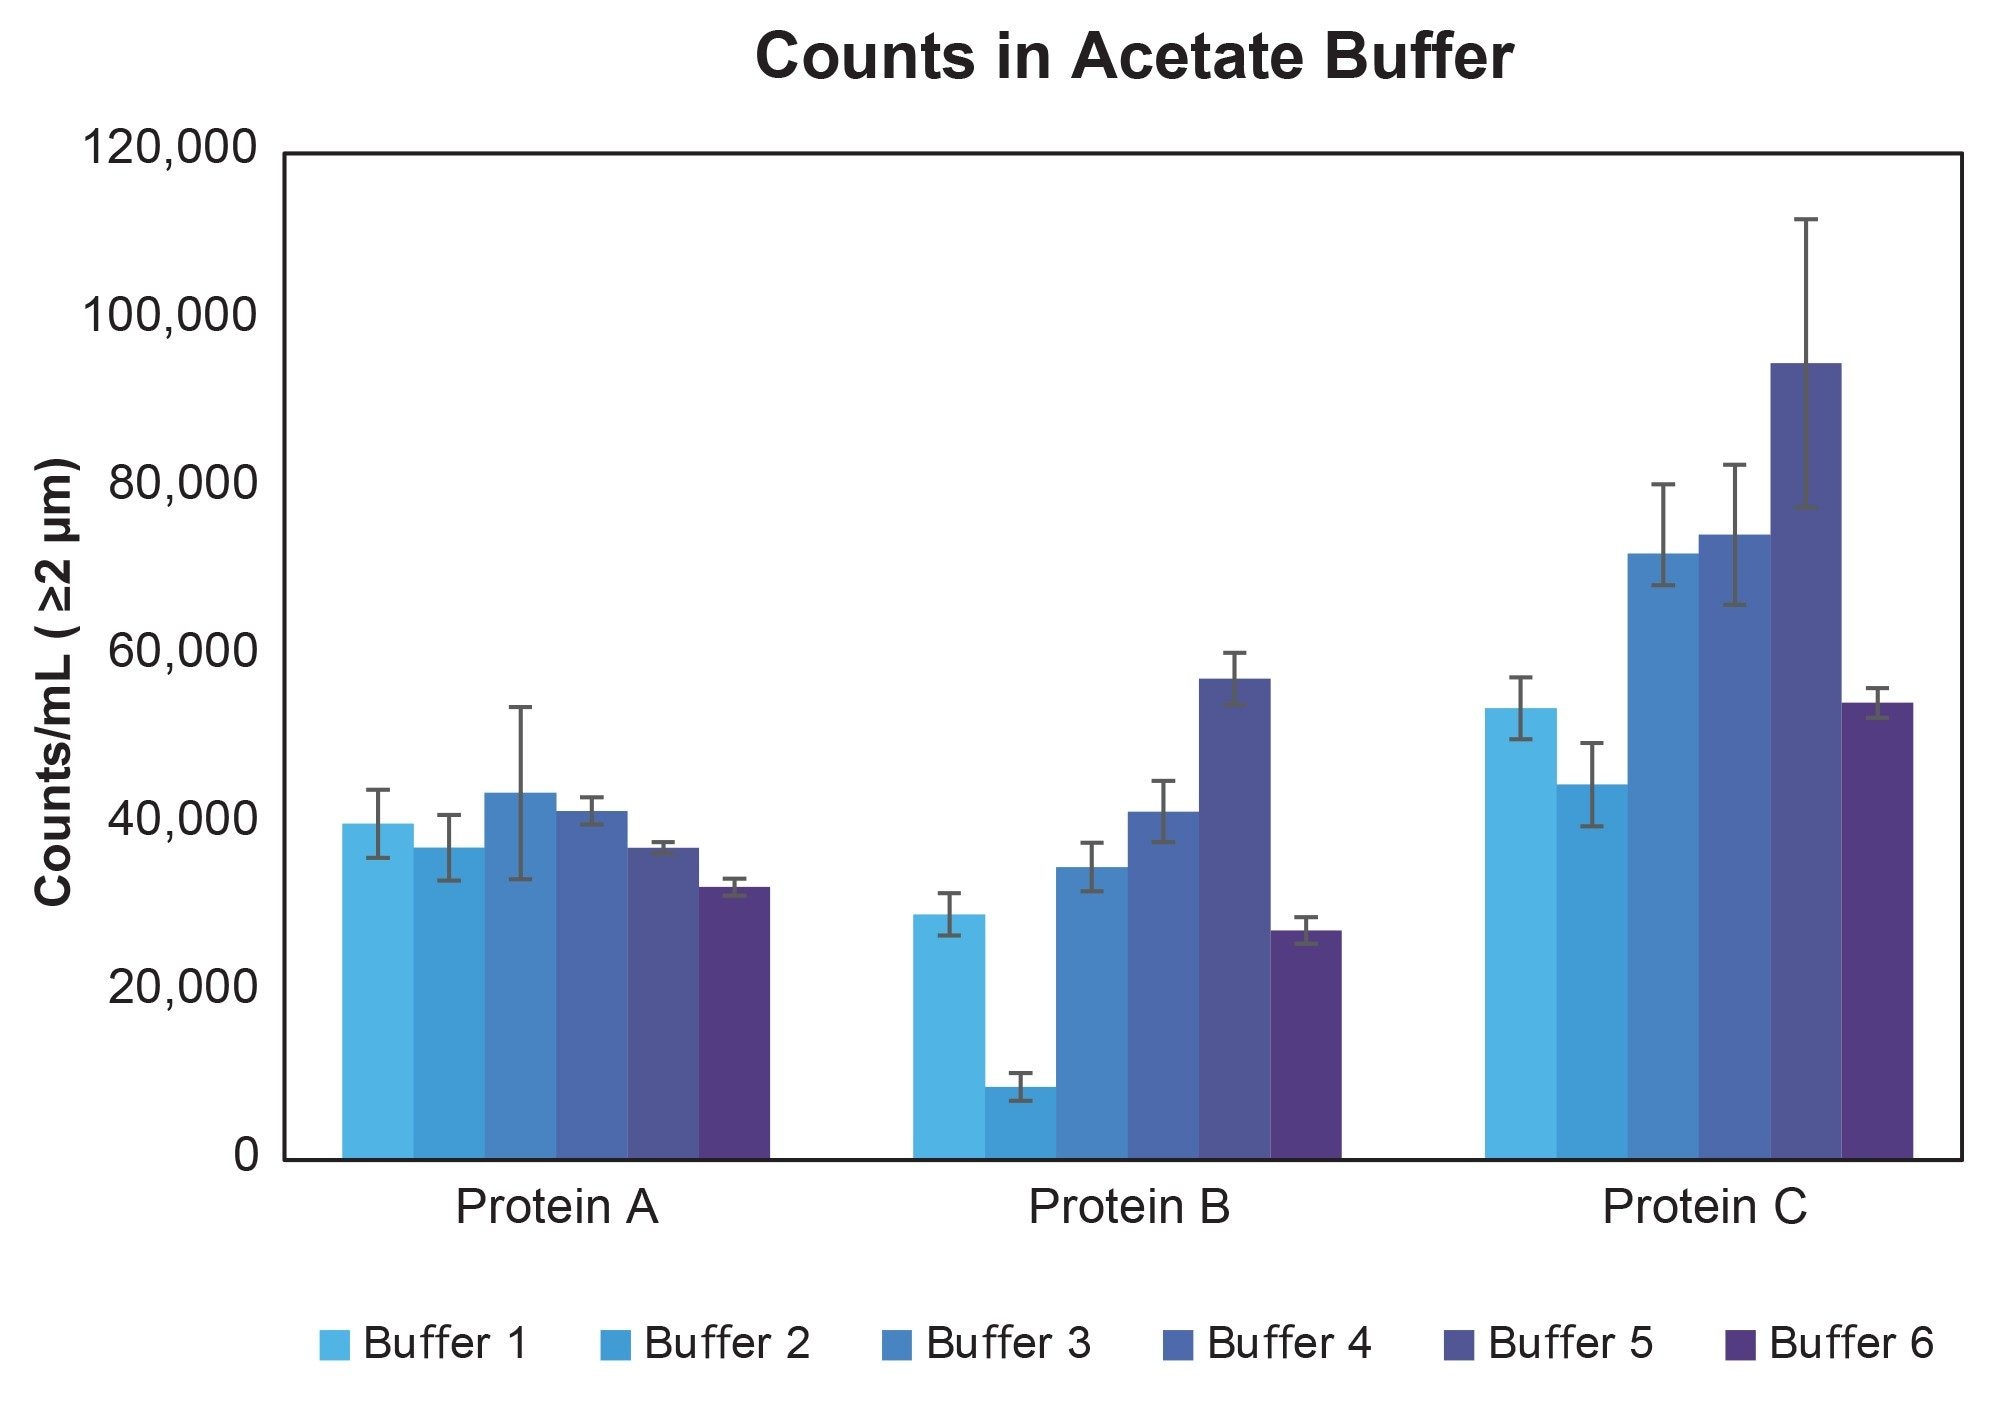
Proteins A, B, and C generated subvisible particles in acetate buffer as shown in Figure 1. Protein C displayed the most particle formation for these buffers compared to Proteins B and C, with all conditions exceeding 45,000 counts/mL, ≥2 µm in equivalent circular diameter (ECD). Protein A displayed counts very close to 35,000 counts/mL, ≥2 µm across all acetate buffer conditions while Protein B showed similar behavior in counts to Protein A, except when no NaCl was present. Protein B exhibited the most stable condition when formulated using buffer #2. %CVs across all measurements were generally below 10% for most acetate containing samples, demonstrating measurement robustness despite low sample volumes.
Protein Developability Assessment in Citrate Buffer
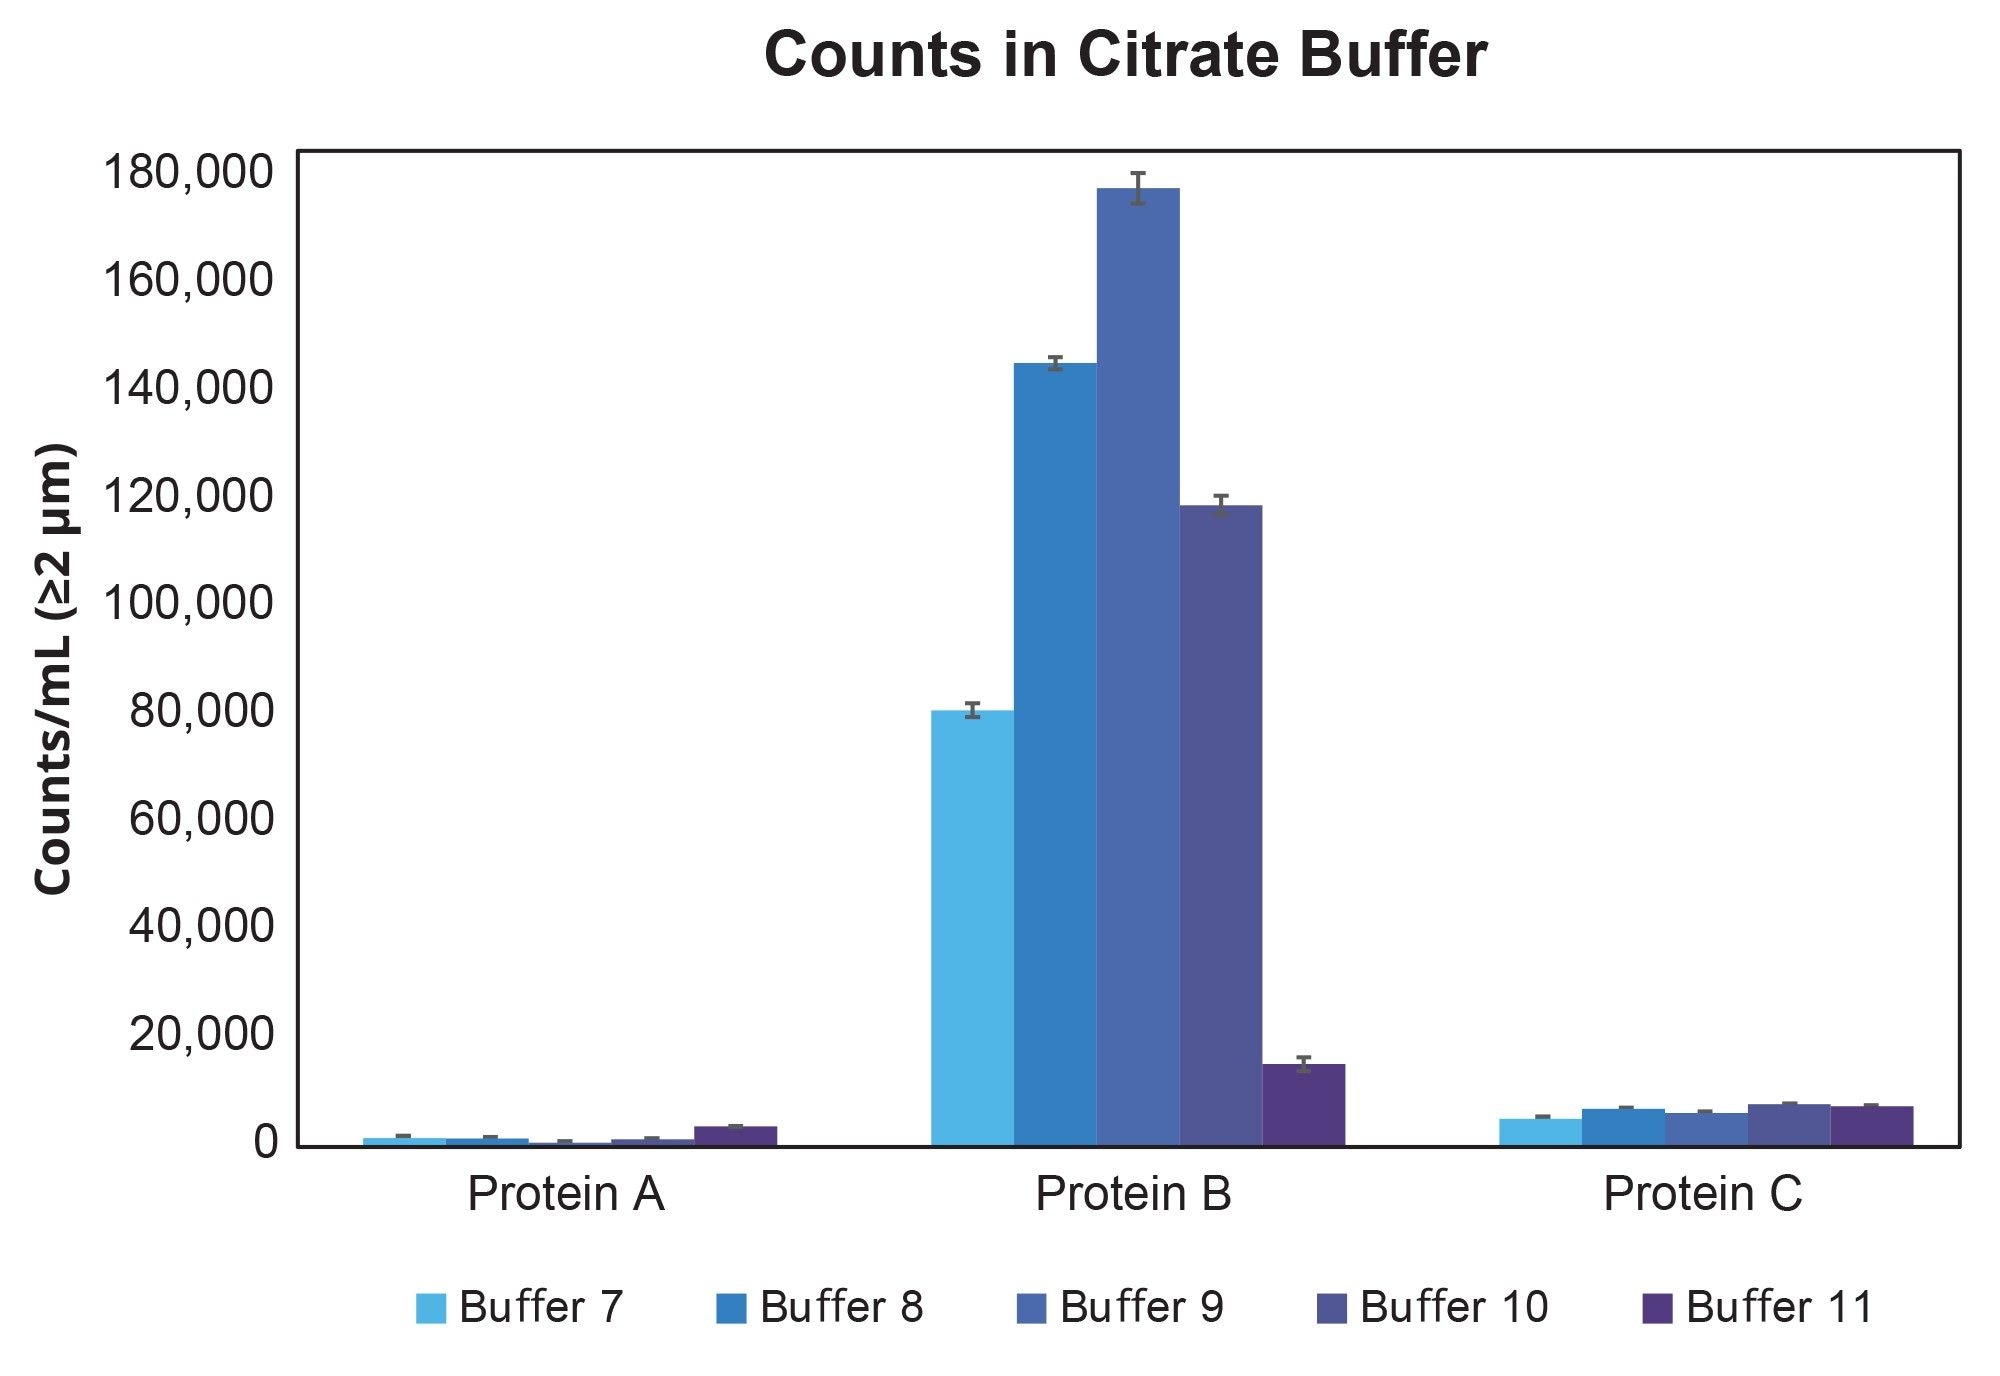
Proteins A, B, and C also generated subvisible particles in citrate buffer. However, Protein B, which was nominally the most stable along with Protein A in acetate buffer, was far more unstable than both Proteins A and C as shown in Figure 2. Protein B exhibited 4– to 425–fold more subvisible aggregate formation than Protein A across the citrate buffer conditions, and 2– to 30–fold more subvisible aggregate formation than Protein C. Protein C in turn produced 2 to 14 times as many protein aggregates than Protein A in this buffer, with Protein A clearly emerging as the most stable in citrate buffer. %CVs across all measurements were generally below 10% for most acetate containing samples, showing measurement robustness despite low sample volumes.
Protein Developability Assessment in Tris and Glycine Buffers
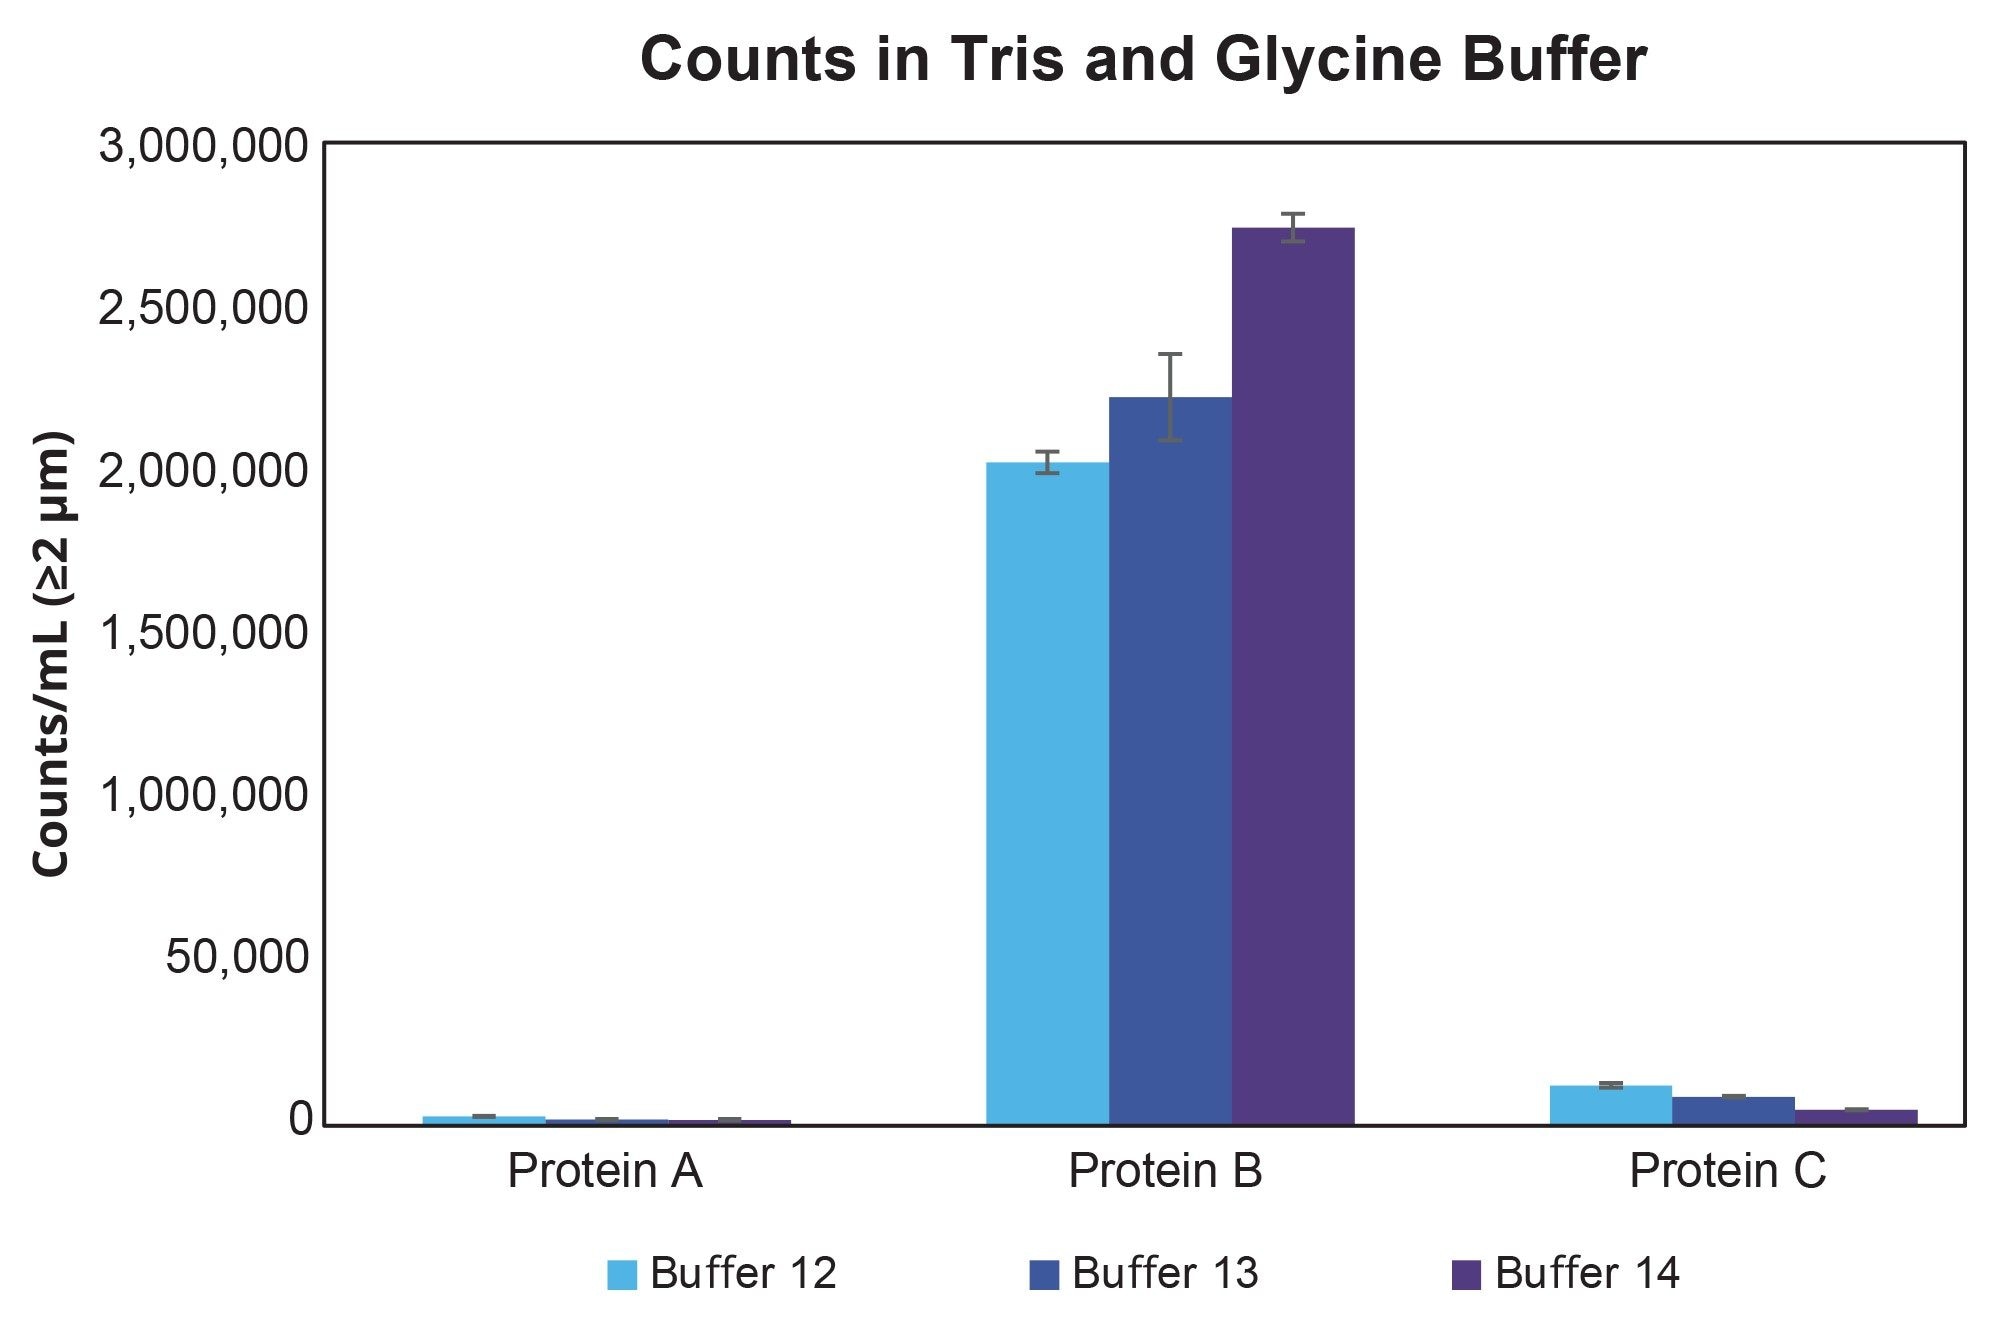
Proteins A, B, and C also generated subvisible particles in tris and glycine buffers. Like in citrate buffer, Protein B was also the least stable, exhibiting over 2 million counts/mL, ≥2 µm across all conditions as shown in Figure 3. For this buffer, Protein B exhibited a 76– to 166–fold increase in aggregate formation over Protein A, and 16– to 58–fold more aggregate formation than Protein C. Protein C was also more unstable than Protein A, displaying 3– to 5–fold more subvisible aggregates across these buffer conditions. Protein A also emerges as the most stable protein for this buffer condition. %CVs across all measurements were generally below 10% for most acetate containing samples, showing measurement robustness despite low sample volumes.
Developability Assessment Summary
Table 2 shows the subvisible count summary for the entire sweep and is presented in conditional formatting to easily rank the samples by stability. Protein B is clearly the least stable, showing the most counts particularly in citrate, tris, and glycine buffer conditions. Protein C was in the middle of the pack with comparable stability in acetate buffer, but Protein A exhibited significantly higher stability in citrate, tris, and glycine buffer conditions than Protein B.
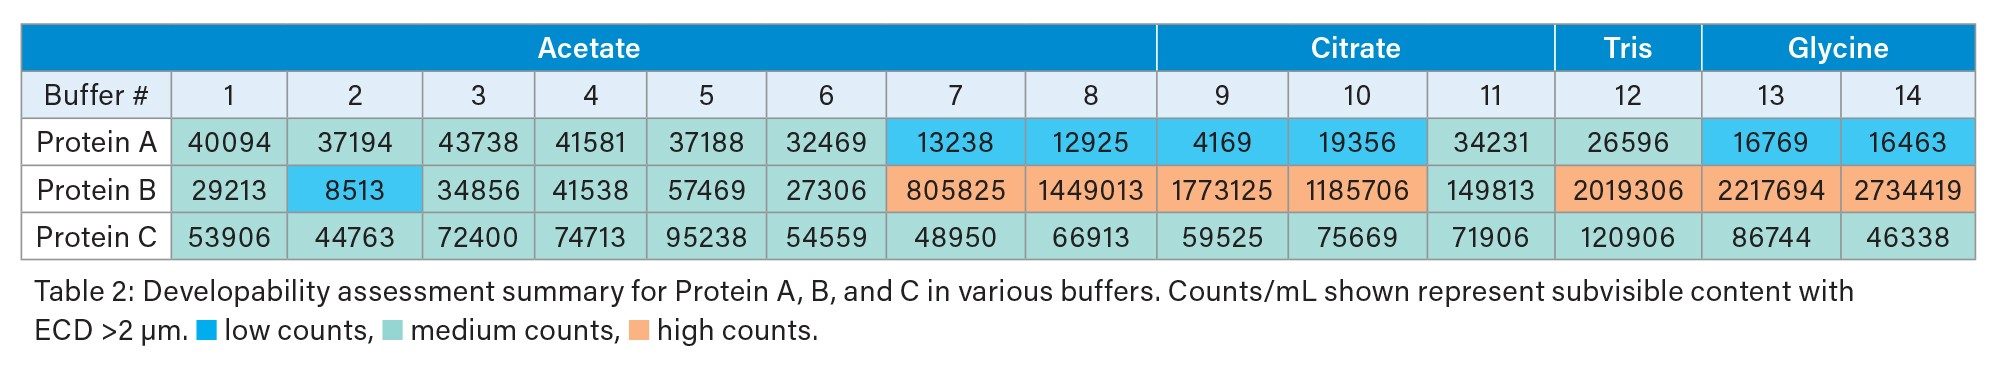
If protein developability had only been evaluated under acetate buffer conditions, Protein B may have been identified as the most stable candidate. However, it produced up to 420-fold higher formation of subvisible particles in the more aqueous and alkaline buffer conditions. Aura PTx System easily ranked three different proteins under a comprehensive buffer platform and elucidated the most stable candidate – Protein A. The entire sweep involved running 168 wells, used only 40 µL of sample per condition, and took less than three hours to produce comprehensive measurements in quadruplicate. The data generated was extremely robust, yielding results with low %CVs.
Analysis at the Single-Particle Level
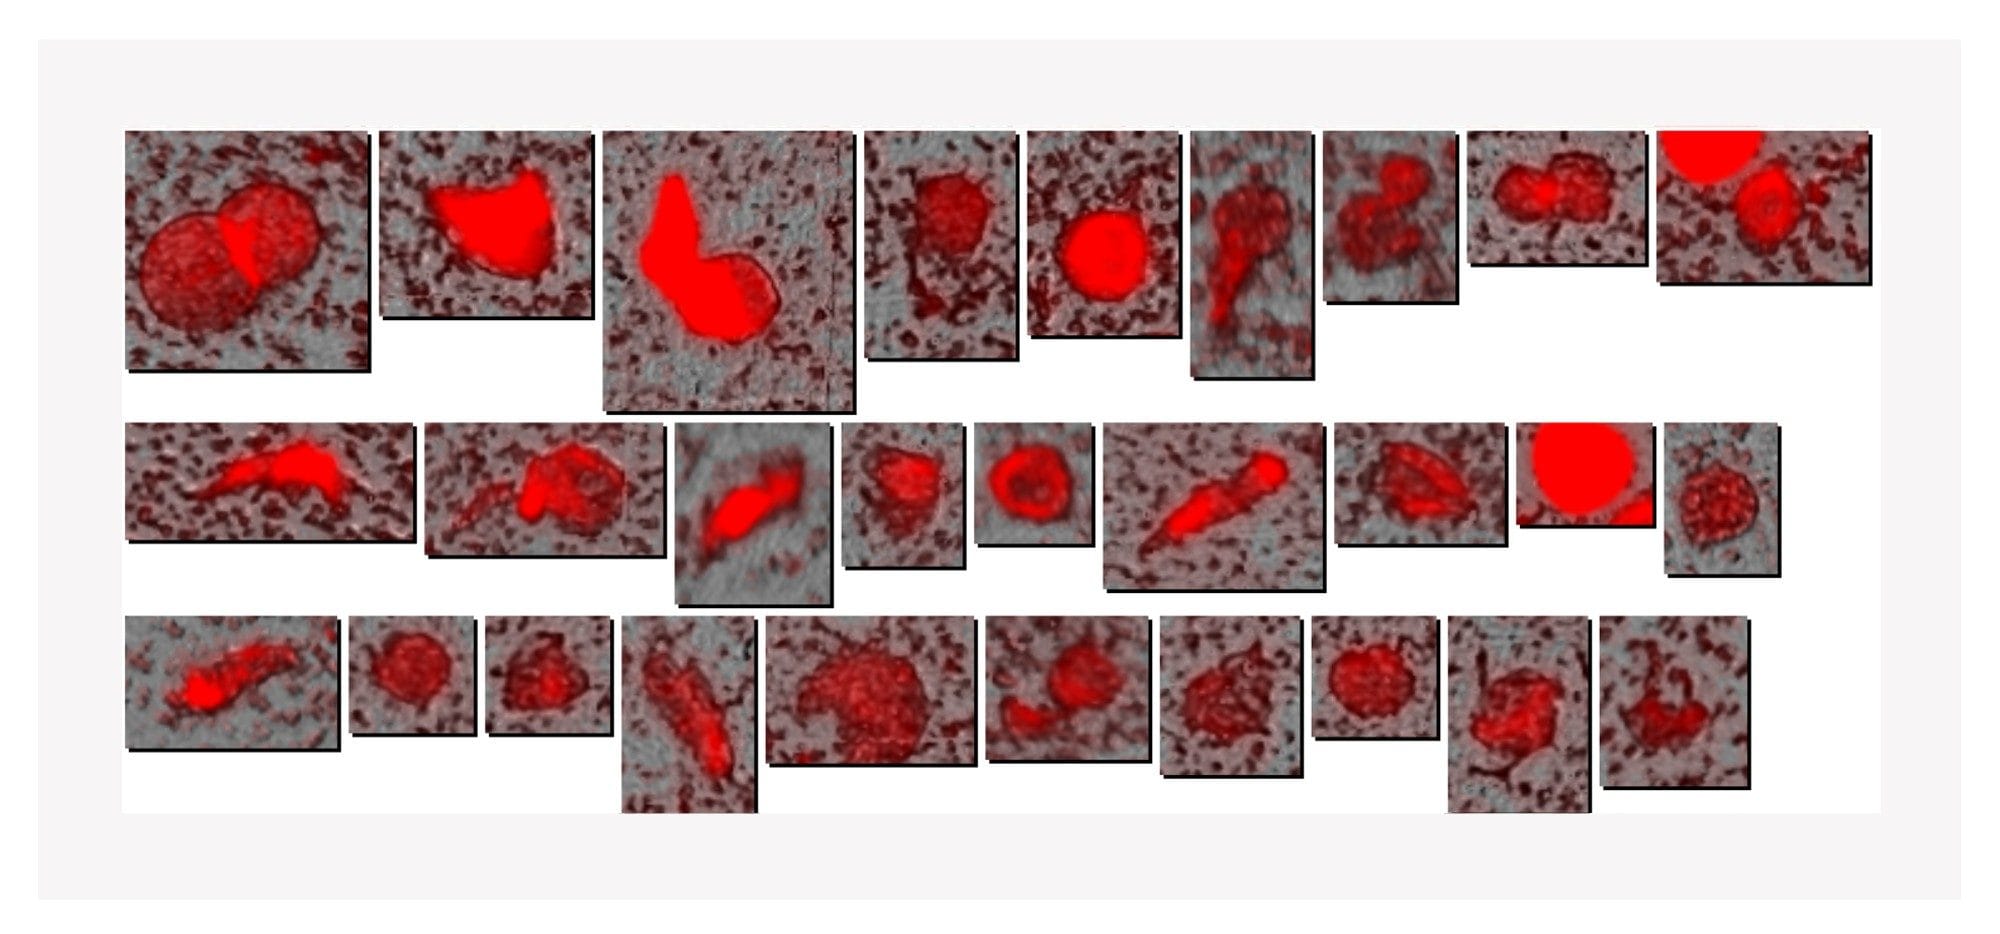
In addition to providing high-level insights during candidate selection, Aura Systems enable a deeper understanding of protein aggregation since data can be analyzed at the single-particle level. To demonstrate this, single aggregates formed by Protein B in glycine buffer #14 using the image gallery shown in Figure 4 were analyzed. The observed images are subvisible particles stained with the fluorescent dye, thioflavin T (ThT), a well-characterized dye specific for protein aggregates. The red color indicates a strong fluorescence acquired with Aura Platform’s proprietary FMM technology. Since the particles are round and ThT binds to small fibrils in proteins, it can be deduced that these are highly hydrophobic subvisible aggregates based on the strong ThT fluorescence and particle morphology that minimizes surface area to volume ratio. While high-level information is very important, the granular information possible when single particles are analyzed using FMM technology can help researchers better understand the mechanisms and degradation pathways that influence the biologic’s instability.
Conclusion
Proteins A, B and C, despite having a strong affinity for their target, have drastically different manufacturability potential. While affinity and pharmacokinetic characteristics are important, considerations being able to manufacture large molecules with good stability profiles are equally important. Determining this before scaling up production saves considerable time and reduces risk, and subvisible particles are a critical measurement at this stage.
For the first time, Aura PTx System and Aura+ System transforms the sample volume limited developability assessment stage by enabling subvisible particle characterization - the most important stability CQA. Its high throughput, low volume modality enables high level ranking decision-making and uncovers the most granular insights of stability and particle formation in a single platform.
References
- Lobo, S.A.; et al. Stability Liabilities of Biotherapeutic Proteins: Early Assessment As Mitigation Strategy. J Pharm Biomed Anal. 192:113650. 2021.
- Garripelli, V.K.; Wu, Z.; Gupta, S. Developability Assessment for Monoclonal Antibody Drug Candidates: A Case Study. Pharm Dev Technol. 26(1):11–20. 2021.
- Carpenter, J.F.; et al. Overlooking Subvisible Particles in Therapeutic Protein Products: Gaps That May Compromise Product Quality. J Pharm Sci. 98(4):1201–1205.
Featured Products
720009416, June 2026