• Application Note

Transferring RapiFluor-MS Labeled N-Glycan HILIC Separations Between UPLC and HPLC

Transferring RapiFluor-MS Labeled N-Glycan HILIC Separations Between UPLC and HPLC

  • Stephan M. Koza
  • Matthew A. Lauber
  • Kenneth J. Fountain
  • Waters Corporation

Abstract

In the following work, we demonstrate that Glycan BEH Amide Columns packed with 1.7 μm and 2.5 μm particle sizes afford scalability between RapiFluor-MS labeled glycan separations performed under UPLC and HPLC-compatible conditions.

Benefits

  • Seamless scalability and transfer of RapiFluor-MS labeled glycan separations between UPLC and HPLC instrumentation
  • ACQUITY UPLC Glycan BEH Amide, 130., 1.7 μm and XBridge Glycan BEH Amide XP, 130., 2.5 μm Columns provide high resolution UPLC and HPLC glycan separations

Introduction

In 2009, Waters introduced a revolutionary UPLC HILIC Column designed specifically for achieving high resolution glycan separations. This column technology was based on stationary phase constructed from 1.7 µm diameter, 130Å pore size, ethylene bridged hybrid (BEH) particles with an optimized amide ligand bonding that has exhibited exceptional resolution for a broad range of N-glycans ranging from small neutral structures to highly sialylated extended structures.1 In addition to this UPLC-based column, Waters has also introduced HPLC-based XBridge Glycan BEH Amide Columns based on 2.5 µm particles and has demonstrated that these columns provide selectivity for 2-AB labeled N-glycans comparable to that observed in UPLC separations.2 Most recently, Waters has introduced a novel labeling reagent, RapiFluor-MS, that provides both a fast and efficient sample preparation workflow and unsurpassed fluorescent and MS sensitivity.3

In the following work, we demonstrate that Glycan BEH Amide Columns packed with 1.7 μm and 2.5 μm particle sizes afford scalability between RapiFluor-MS labeled glycan separations performed under UPLC and HPLC-compatible conditions. Using standard LC method transfer principles to account for differences in particle diameter (dp), column length, and column internal diameter, we show that comparable chromatographic profiles and relative quantitation can be achieved with the larger particle size column at HPLC-compatible pressures, albeit with an increase in sample load, mobile phase use, and most importantly, analysis time.

Experimental

LC conditions

LC system:

Alliance HPLC or ACQUITY UPLC H-Class Bio System

Detection:

Alliance HPLC 2475 Fluorescence (FLR) Detector ACQUITY UPLC FLR Detector with analytical flow cell

Wavelength: 265 nm excitation, 425 nm emission

Columns:

ACQUITY UPLC Glycan BEH Amide Column, 130Å, 1.7 μm, 2.1 mm x 150 mm, (p/n 186004742), XBridge Glycan BEH Amide XP Column, 130Å, 2.5 μm, 3.0 x 150 mm (p/n 186008040) and XBridge Glycan BEH Amide XP Column, 130Å, 2.5 μm, 3 mm x 75 mm (p/n 186008039) in series. Columns connected by 0.005 x 1.75 UPLC SEC Connection Tubing (p/n 186006613)

Column temp.:

60 °C

Sample temp.:

10 °C

Injection volume:

1.2 μL UPLC, 3.7 μL HPLC

Mobile phase A:

50 mM Waters Ammonium Formate Solution – Glycan Analysis (p/n 186007081), pH 4.4 (LC-MS-grade water, from a 100X concentrate)

Mobile phase B:

LC-MS-grade acetonitrile

Sample vials:

Polypropylene 12 x 32 mm Screw Neck Vial, with Cap and PTFE/silicone Septum, 300 μL Volume (p/n 186002640)

Data management:

MassLynx 4.1 Software

Empower Pro 3.0 Software

Gradients

Table 1.

Sample description

The RapiFluor-MS Glycan Performance Test Standard (p/n 186007983) was diluted in water to a concentration of 20 pmole/μL.

Results and Discussion

Calculating the transfer of glycan HILIC methods between UPLC and HPLC columns

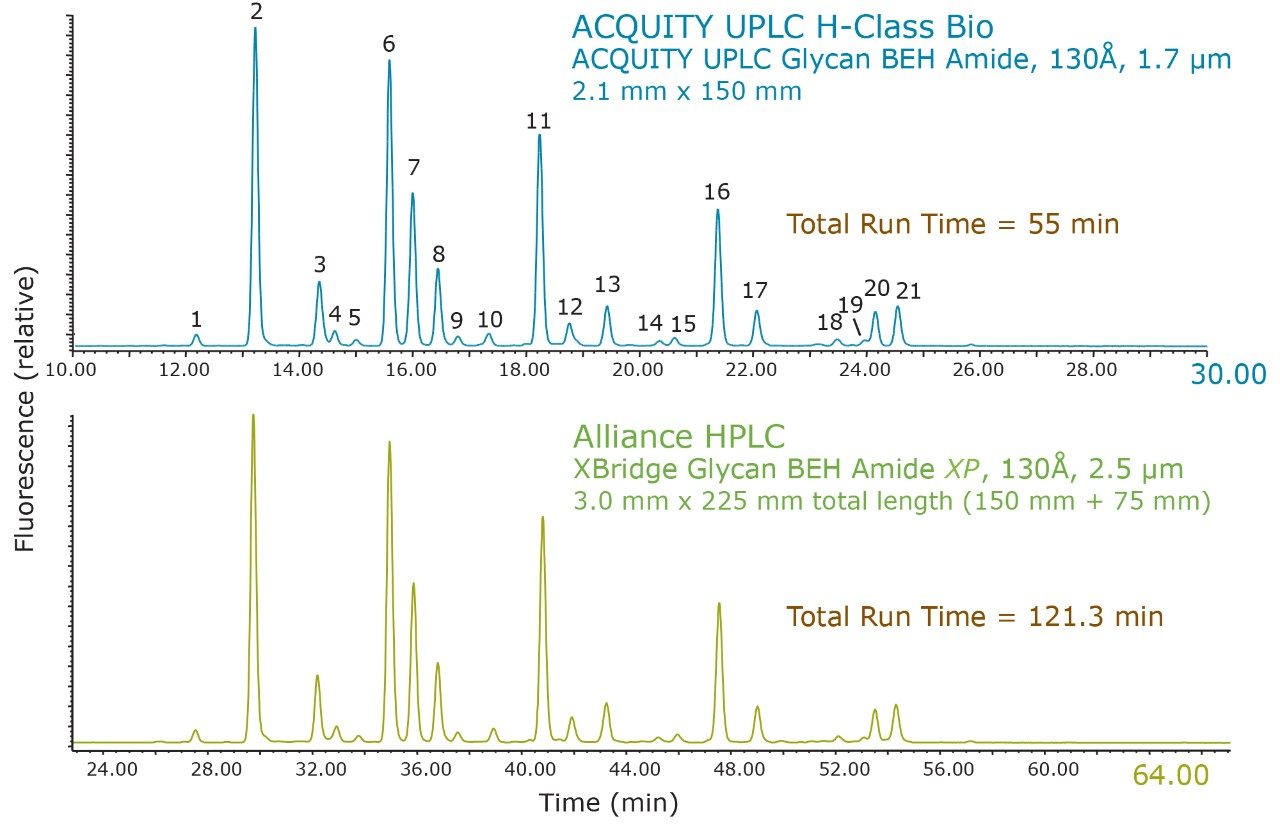
There are two primary considerations to be made when transferring a HILIC-based N-glycan separation method from one LC system and column to another. Most importantly, the surface chemistry and pore size of the particles in the two columns must be comparable. Once appropriate columns have been chosen, the separation must then be appropriately scaled with respect to particle size. Generally this can be accomplished by maintaining a comparable ratio between the length of the column and the size of the particle, L/dp. Once determined, alterations to the gradient can be calculated. In this example, the transfer between a 1.7 µm particle size, 2.1 mm x 150 mm ACQUITY UPLC Glycan BEH Amide Column to an XBridge Glycan BEH Amide Column with a 2.5 µm particle size required a column approximately 50% greater in length (225 mm) since the ratio of the particle sizes is 1.47 (i.e. 2.5/1.7). In practice, a 225 mm length can be easily constructed by combining 150 mm and 75 mm length columns with a suitable column connector. In addition to column length, it is also important to consider the optimal column I.D. HPLC systems invariably exhibit higher dispersion than UPLC systems (bandspread ~30 μL versus ~10 μL), so it is advisable to perform separations with relatively larger I.D. columns to ensure that the effect of extra-column band broadening is minimized. With a 3.0 mm HPLC column I.D. format, near optimal resolution separations can be achieved on an HPLC system, without the high mobile phase consumption rates typical of 4.6 mm I.D. column formats. 

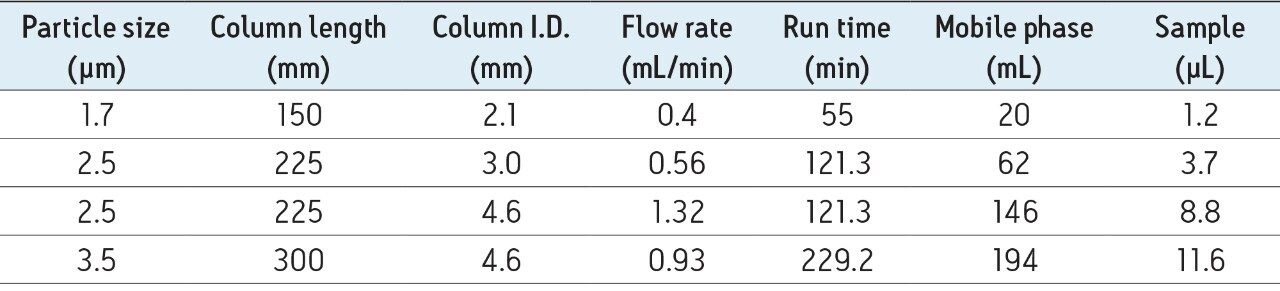
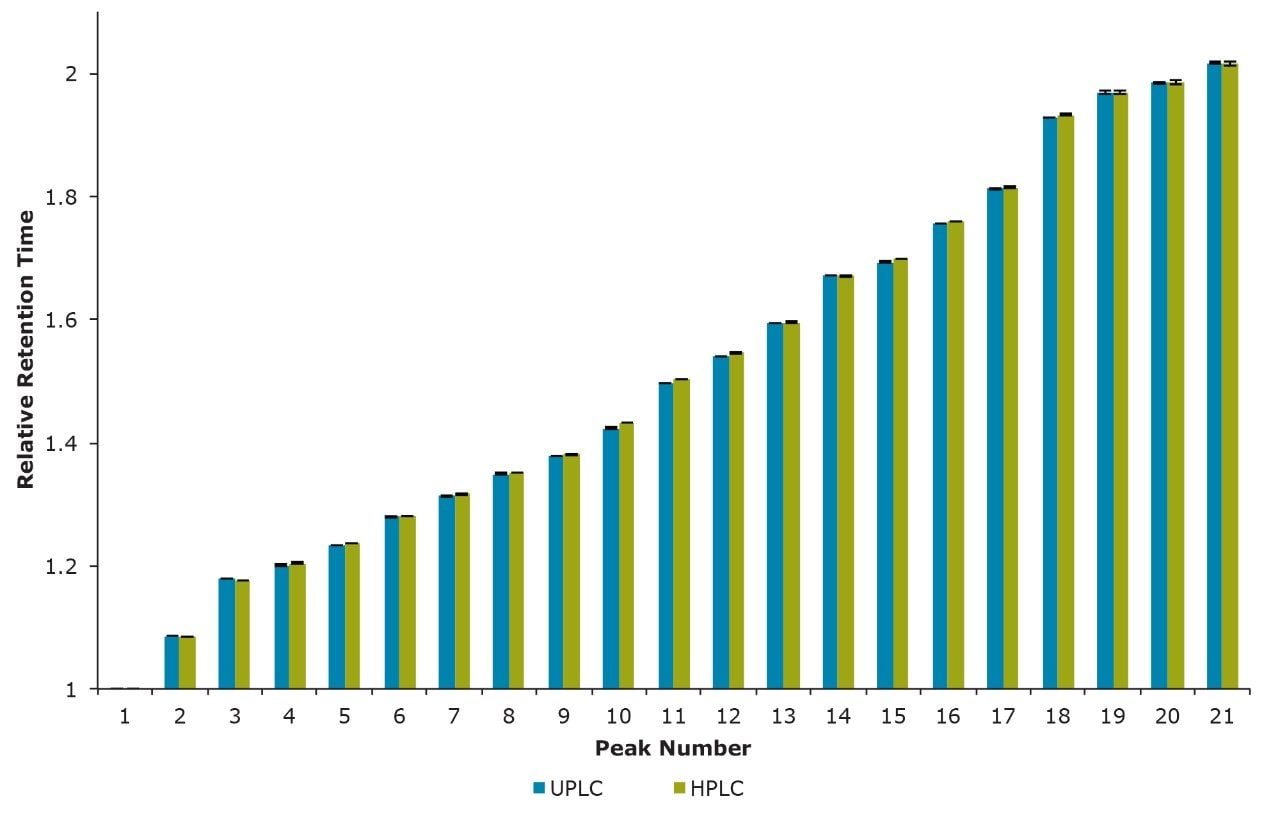
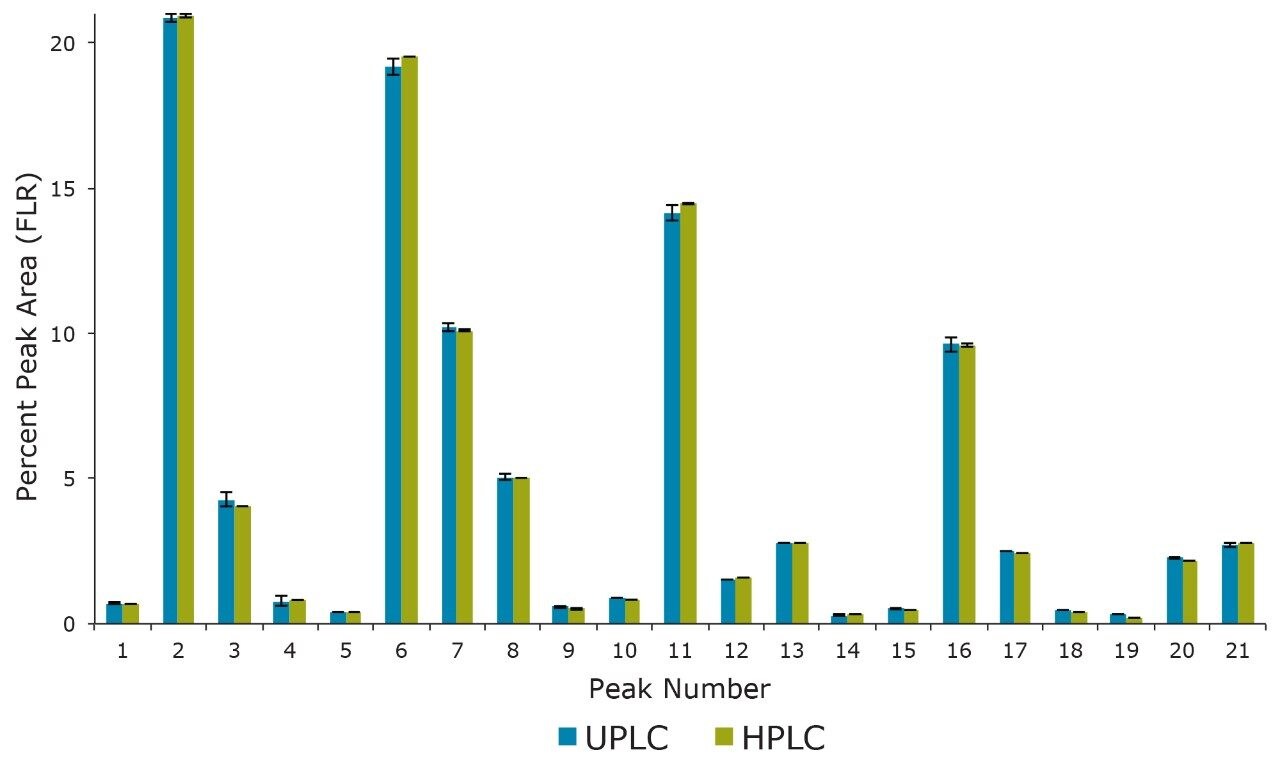
Having selected a 3.0 mm x 225 mm effective column dimension, we next calculated the appropriate  gradient for the HPLC separation using general method transfer principals (refer back to Table 1 for the gradient).4 Table 2 outlines column lengths, analysis times, and mobile phase as well as sample consumption corresponding to the use of various scaled methods and potential Glycan BEH Amide Column configurations. Clearly, this exercise highlights two of the significant advantages that UPLC separations provide: shorter analysis times (≥55% decrease) and decreased mobile phase usage (≥68% decrease). The UPLC separations also benefit from lower required sample loads (≥68% decrease), which can prove useful in cases where an analyst is sample limited. For these comparisons, mobile phase use was determined based on the gradient shown in Table 1. Based on these calculated results, the advantages of the UPLC format is evident as is the use of the XBridge Glycan BEH Amide XP Column, 2.5 µm, 3 mm I.D. Columns on an low band spread (29 µL) HPLC.

Table 2. Particle size, column lengths, flow rate, analysis times, and mobile phase as well as sample consumption corresponding to the use of various scaled methods and potential Glycan BEH Amide Column configurations.

Comparing UPLC and HPLC RapiFluor-MS labeled N-glycan profiles

The effectiveness of scaling from a 2.1 x 150 mm, 1.7 µm particle size, Glycan BEH Amide Column using an ACQUITY H-Class UPLC System to a total 225 mm length (150 mm + 75 mm) 2.5 µm particle size, 3.0 mm I.D., XBridge Column run on an Alliance HPLC System is demonstrated qualitatively in Figure 1. Both pairs of chromatograms show comparable profiles over normalized time ranges for the RapiFluor-MS Glycan Performance Test Standard (p/n 186007983), which represents the N-glycans released from a pooled human IgG sample. In this example, the analysis time difference is approximately 2.2-fold.

Figure 1. Comparison of UPLC and HPLC HILIC separations of RapiFluor-MS labeled N-glycans from the Glycan Performance Test Standard (p/n 186007983) diluted in water to a concentration of 20 pmole/µL. Injection volumes of 1.2 µL and 3.7 µL for the UPLC and HPLC analyses.

Note

  1. Since LC system dispersion affects component resolution, it is recommended that the 2.1 mm x 150 mm column containing ACQUITY UPLC Glycan BEH Amide, 130Å, 1.7 µm material be used ONLY on a low dispersion system (i.e., Waters ACQUITY UPLC H-Class Bio system).
  2. In order to obtain a similar separation on an LC system with a higher dispersion (e.g., Waters Alliance HPLC), use of a 3.0 mm x 225 mm total length (150 mm + 75 mm) column containing XBridge Glycan BEH Amide XP, 130Å, 2.5 µm particles is required.

These separations were also compared quantitatively. Shown in Figure 2 is a comparison of the relative retention times for 21 of the most abundant N-linked oligosaccharides observed. Relative retention times were calculated off of  Peak 1 (Figure 1) and corrected for the increased system and column dwell volumes of the HPLC separation (~1.2 minutes). Figure 3 illustrates the general comparability of the two separations with respect to the relative quantitation for the same 21 peaks evaluated for retention time. The majority of these values are well within 5% of each other with the most significant difference (~35%) being observed for Peak 19, which has a relative abundance of ~0.2% as determined by the HPLC analysis. If more precise quantitation of these low abundance species is required it would be advantageous to report these results relative to a reference material. Overall, these data demonstrate that the HILIC-based separation of RapiFluor-MS labeled glycans can be readily transferred between UPLC and HPLC formats. The comparability of the observed chromatographic profiles underscores the chemical comparability of the particle surfaces, as well as the comparability in pore characteristics. 

Figure 2. Comparison of UPLC and HPLC HILIC relative retention times (n=2) of RapiFluor-MS labeled N-glycans. Peak numbers are as labeled in Figure 1. Relative retention times were determined based on Peak 1.
Figure 3. Comparison of UPLC and HPLC HILIC relative peak areas (n=2) of RapiFluor-MS labeled N-glycans. Peak numbers are as labeled in Figure 1.

Conclusion

These results demonstrate that a HILIC separation of RapiFluor-MS labeled N-linked oligosaccharides can be seamlessly transferred between UPLC and HPLC platforms when using the appropriate Glycan BEH Amide Columns. The advantage in using the UPLC-based separation is the capability to dramatically improve sample throughput while decreasing mobile phase use. Sample load requirements are also lowered. However, in the event that a laboratory encounters instrumentation limitations, it is beneficial to be able to easily transfer between UPLC and HPLC separations. Additionally, scaling from a UPLC to an HPLC platform can be useful if glycans must be fractionated and purified for structural analysis or to generate materials for method validation spiking studies.

References

  1. Beth Gillece-Castro, Kim van Tran, Jonathan E. Turner, Thomas E. Wheat, Diane M. Diehl, N-Linked Glycans of Glycoproteins: A New Column for Improved Resolution. Waters Application Note 720003112en. 2009.
  2. Matthew A. Lauber, Stephan M. Koza, Jonathan E. Turner, Pamela C. Iraneta, and Kenneth J Fountain, Amide-Bonded BEH HILIC Columns for High Resolution, HPLC-Compatible Separations of N-Glycans. Waters Application Note 720004857en. 2013.
  3. Matthew A. Lauber, Darryl W. Brousmiche, Zhengmao Hua, Stephan M. Koza, Ellen Guthrie, Paula Magnelli, Christopher H. Taron, Kenneth J. Fountain, Rapid Preparation of Released N-Glycans for HILIC Analysis Using a Novel Fluorescence and MS-Active Labeling Reagent, Waters Application Note 720005275en. 2015.
  4. Neue, U. D.; McCabe, D.; Ramesh, V.; Pappa, H.; DeMuthc, J. In Transfer of HPLC procedures to suitable columns of reduced dimensions and particle sizes, Pharmacopeial Forum, 2009; pp 1622–1626.

720005344, April 2016

Back To Top Back To Top