The results obtained for dried blood spots and plasma sample using ACQUITY UPLC with 2D-LC Technology showed the benefit of large volume injection (high-organic percentage) and the elimination of the evaporation and reconstitution steps from the extraction protocol. The time-saving workflow also demonstrated excellent reproducibility and robustness. Moreover, the methodology showcased an increase in the MS signal with high-organic percentage matrix in comparison to aqueous extract.
In the field of bioanalysis, the analysis of a target analyte and its metabolites in biological fluids (urine, plasma, and blood) is predominantly the main activity during animal and human trials. As such, a wide range of extraction and analytical techniques are used for qualitative and quantitative analysis. For accurate quantification, the target analyte must be isolated from the matrix,1,2 from which a clean and concentrated extract can be analyzed by GC-MS or LC-MS for trace level detection (ng/mL).
During method development, it is quite common to include an enrichment step if the analytical protocol requires sub-level (ppb) detection. Therefore, large sample quantities are required during the extraction process. For human and large animal trials, adequate sample size (volume or mass) can be made available for trace level analysis. However, for pre-clinical trials, sample volume drawn from small rodents (rats, mice, guinea pigs, etc.) is significantly lower and can limit the sampling frequency. As a result, the concept of “micro-sampling” has gained an interest as a potential alternative. From a logistical standpoint, handling and shipping of liquid samples adds an additional level of difficulty. As such, the concept of “Dried Blood Spot” (DBS) allows the collection of micro– (<200 μL) sampling directly onto a sorbent support card. After an adequate air drying period, the dried sample can be stored and shipped under ambient temperatures. Once the DBS card has reach the laboratory, the challenge now resides in the isolation of the target analyte from the dried matrix.
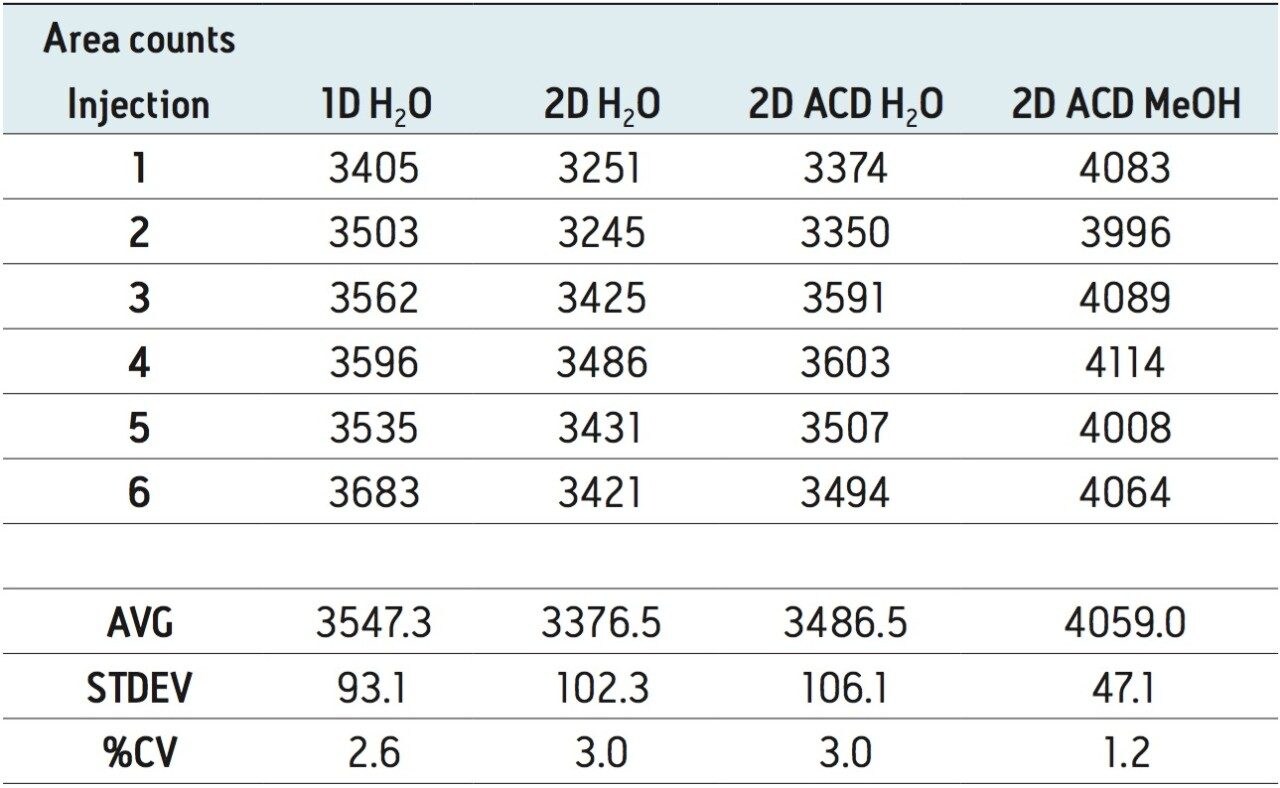
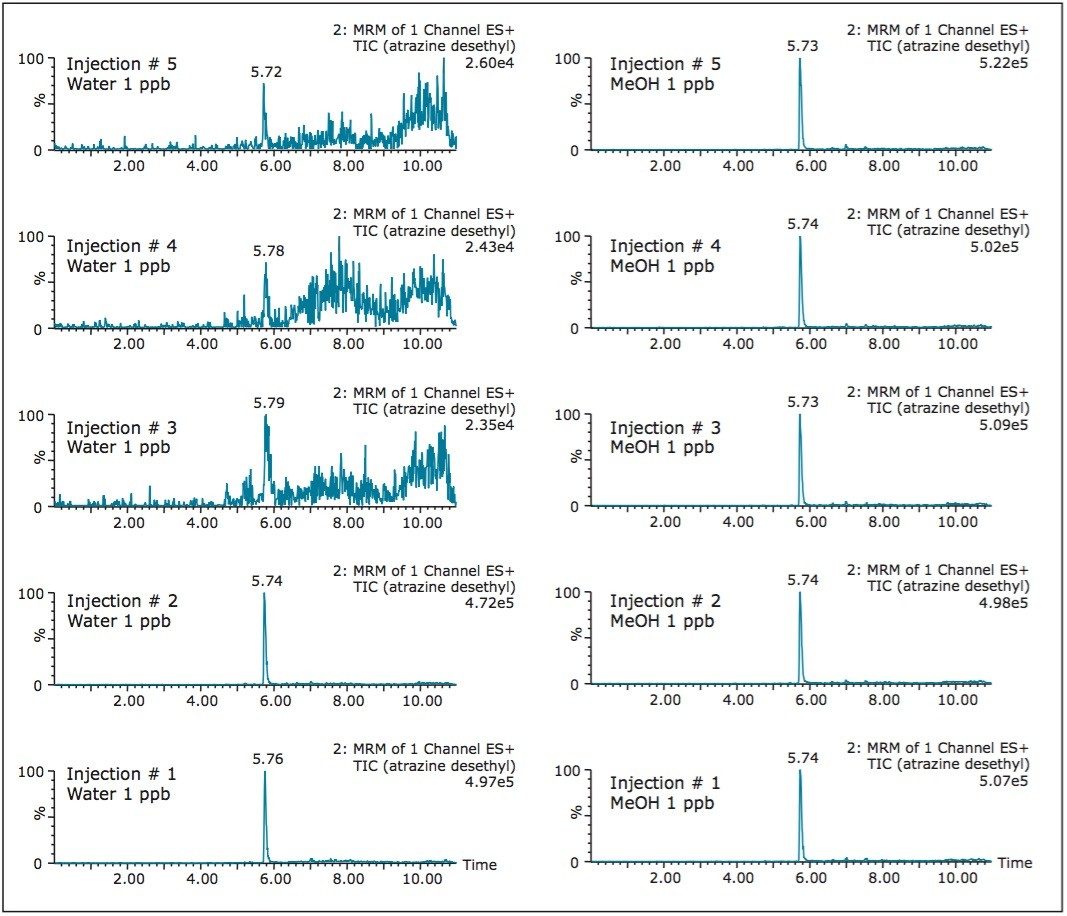
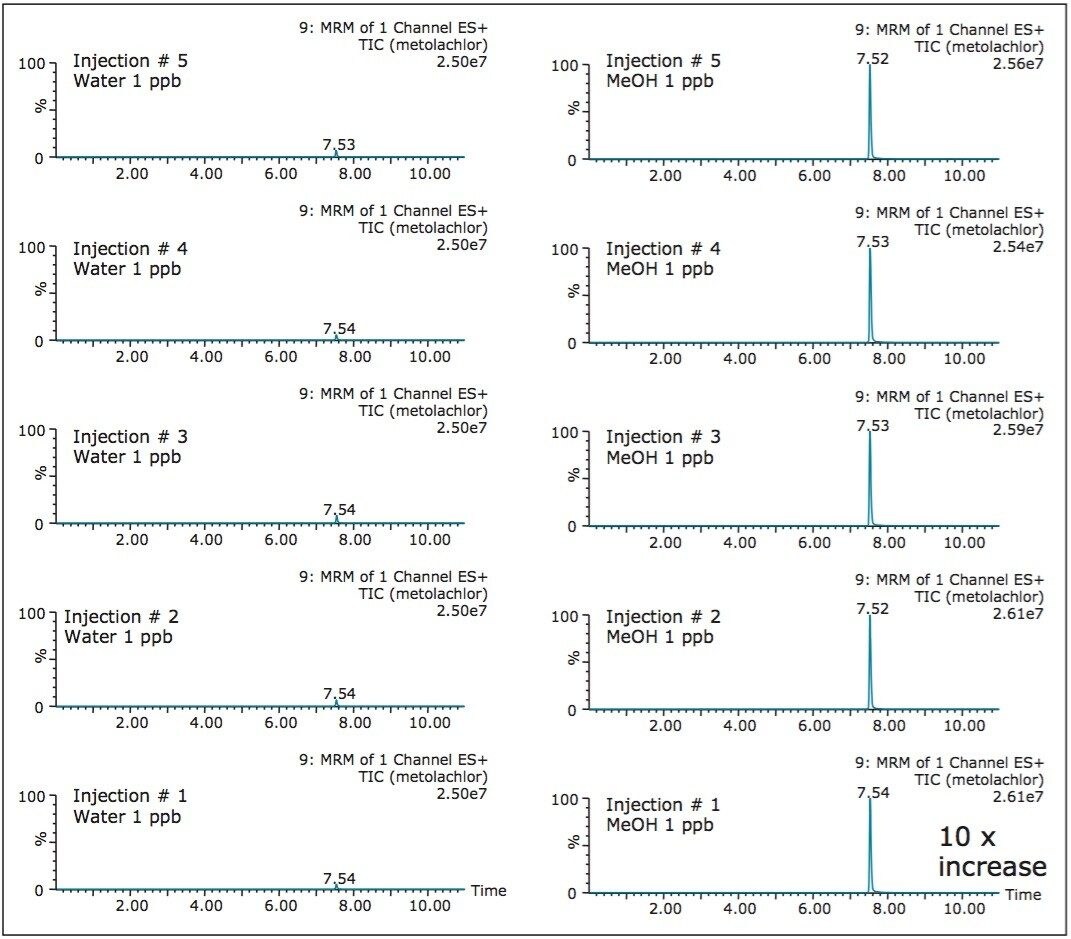
The extraction procedure of a DBS card requires the removal of bounded materials from the support structure, most often cellulose, using a punch cutting technique. The punch cutting technique utilizes a circular cutter to cut a fixed surface of the DBS card. The round disk is then subjected to a solid-liquid extraction with water or organic solvents (IPA, MeOH, ACN, etc.). With aqueous extraction, if the extract is of good quality, a small aliquot (10 μL) is used for analysis by LC-MS/MS. However, in most instances, the extraction efficiency gives better recoveries with organic solvents.
As a consequence, a solvent conversion step must be added to the extraction protocol. This is achieved by removing the organic solvent using an evaporation and reconstitution step. The evaporation by nitrogen stream is the most popular method, but not without difficulties: it is a well know fact that evaporative loss can occur and create a potential cause for poor recoveries.
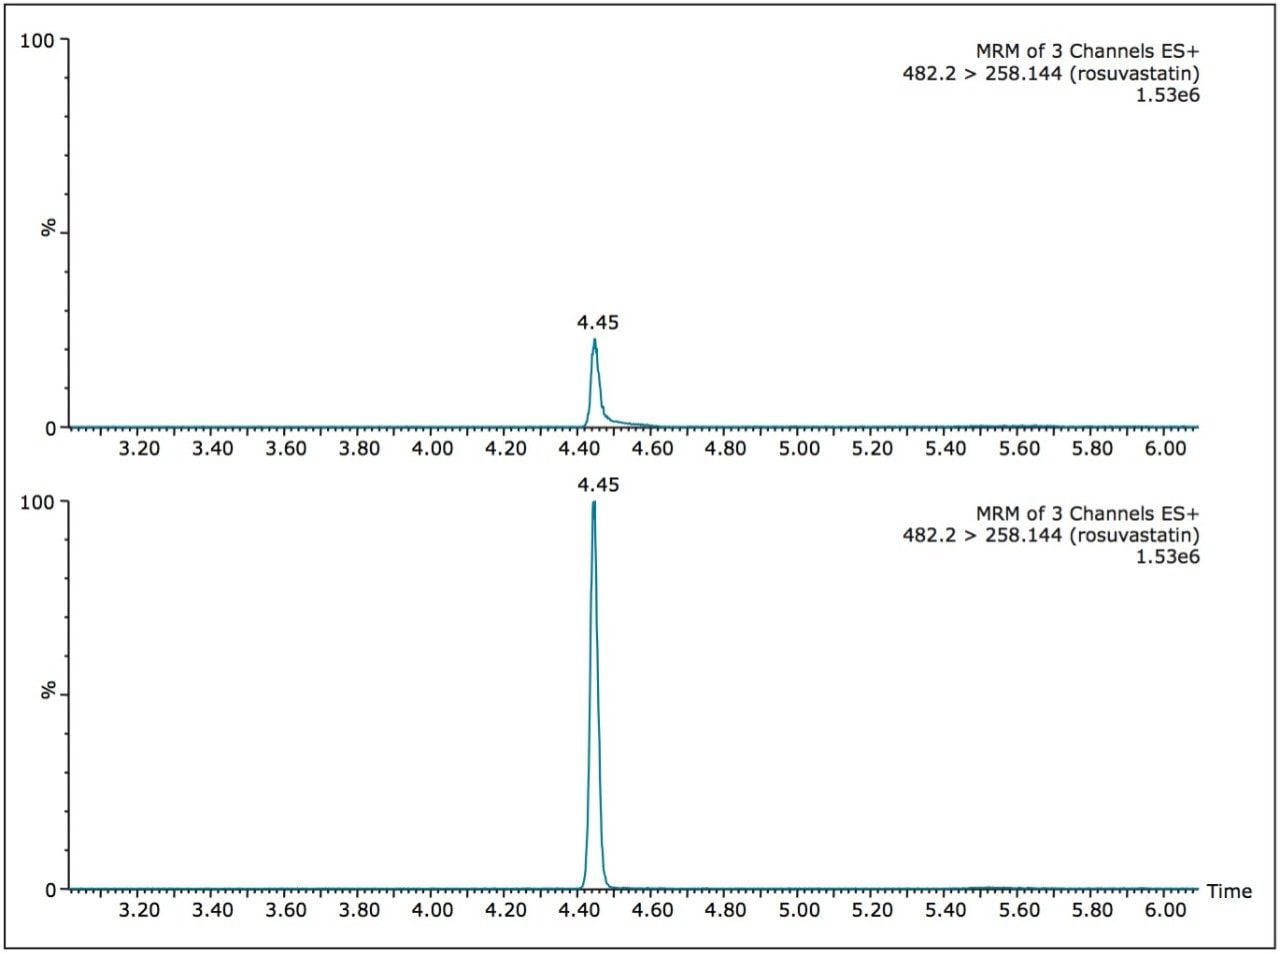
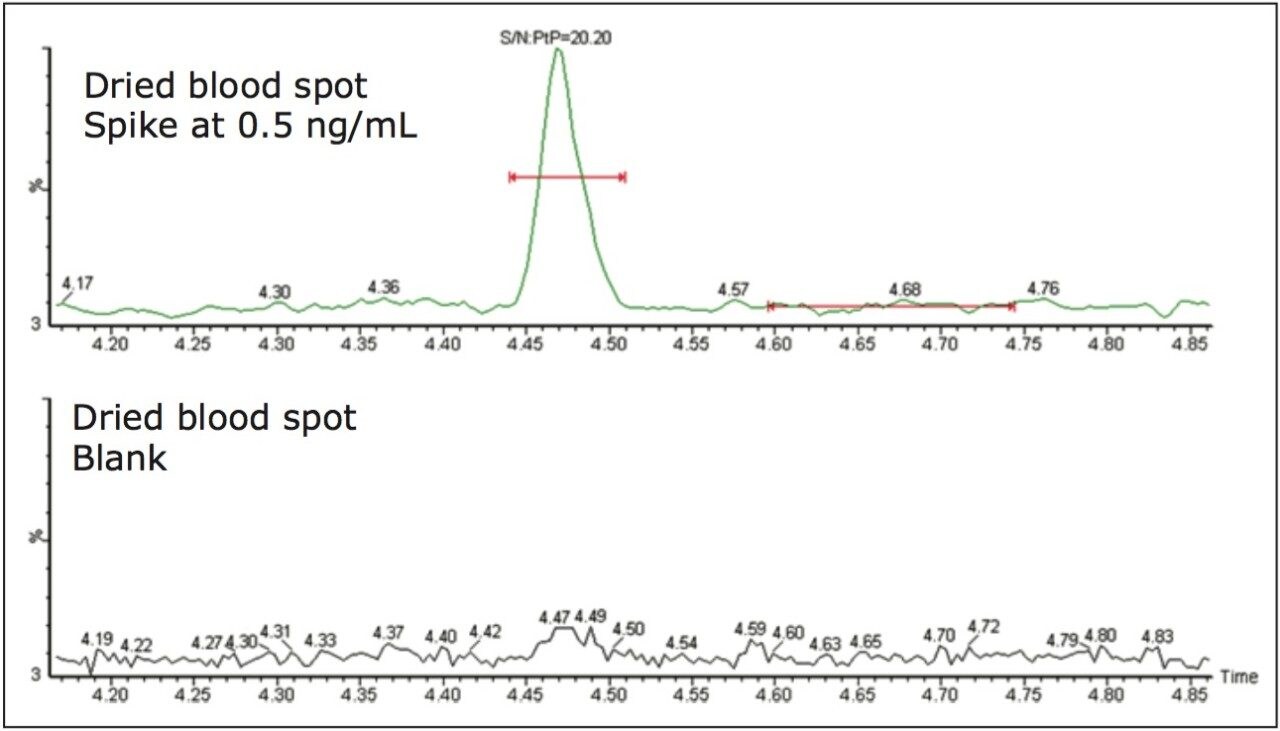
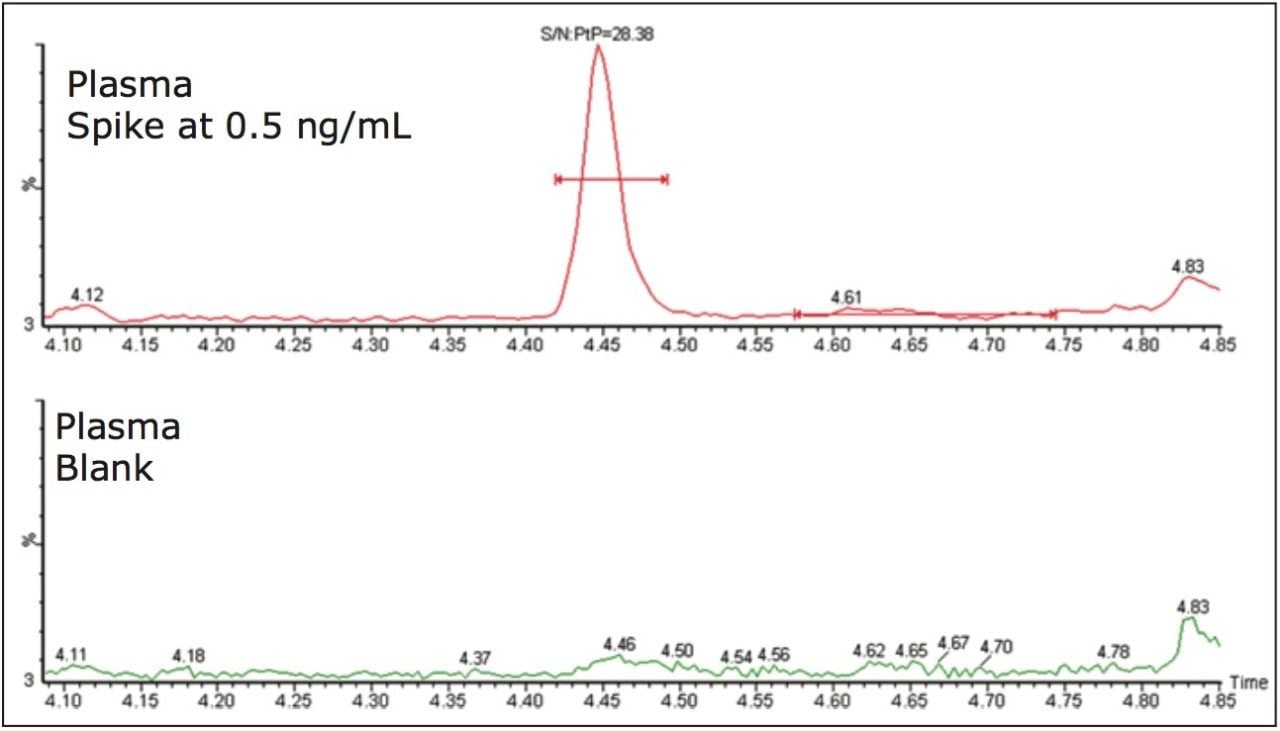
ACQUITY UPLC with 2D-LC technology3 allows the option of large-volume injection (up to 1000 μL) of aqueous and organic extracts, thus removing all evaporation and reconstitution steps from any extraction protocols. In this application, 15-μL aliquots of blood were spotted onto Whatman DMPK type B support cards. A 3-mm punch disk was suspended in 100 μL methanol. The LC-MS/MS analysis of rosuvastation was performed by using an injection volume of 85 μL enabling a detection limit of 0.5 ng/mL.
Loading conditions |
|
---|---|
Column: |
XBridge C18, 10 μm |
Loading: |
Water pH 7, no additives |
Flow rate: |
0.8 mL/min |
At-column dilution: |
Set at 20% dilution (0.2 mL/min pump A and 0.8 mL/min pump B) |
UPLC system: |
ACQUITY UPLC 2D configured for “Trap & Elute” with at-column dilution |
|
Runtime: |
10 min |
|
Column: |
ACQUITY UPLC BEH C18, 2.1 x 50 mm, 1.7 μm |
|
Column temp.: |
30 °C |
|
Mobile phase A: |
Water + 0.5 % formic acid |
|
Mobile phase B: |
Acetonitrile + 0.5 % formic acid |
|
Elution: |
5 minutes linear gradient from 5% (B) to 55% (B) |
|
Flow rate: |
0.500 mL/min (pump C) |
|
Injection volume: |
500 μL |
MS system: |
Xevo TQ-S |
Ionization mode: |
ESI Positive |
Capillary voltage: |
1.0 kV |
Cone voltage: |
60.0 V |
Source temp.: |
150 °C |
Desolvation temp.: |
550 °C |
Desolvation gas: |
1100 L/hr |
Cone gas: |
50 L/hr |
Methanol, acetonitrile, formic acid, and ammonium hydroxide were obtained from Sigma-Aldrich Chemicals (St. Louis,MO,USA). Human blood was purchased from Bioreclamation (Hicksville, NY) and stored refrigerated prior to use (blood was used within 7 days of purchase). Human plasma was also purchased from Bioreclamation and was stored at -80 °C. Rosuvastatin and the D6 deuterated internal standard were purchased from Toronto Research Chemicals (Ontario, Canada). Rosuvastatin was then prepared by dissolving the required amount of dry powder in methanol and diluting in 100% methanol to prepare standards for spiking into biological fluids.
The blood spot samples, calibration curves, and QCs were prepared by spiking authentic standard in solution into fresh human blood. Aliquots of 15 μL of blood were spotted onto Whatman DMPK type B cards. The center of the resulting blood spots were sampled using a 3-mm punch. These sample cores were then suspended in 100 μL of methanol, which was then shaken for one hour. The resulting extract was then centrifuged for five minutes at 13,000 relative centrifugal force (rcf). The extraction solvent was removed for injection onto the LC-MS/MS system.
The plasma samples, calibration curves, and QCs were prepared by spiking the required concentrations of the authentic standards (normal and deuterated) in solution into human plasma. A 100-μL aliquot of plasma was then mixed with 300 μL of acetonitrile and then vortex mixed with the resulting proteinprecipitated sample centrifuged at 13,000 rcf for five minutes. The supernatant was then removed for injection onto the LC-MS/MS system.
Rosuvastatin was monitored using the transition 482 ⇒ 258 and the transition 488 ⇒ 264 was employed for the D6 internal standard.
Trace level detection is directly linked to the enrichment factor from the sample preparation protocol and the injection volume utilized for quantification. While reversed-phase chromatography remains the most utilized technique for hydrophilic analysis, the final extract matrix must be compatible with the separation conditions to avoid volume or mass overload during the injection phase. In order to achieve gaussian and well-resolved peak shape, the sample matrix must be compatible with initial mobile phase conditions, usually with a high aqueous percentage (>95%). As a consequence, this requirement adds additional labour time during the final stage of sample preparation. In most instances, a target analyte is extracted from its original matrix with a high percentage of organic solvent (IPA, MeOH, ACN, Acetone, etc.). Therefore, the extract must undergo a solvent exchange from high-organic to high-aqueous. This is achieved by adding an evaporation-todryness step, followed by reconstitution in a suitable solvent. The popular method of gentle nitrogen gas stream is not without issue. It is a well-documented fact that evaporation by nitrogen stream can lead to evaporative loss and re-dissolution incompatibility. As such, these finals steps of the extraction protocol make for a very laborious and time consuming process.
In the field of multi-dimensional chromatography, the addition of a second dimension will lead to higher performance in terms of peak capacity, separation power, and resolution. The flexibility and scalability of hyphenated chromatography can lead to costeffective methods in terms of performance and workflow process. ACQUITY UPLC with 2D-LC Technology3 offers the option of a large-volume injection that is compatible with both aqueous and organic extracts. Increased injection volume can increase the detection limit by 100:1 for any optical or destructive detector. The ability to inject aqueous and organic extracts also brings an additional disruptive benefit to the sample preparation protocol. From that option, any or all evaporative and reconstitution steps can be eliminated from the sample preparation protocol. This feature is achieved by de-coupling the initial trapping phase from the separation process when using a single high-resolution dimension. As such, a custom trapping support is positioned between two distinct flow streams. The first stream is composed of a high-aqueous mobile phase with the unique function to operate at high k' for maximum and fast mass transfer from the mobile phase to the stationary phase. In this dimension, the flow rate, pH, and stationary phase retention strength are key parameters for effective retention. With a dual flow stream (at-column dilution or ACD) for the sample loading, aqueous and organic extracts are pre-diluted before reaching the trapping dimension. The effect of a single versus dual stream for a 10-μL injection rosuvastatin extract in 100% methanol is illustrated in Figure 1. Rosuvastatin shows peak distortion for the single stream loading. However, with the at-column dilution option, a higher signal is observed due to improved trapping efficiency.
For any analytical methods, reaching maximum sensitivity is an integral parameter and must be subject to evaluation. Therefore, the signal of rosuvastatin was measured in aqueous and organic extracts using a 1D and a 2D configuration (See Table 1). The results shows two important aspects. The area counts for six consecutive injections show excellent reproducibility with a coefficient of variation (CV’s) below 3%. This result indicates no noticeable variations between a 1D and a 2D configuration. The second observation, rosuvastatin shows a higher response with a methanol extract with the 2D configuration. The increase in signal with organicextract indicates a reduction of potential active sites, mostly related to glass vial. Rosuvastatin has sulfur and nitrogen moities in its core chemical structure, and since glass surfaces can exhibit ion exchange capabilities (anion and cation) under aqueous conditions, it is plausible that rosuvastatin is subjected to an additional retention ion exchange mechanism. The switch from aqueous to methanol simply deactivates the ion exchange capability of the glass vial. The rate of retention is largely dependent on the target analyte. In Figures 2 and 3, two test probes were injected under aqueous and methanol conditions with five sequential injections. In Figure 2, the aqueous extract shows a drastic signal reduction after the third injection, which in many cases could be falsely interpreted as potential carry over issue. The extract in methanol shows a stable signal for all five injections, and it is worth pointing out that the signal for both extracts on the first injection are at a similar level. In some other instances, the adsorption rate can be quite fast. In Figure 3, the five consecutive injections for the aqueous extract are constant (e6 signal), but in methanol the signal shows a 10-fold signal increase (e7 signal), for the same concentration.
For comparison purposes, the dried blood spot with methanol soak was paired with a plasma matrix analysis using a protein precipitation approach. Both extracts exhibit a similar sample complexity and the interest was to evaluate the robustnes of the 2D configuration for low injection volume (<100 μL) and with high-organic percentage. A representative chromatogram at 0.5 ng/mL for rosuvastatin in dried blood spot and a blank injection is shown in Figure 4. The peak shape is well defined and exhibits a gaussian peak shape. The signal-to-noise ratio was set at 20:1 for a 15-μL starting volume. The assay was validated using a 3-run protocol on 3 successive days in accordance with FDA validation guidelines.4 The method validation data is shown in Table 2 where the inter-day precision and accuracy showed bias of 14.8% and a CV of 4.0% at the 0.5-ng/mL level and bias of 1.4% and a CV of 1.2% at the 80-ng/mL level.
With the plasma assay, rosuvastatin was spiked into human plasma and treated at a 3:1 precipitation ratio with acetonitrile. A representative chromatogram for the LLOQ standard and the blank immediately following the 50-ng/mL standard are shown in Figure 5. Here we can see that the 2D solution provides excellent chromatographic performance and a very clean chromatogram. The plasma protein precipitation method was subjected to a one-run validation using a 96-well sample plate. The method was demonstrated to be linear over a range of 0.1–50 ng/mL with an r2 value of 0.9995 obtained for the calibration curve using a linear 1/x weighting.
The results obtained for dried blood spots and plasma sample using ACQUITY UPLC with 2D-LC Technology showed the benefit of large-volume injection (high-organic percentage) and the elimination of the evaporation and reconstitution steps from the extraction protocol. The time-saving workflow also demonstrated excellent reproducibility and robustness. Moreover, the methodology showcased an increase in the MS signal with highorganic percentage matrix in comparison to aqueous extract.
720005213, December 2014