
Optimization of Lipid Nanoparticle Analysis Across Universal Detectors
Andrew Steere, Norris Wong, Paula Hong
Waters Corporation, United States
Published on September 25, 2026

Abstract
Lipid nanoparticles (LNPs) have become critical drug delivery vehicles for mRNA vaccines. Because many lipid components lack UV chromophores, their analysis requires detection based on alternative physicochemical properties. Universal detectors, which provide response for a broad range of analytes, are commonly used for this purpose; two widely used approaches are charged aerosol detection (CAD) and evaporative light scattering detection (ELSD). Although both techniques are aerosol based, their detection mechanisms differ, which can affect sensitivity, repeatability, and quantitative performance. In this study, CAD and ELSD were evaluated using a representative LNP sample to compare detector performance. Linearity, accuracy, and limit of quantitation (LOQ) were assessed, and sample recovery was determined. Overall, CAD provided improved sensitivity and precision for LNP analysis compared with ELSD.
Benefits
- Waters Charged Aerosol Detector provides improved sensitivity for LNP analysis, enabling lower LOQ values compared with ELSD
- CAD demonstrates superior repeatability at lower concentrations enabling more accurate and precise quantitation
Introduction
LNPs are particles that act as a delivery system for genetic material into cells. Nucleic acids readily degrade in the body and do not naturally enter cells, and LNPs protect the payload and deliver it efficiently into cells.1 In recent years, they have become a critical component in mRNA vaccines. LNPs consist of four components that encapsulate a payload for delivery into target cells: phospholipid (allows the LNP to fuse to the target cell), ionizable lipid (encapsulates the nucleic acids and supports release in the cell), PEG-lipid (controls particle size and forms a hydrophilic layer on surface), and cholesterol (contributes to the overall stability of the LNP).2 These components must be present in specific ratios to properly control potency and efficacy of an LNP. Any difference in lipid ratio can lead to changes in size, stability, or delivery performance of the particle. For this reason, reliable analytical methods are required for drug development and regulatory testing.
Many lipid components lack a necessary chromophore to allow for traditional UV-based testing. As a result, LNP analysis is typically performed using a universal detector.3 Two common universal detection methods are CAD and ELSD. Though both detectors are aerosol based and are useful for detecting many non-volatile or semi-volatile components with little or no UV response, they function in different ways. For both mechanisms, the mobile phase with sample flows from the LC column into the nebulizer where it is combined with gas and droplet formulation occurs. The droplets are then evaporated with heat, leaving only solid analyte particles. In CAD detection, the particles are carried into the mixing chamber, where they interact with charged gas before being measured by the electrometer. CAD response is dependent on the particle size to charge relationship.4 Conversely, in ELSD, the dried particles travel through a beam of light which causes scattering and is measured. ELSD response is dependent on the particle size to light scattering relationship. Both detectors are considered nonlinear detectors, with a limited dynamic range over which a linear relationship can be established. For this reason, log-log transformation is typically used to assess linearity.
The same LNP analysis was run using both CAD and ELSD to examine the impact of each detection technique on linearity and precision, specifically at the LOQs, as well as LNP component recovery.
Experimental
Stocks were prepared for each of the four LNP components. The four components used were based on typical industry LNP formulations. SM-102 (Cayman Chemical), cholesterol (Sigma-Aldrich), DSPC (Sigma-Aldrich), and DSPE-PEG 2000 (Avanti) stocks were prepared at 2 mg/g in methanol. Standards were prepared containing each component in equal concentration from 5 to 500 µg/g in methanol. Representative samples were also prepared at a concentration ratio of 50: 38.5: 10: 1.5 SM-102: cholesterol: DSPC: DSPE-PEG 2000 in methanol at two different levels. This yielded final sample concentrations of 167 µg/g SM-102, 128 µg/g cholesterol, 33 µg/g DSPC, and 5 µg/g DSPE-PEG 2000 for the lower concentration sample and 500 µg/g SM-102, 385 µg/g cholesterol, 100 µg/g DSPC, and 15 µg/g DSPE-PEG 2000 for the higher concentration sample. A full summary of conditions and detector settings for both CAD and ELSD are shown below.
LC Conditions
|
System: |
ACQUITY™ Premier UPLC™ System |
|
Detection: |
ELSD and CAD |
|
Column: |
CORTECS™ Phenyl Column, 90 Å, 1.6 µm, 2.1 x 100 mm (p/n: 186008381) |
|
Mobile phase A: |
10 mM ammonium acetate in 90/10 methanol/water |
|
Mobile phase B: |
10 mM Ammonium acetate in 90/10 acetonitrile/water |
|
Needle wash: |
50/50 water/acetonitrile |
|
Flow rate: |
0.400 mL/min |
|
Injection volume: |
5 µL |
|
Sample temprature: |
12 °C |
|
Column temperature: |
30 °C |
|
Power function value (CAD): |
1 |
|
Evaporator temperature (CAD): |
40 °C |
|
Nebulizer mode (ELSD): |
Cooling |
|
Drift tube temperature (ELSD): |
50 °C |
|
Gas pressure (ELSD): |
40 psi |
|
Gain (ELSD): |
125 |
|
Data rate: |
2 Hz |
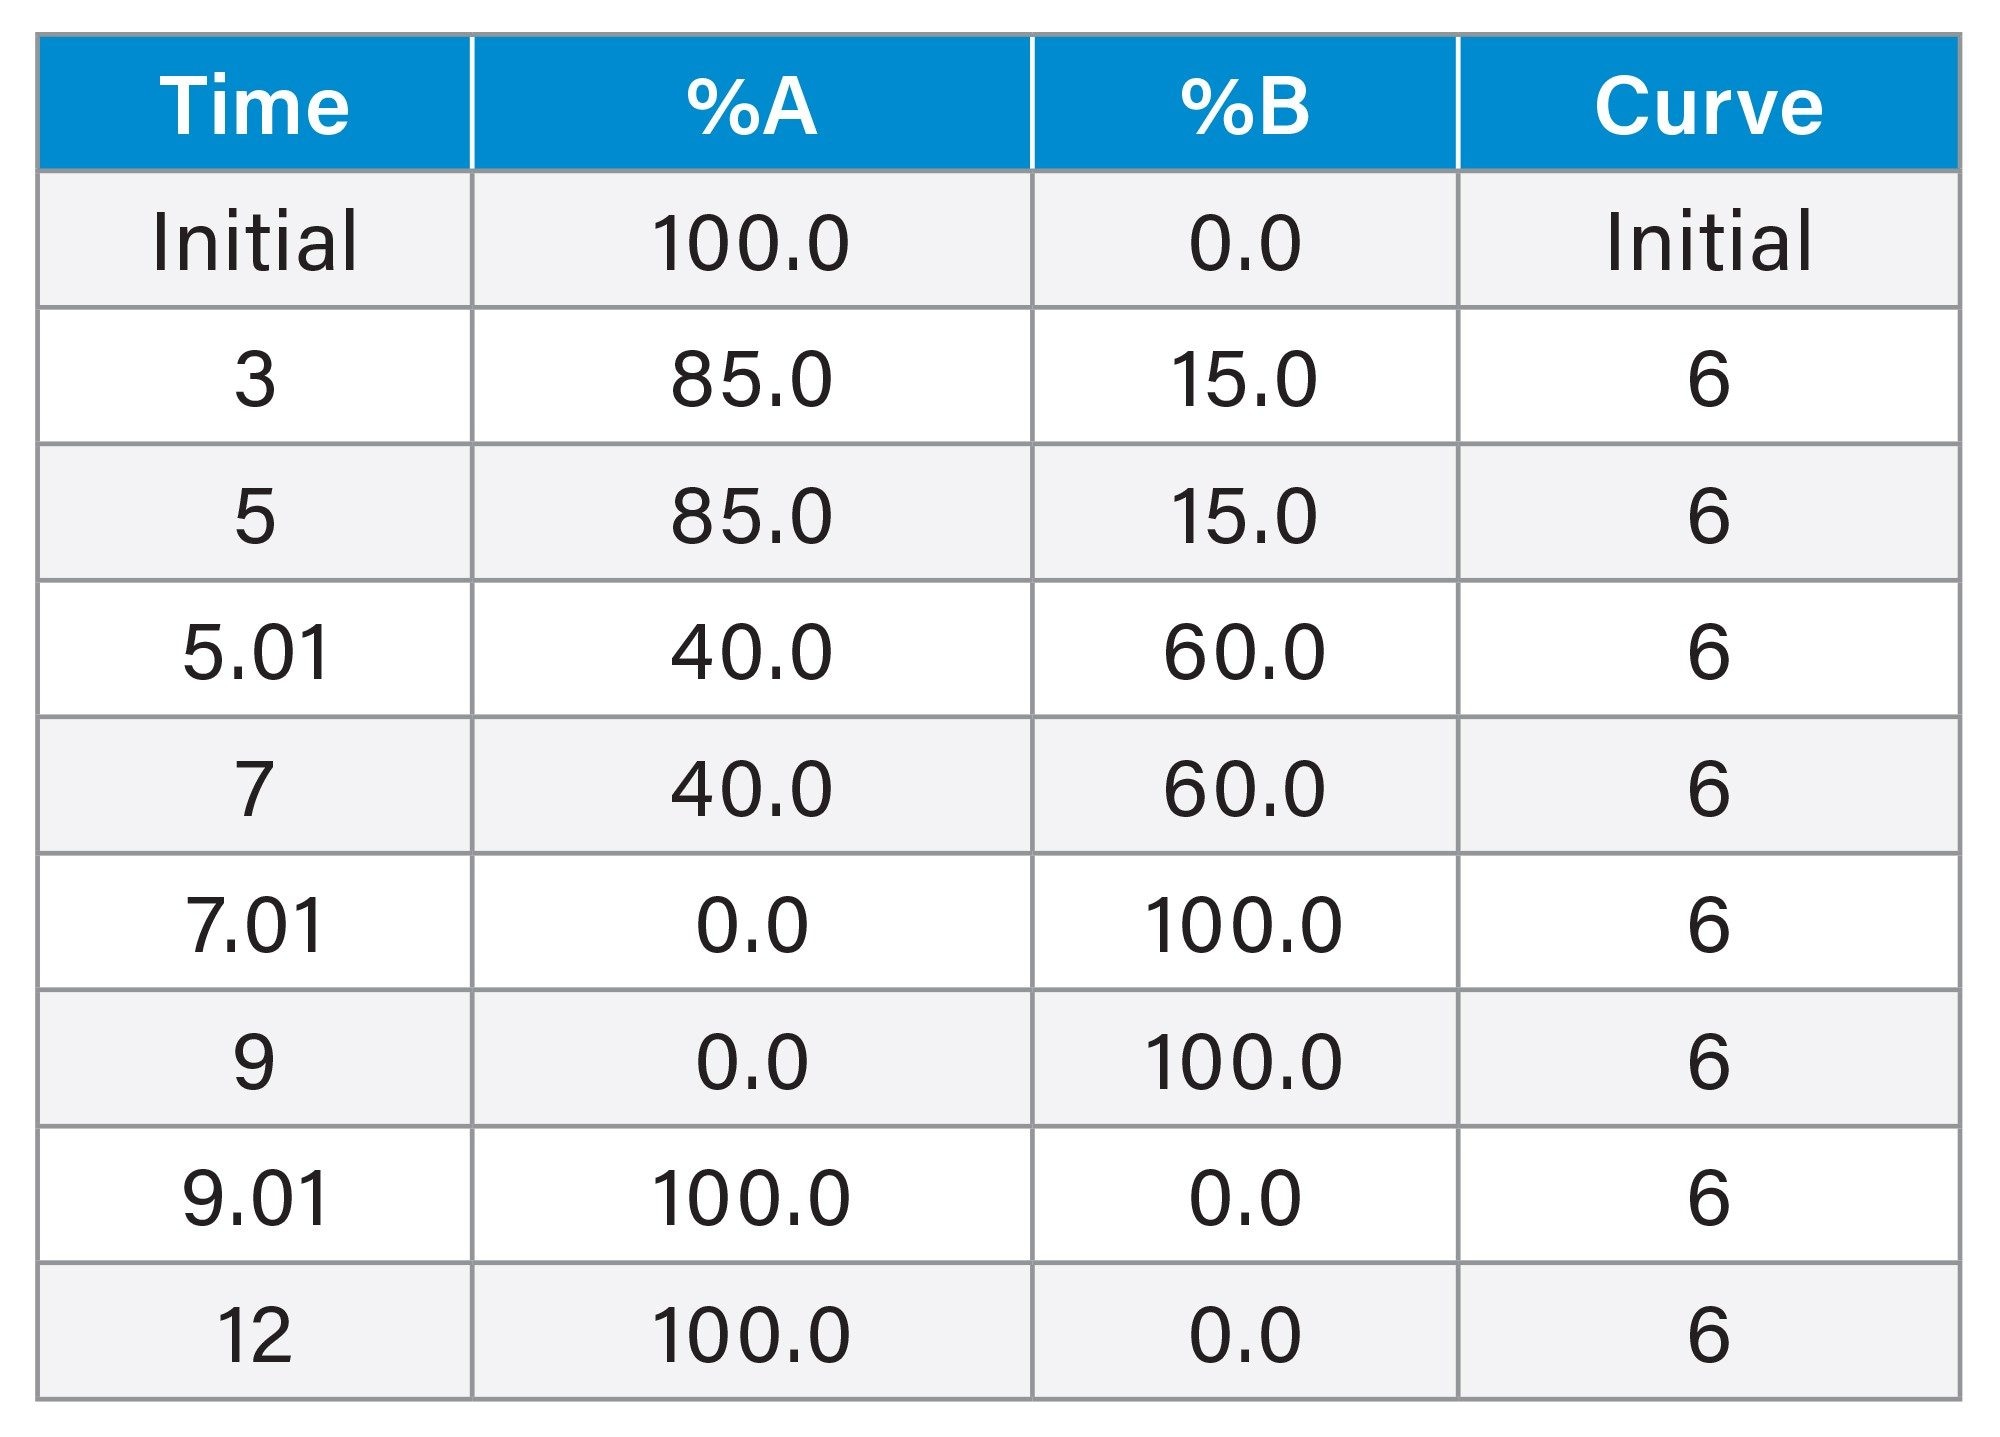
Gradient Table
Results and Discussion
Method conditions and gradients were developed and optimized using an ACQUITY Premier UPLC System with a CAD. Power function value and evaporator temperature were optimized and a gradient was established that yielded good peak shape with sufficient resolution between peaks. The method was then transferred to the same system using an ELSD, and detector settings including nebulizer temperature, drift tube temperature, gas pressure, and gain were optimized while all other conditions were kept the same. Due to large differences in peak heights on ELSD, there were development challenges in balancing the sensitivity for some compounds without sacrificing peak shape on others.
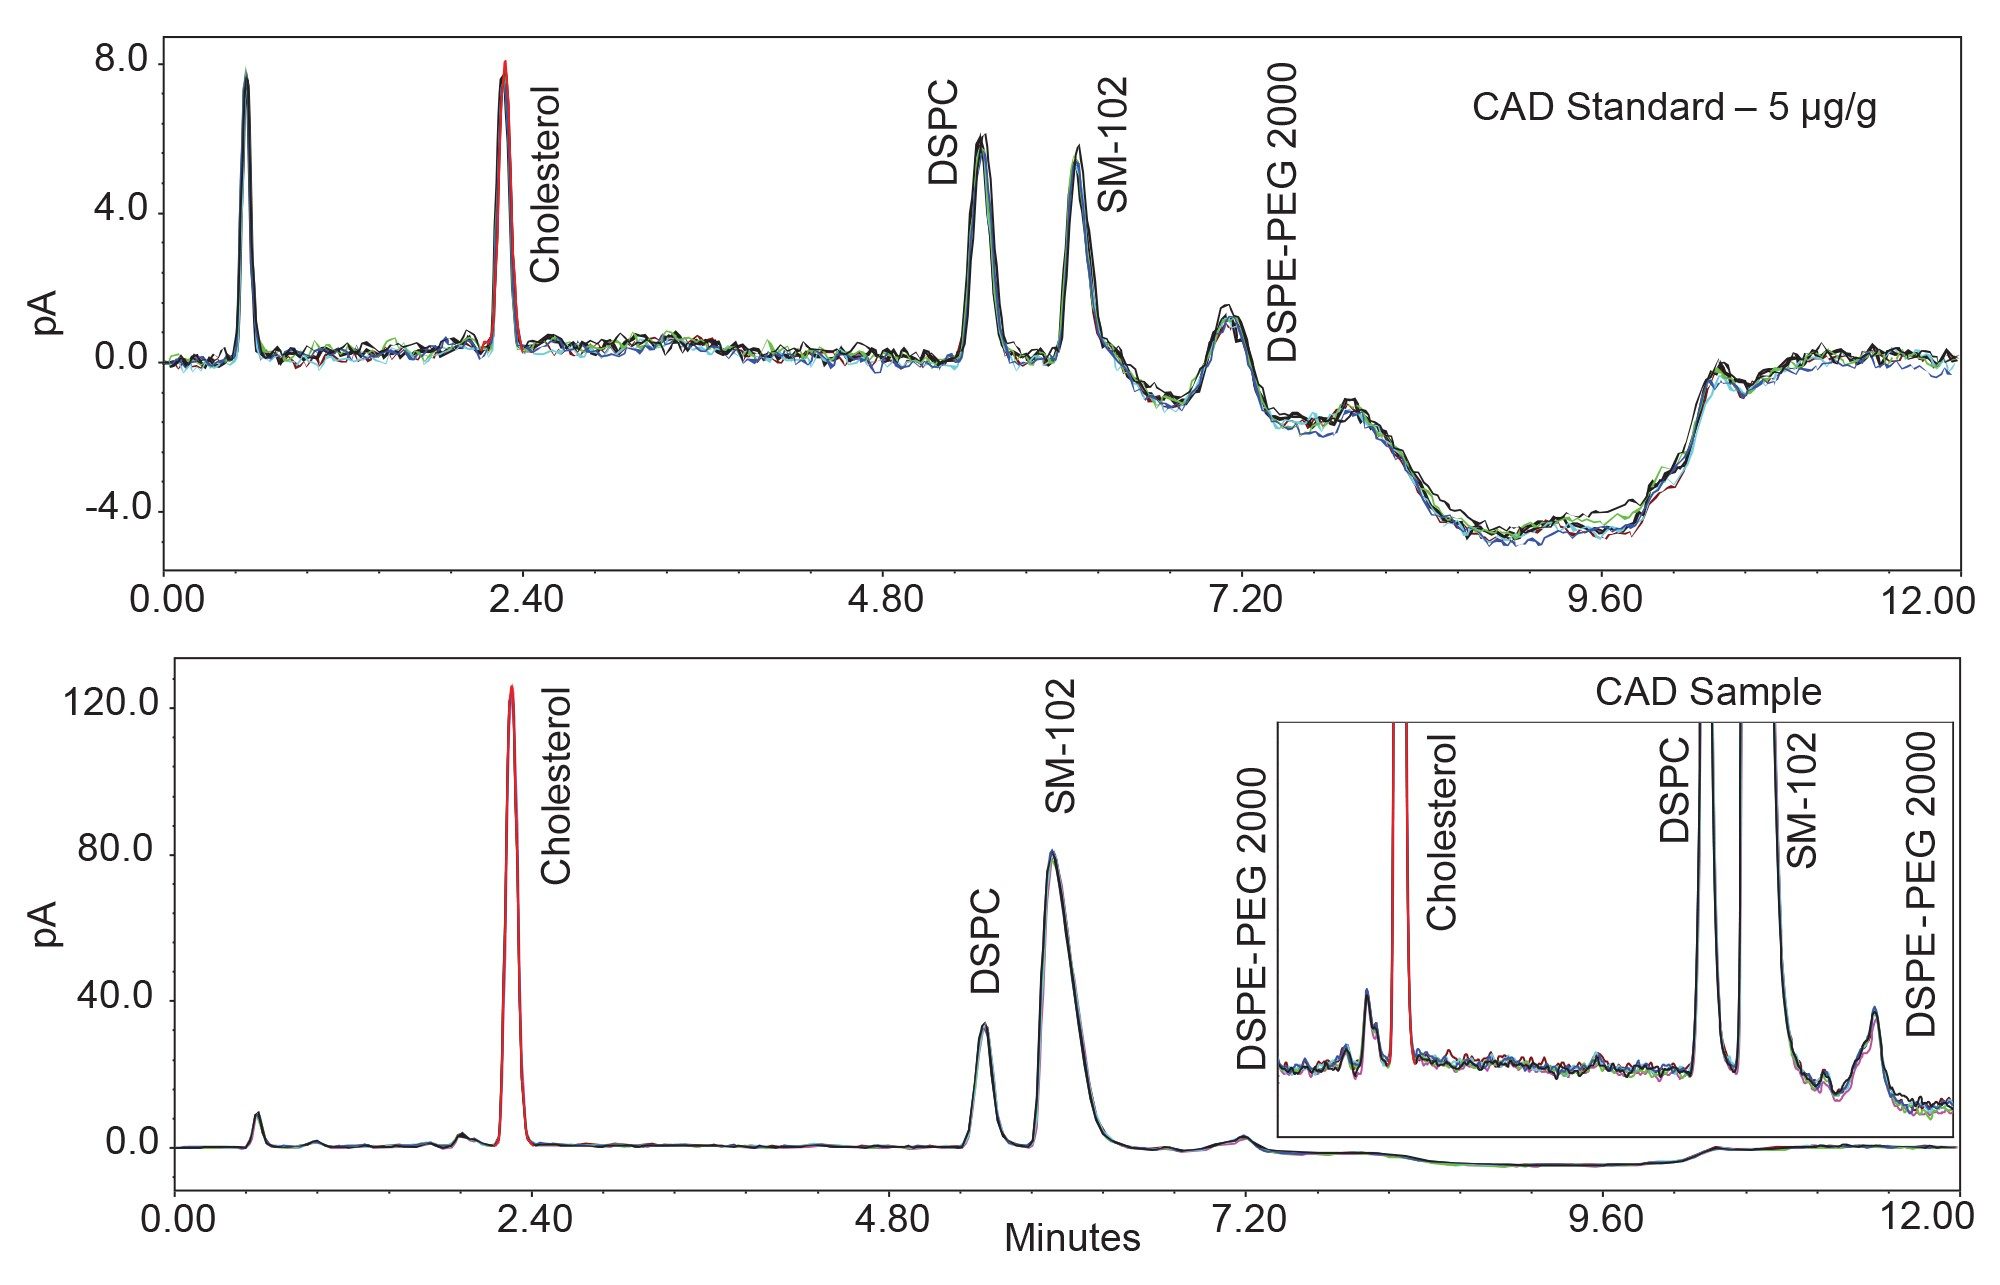
Chromatographic results obtained using the CAD are shown in Figure 1. The top chromatogram shows an overlay of six standard injections at 5 µg/g, which represents the established LOQ for all four compounds. The LOQ was defined as a signal-to-noise (S/N) ratio > 10 and area percent RSD < 15% across six replicate injections. The bottom chromatogram shows an overlay of six injections of the lower concentration sample, containing 5 µg/g DSPE-PEG 2000. Visual inspection of the chromatogram demonstrates full baseline resolution of the critical pair of DSPC and SM-102 peaks and a USP resolution of 2.5.
The analysis was then replicated on the same system with an ELSD. All system level instrument method conditions remained the same across the two system configurations, however, ELSD specific settings were optimized separately to maximize response and S/N. The differing mechanisms of detection on the two detectors lead to a less sensitive response on the ELSD, meaning it is more difficult to achieve sufficient signal for quantitation at the lowest levels. ELSD chromatographic results are shown in Figure 2.
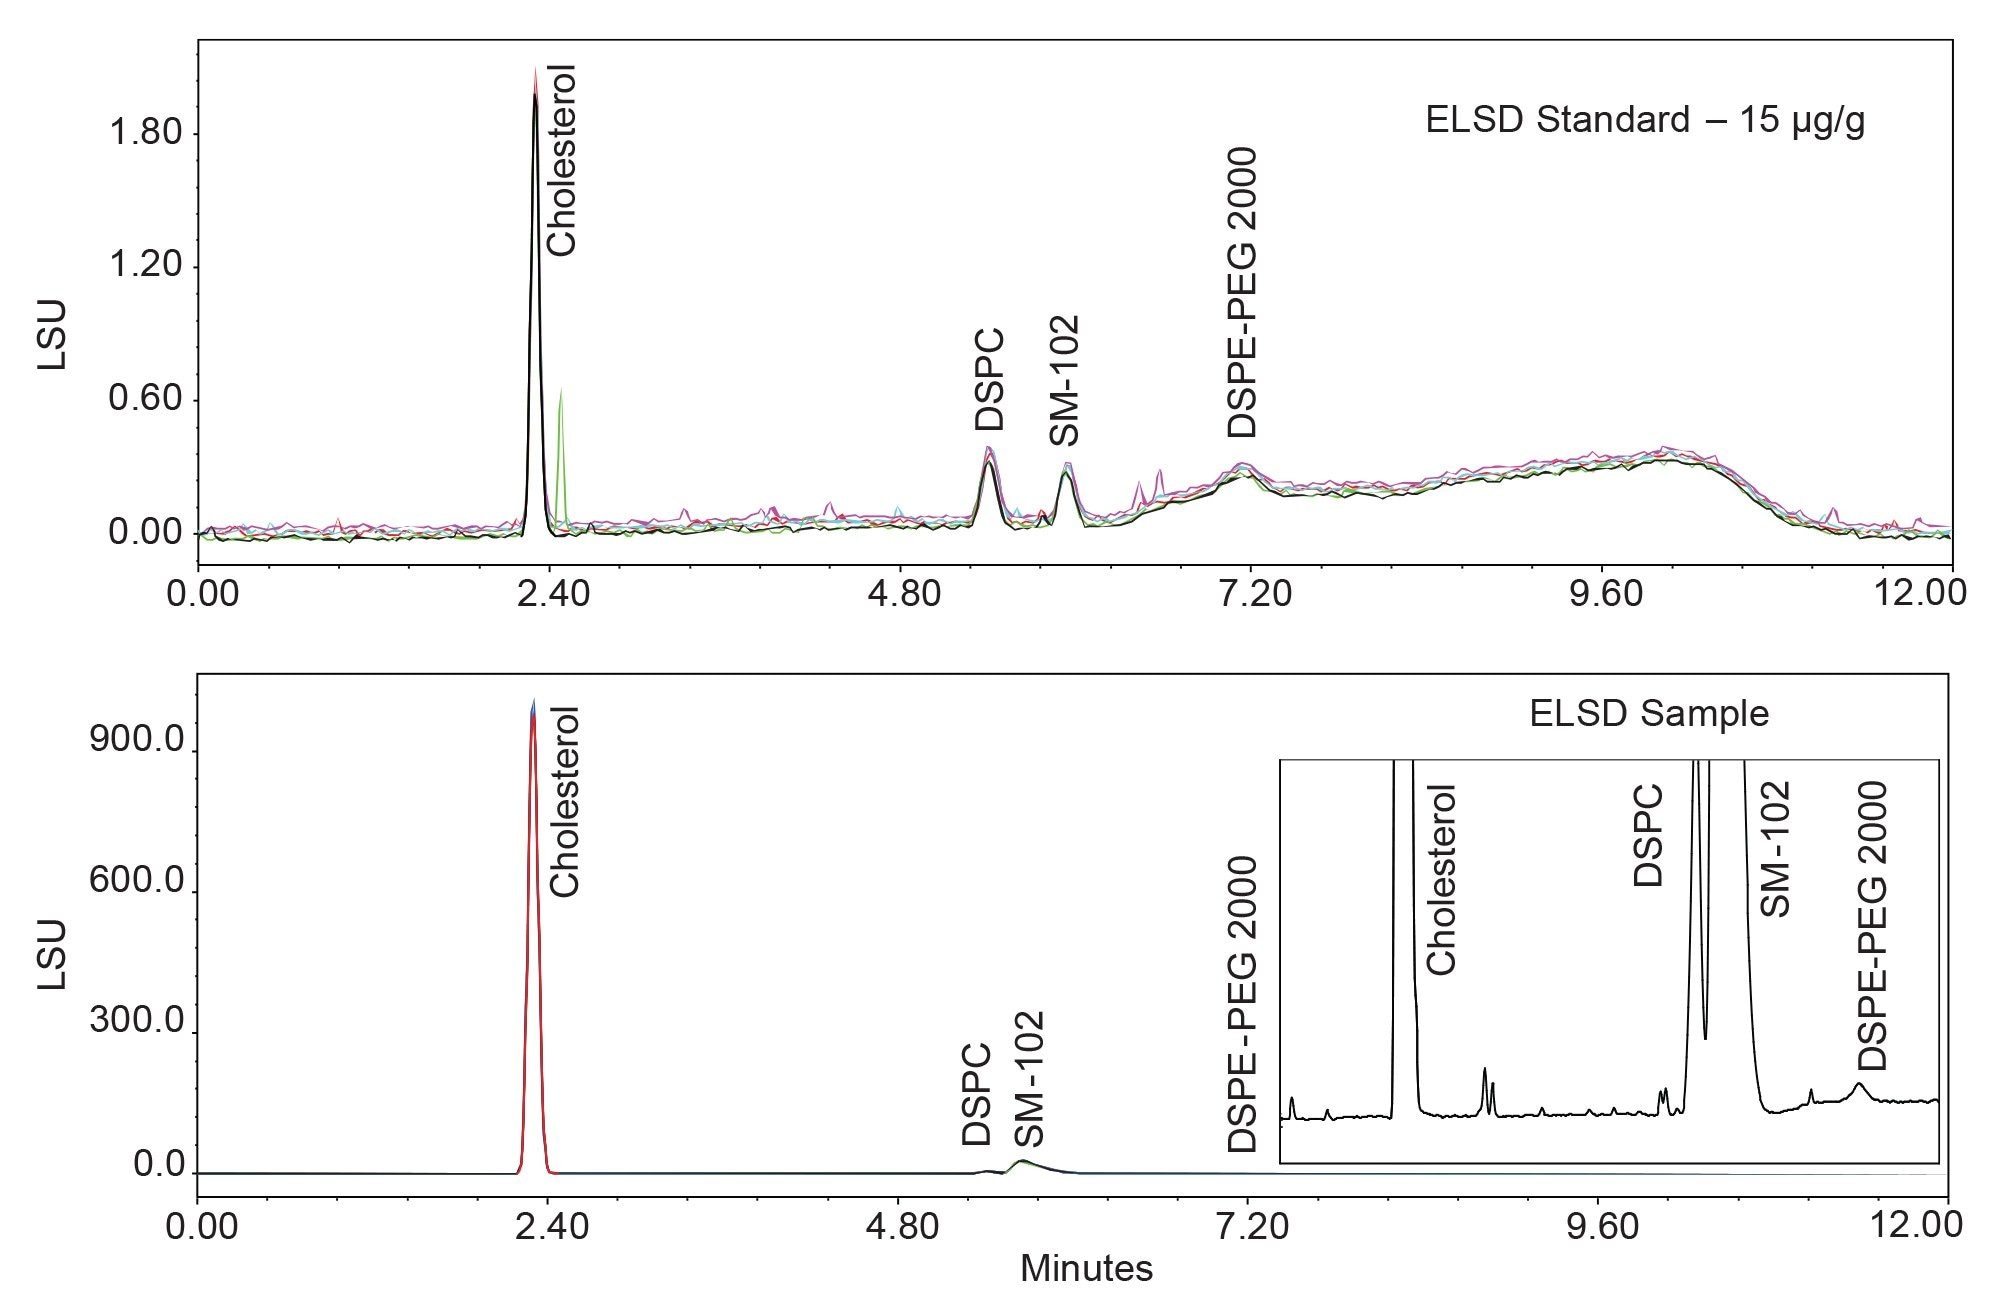
The lowest concentration level that was able to achieve the LOQ criteria previously defined for all four compounds was 15 µg/g. Cholesterol and SM-102 have sufficient signal and repeatability at 5 µg/g to establish LOQ, and DSPC LOQ is determined to be 10 µg/g. However, the results for DSPE-PEG 2000 are not suitable for LOQ determination until the 15 µg/g due to low response. As DSPE-PEG 2000 is the compound with the lowest concentration in the formulation, it is the limiting factor for overall sample concentration for all compounds at the desired ratio. Even at this level, the DSPE-PEG 2000 standard peak that can be seen in Figure 2 has a lower average S/N than the peak that can be seen in the 5 µg/g standard run on the CAD in Figure 1.
The sample chromatogram for the ELSD shown in Figure 2 uses the higher concentration sample, with DSPE-PEG 2000 at the LOQ level of 15 µg/g, SM-102 at 500 µg/g, cholesterol at 385 µg/g, and DSPC at 100 µg/g. This increased concentration, which is required due to the lower sensitivity observed on the ELSD, causes co-elution of the critical pair of SM-102 and DSPC. The chromatographic inlay shows decreased resolution compared to the full baseline resolution seen on CAD.
LOQ results obtained using both detectors are summarized in Figure 3. Every component had an LOQ value on CAD that was equal to or lower than ELSD. DSPC peaks could be observed in the 5 µg/g standard on ELSD, but repeatability was insufficient to be used as LOQ. The DSPE-PEG 2000 peak was not discernible from the baseline at concentrations below 15 µg/g. Calibration curves were created using a log-log linear fit. Log-log linear fitting is used because both detectors are inherently non-linear detectors and only yield linear results over small concentration ranges. A power-law relationship exists in the data and is more accurately measured using a log-log linear fit to give a more accurate fit over a wider range.
The calibration curve coefficient of determination (R2) values are also shown in Figure 3. The curves were calculated from the LOQ to 500 µg/g, meaning there are between seven and nine data points associated with each curve depending on what level LOQ was established. All R2 values obtained on both detectors showed strong linear correlation, with the lowest R2 value calculated to be 0.994. The R2 values obtained on the CAD were higher for every compound, with the lowest R2 value calculated to be 0.998. Across all CAD calibrant injections, no relative residuals were found to be above 15% for any compound. Results obtained using ELSD were similarly accurate across most compounds and concentration levels, though DSPE-PEG 2000 at the LOQ level showed deviations up to 21%.

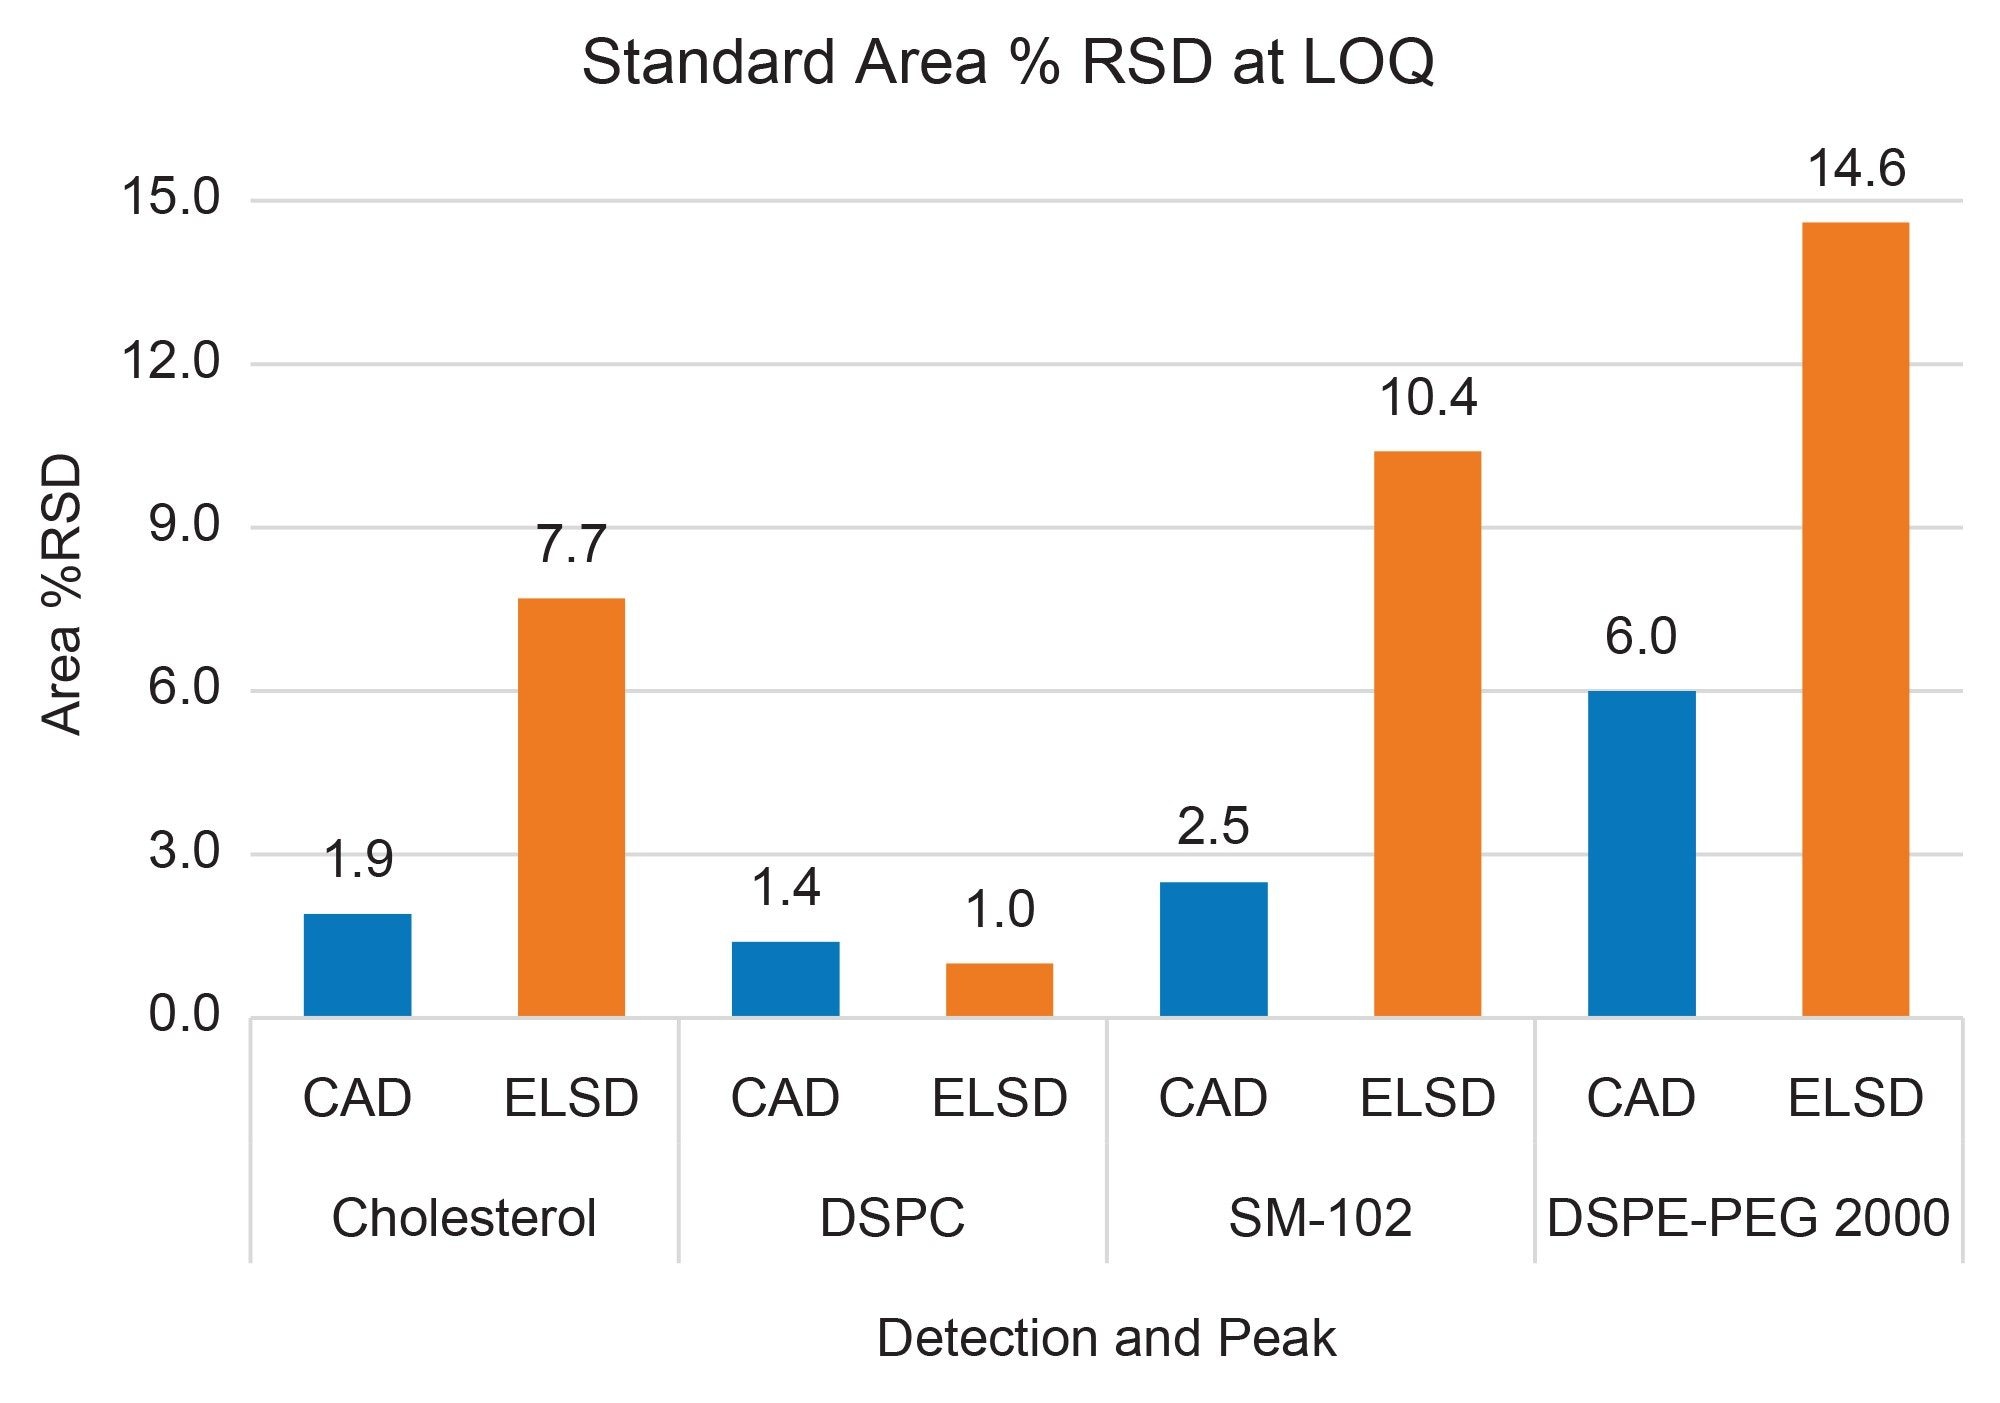
Repeatability (area RSD) results were calculated for each compound at the LOQ level for both detectors and are shown in Figure 4. All RSDs were below 15%, and on the CAD all results were at or below 6%. As previously shown in Figure 3, LOQ levels for cholesterol and SM-102 were found to be 5 µg/g for both detectors. For these two peaks, area RSD values were both at least four times smaller on CAD compared to ELSD. For DSPC, results are very similar across the two detectors despite an LOQ of 5 µg/g on CAD and 10 µg/g on ELSD. For DSPE-PEG 2000, there was a significantly lower RSD on CAD despite being at a concentration three times lower than ELSD. These results confirm an increased repeatability when using CAD at lower concentrations, supporting the use of CAD for low level analyte measurements.
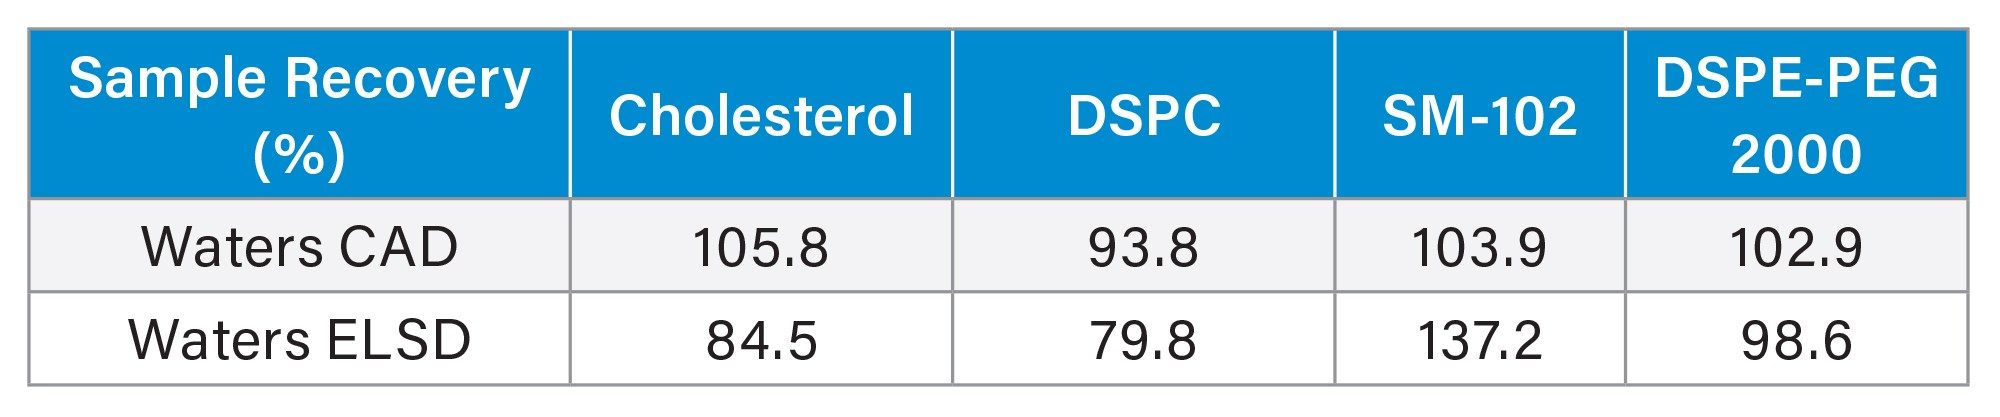
The calibration curves were then used to calculate sample recoveries for each detector by comparing the spiked amount to calculated amount. The CAD results used the lower concentration sample, with concentrations ranging from 5 µg/g DSPE-PEG 2000 up to 167 µg/g SM-102, while the ELSD results used the higher concentration sample with concentrations ranging from 15 µg/g DSPE-PEG 2000 to 500 µg/g SM-102 due to the lower observed sensitivity of the ELSD. The range of recoveries on CAD was from 93.8% to 105.8%, while the range of recoveries on the ELSD was from 79.8% to 137.2%. The smaller range of results and closeness to 100% recovery demonstrates greater accuracy and precision for samples on the CAD compared to the ELSD. The superior sensitivity on the CAD ensured more accurate curves for basis of quantitation and lower S/N on the ELSD yielded a wider range of results.
Conclusion
This study demonstrates the performance of universal detectors for LNP analysis. CAD achieved uniformly lower LOQ values (5 µg/g for all components) compared to ELSD, which required 10–15 µg/g for DSPC and DSPE-PEG 2000. Additionally, CAD demonstrated superior repeatability at low concentrations, with area %RSD values approximately half those observed on ELSD for cholesterol, SM-102, and DSPE-PEG 2000. Both detectors yielded strong log-log calibration linearity (R² ≥ 0.994), though CAD consistently produced higher R² values across all four lipid components over a wider range. Overall, CAD is the recommended universal detection method for LNP quantitation, offering greater sensitivity, precision, and chromatographic resolution on the critical DSPC/SM-102 pair.
References
- Hou, X.; Zaks, T.; Langer, R. Lipid Nanoparticles for mRNA delivery. Nat Rev Mater 6, 1078–1094 (2021).
- Albertsen, C.H.; et al. The Role of Lipid Components in Lipid Nanoparticles for Vaccines and Gene Therapy. Adv Drug Deliv (Rev. 2022), 188:114416.
- Barnhart, W. W.; Farooq, M. Q.; Ahmad, I. A. H. A Simplified Tutorial on Charged Aerosol Detection: Understanding the Basics, Optimization, and Troubleshooting. Journal of Chromatography Open, (2024) 100181.
- DeLaney, K.; Han, D.; Birdsall, R.E.; Yu, Y.Q. Optimized ELSD Workflow for Improved Detection of Lipid Nanoparticle Components. Waters Application Note. 720007740.
720009580, September 2026


