Analytical Scale Isolation and Purification of Propranolol Impurities Including Nitrosamine Drug Substance Related Impurity (NDSRI)
Margaret Maziarz, Paul Rainville, Stephanie Harden
Waters Corporation, United States
Published on Novemebr 07, 2025
Abstract
Nitrosamine drug substance-related impurities (NDSRIs) are a class of potentially carcinogenic compounds that can compromise drug safety. These impurities can form during manufacturing or storage and may lack carcinogenicity data, structural information, and reference standards. To enable structural characterization and identification, NDSRIs can be isolated using liquid chromatography (LC)-based purification with fraction collection. The work in this application note details an analytical scale isolation and purification workflow of an N-nitroso-propranolol, a nitrosated derivative of propranolol drug. Pure fractions of N-nitroso-propranolol and other low-level impurities were collected using a Waters™ Fraction Manager - Analytical (WFM-A) configured with an Arc™ Premier System, 2998 Photodiode Array (PDA) Detector, and an ACQUITY™ QDa™ II Mass Detector. The specificity of the mass-triggered fraction collection enabled efficient isolation of target impurities. Focused gradient elution enhanced resolution of closely eluting components, while time-based collection mode ensured precise targeting of known retention windows. The MassLynx™ with the FractionLynx™ Application Manager Software facilitated the collection process.
Benefits
- An analytical scale purification of trace-level impurities using Waters Fraction Manager - Analytical (WFM-A) configured with an Arc Premier System, 2998 PDA Detector, and ACQUITY QDa II Mass Detector
- Detection and isolation of low–levels impurities using a low dispersion system configuration with sub-5 µm particle size analytical columns designed to deliver narrow peaks, fast chromatography with enhanced resolution
- Collection of pure fractions to achieve high-purity materials by optimizing chromatographic separation of coeluting peaks using a shallow focused gradient without increasing the total run time
Introduction
NDSRIs are a class of nitrosamines that share structural similarity to the active pharmaceutical ingredients (APIs) of drug products.1–2 These impurities can form through chemical reactions between the APIs and the nitrosating agents, such as residual nitrites, present in excipients used to formulate drug products during manufacturing and storage.1–2 NDSRIs pose a carcinogenic risk to drug safety and human health.
Propranolol hydrochloride, a widely used beta-blocker for the treatment of hypertension, angina, arrhythmias, and other cardiovascular conditions.3 Under acidic conditions, propranolol can react with nitrite, a common nitrosating agent, to form N-nitroso-propranolol, a nitrosated derivative structurally related to the parent API. Like other NDSRIs, N-nitroso-propranolol is considered a potential human carcinogen, raising concerns about its presence as a low-level impurity in drug formulations.
When new impurities and degradation products are observed during synthesis, manufacturing, stability studies, and storage of drug substances and drug products, they should be correctly characterized and identified.4–6 To accurately quantify new impurities, the use of appropriate reference standards is essential. When structural information is available, these standards can often be synthesized. However, if synthesis is not feasible, an alternative approach involves isolating and purifying impurities directly from the drug product or formulation, allowing them to be used as reference materials for further analysis.7
Work in this application note illustrates a workflow for isolation and purification of N-nitroso-propranolol and other low-level impurities of the propranolol API through fraction collection using the WFM-A configured with an Arc Premier System. A focused gradient was applied to optimize the chromatographic separation between an impurity co-eluting with the propranolol API peak, allowing for isolation of pure fractions. Purity of the collected fractions was verified through analysis using an orthogonal column chemistry. The workflows and tools presented here provide analytical scientists with a reliable approach for isolating and purifying trace-level impurities in pharmaceutical drug substances and drug products at the analytical scale.
Experimental
Materials
Mass spectrometry (optima LC/MS) grade solvents and formic acids were obtained from Fisher Scientific. N-nitroso-propranolol purchased from Toronto Research Chemicals (Toronto, Ontario). Propranolol hydrochloride was purchased from Sigma Aldrich.
Sample Description
Propranolol stock solution prepared in methanol at 5 mg/mL was diluted with 20:80 acetonitrile/water diluent to the working concentration of 1 mg/mL. N-nitroso-propranolol stock was prepared at 10 mg/mL in 10:90 DMSO/Acetonitrile and spiked to propranolol working solution at 10 µg/mL level.
Method for Fraction Collection
|
LC system: |
Arc Premier System with Binary Solvent Manager (BSM-R) and Flow-Through Needle (FTN-R) 2998 PDA and ACQUITY QDa II Mass Detector Waters Fraction Manager-Analytical (WFM-A) |
|
Vials: |
LCMS Maximum Recovery 2 mL (p/n: 600000749CV) |
|
Column: |
XSelect ™ Premier ™ CSH C18 Column, 4.6 mm internal diameter (ID) x 100 mm, 2.5 µm (p/n: 186009873) |
|
Column temperature: |
30 °C |
|
Sample temperature: |
15 °C |
|
Injection volume: |
45 µL |
|
Mobile phase: |
A: Water with 0.1% formic acid B: Methanol with 0.1% formic acid |
|
Wash solvents: |
Purge/Sample Wash: water/acetonitrile 80:20 Seal Wash: water/acetonitrile 80:20 |
|
UV detection: |
210–450 nm, derived at 230 nm, sampling rate: 10 pts/sec |
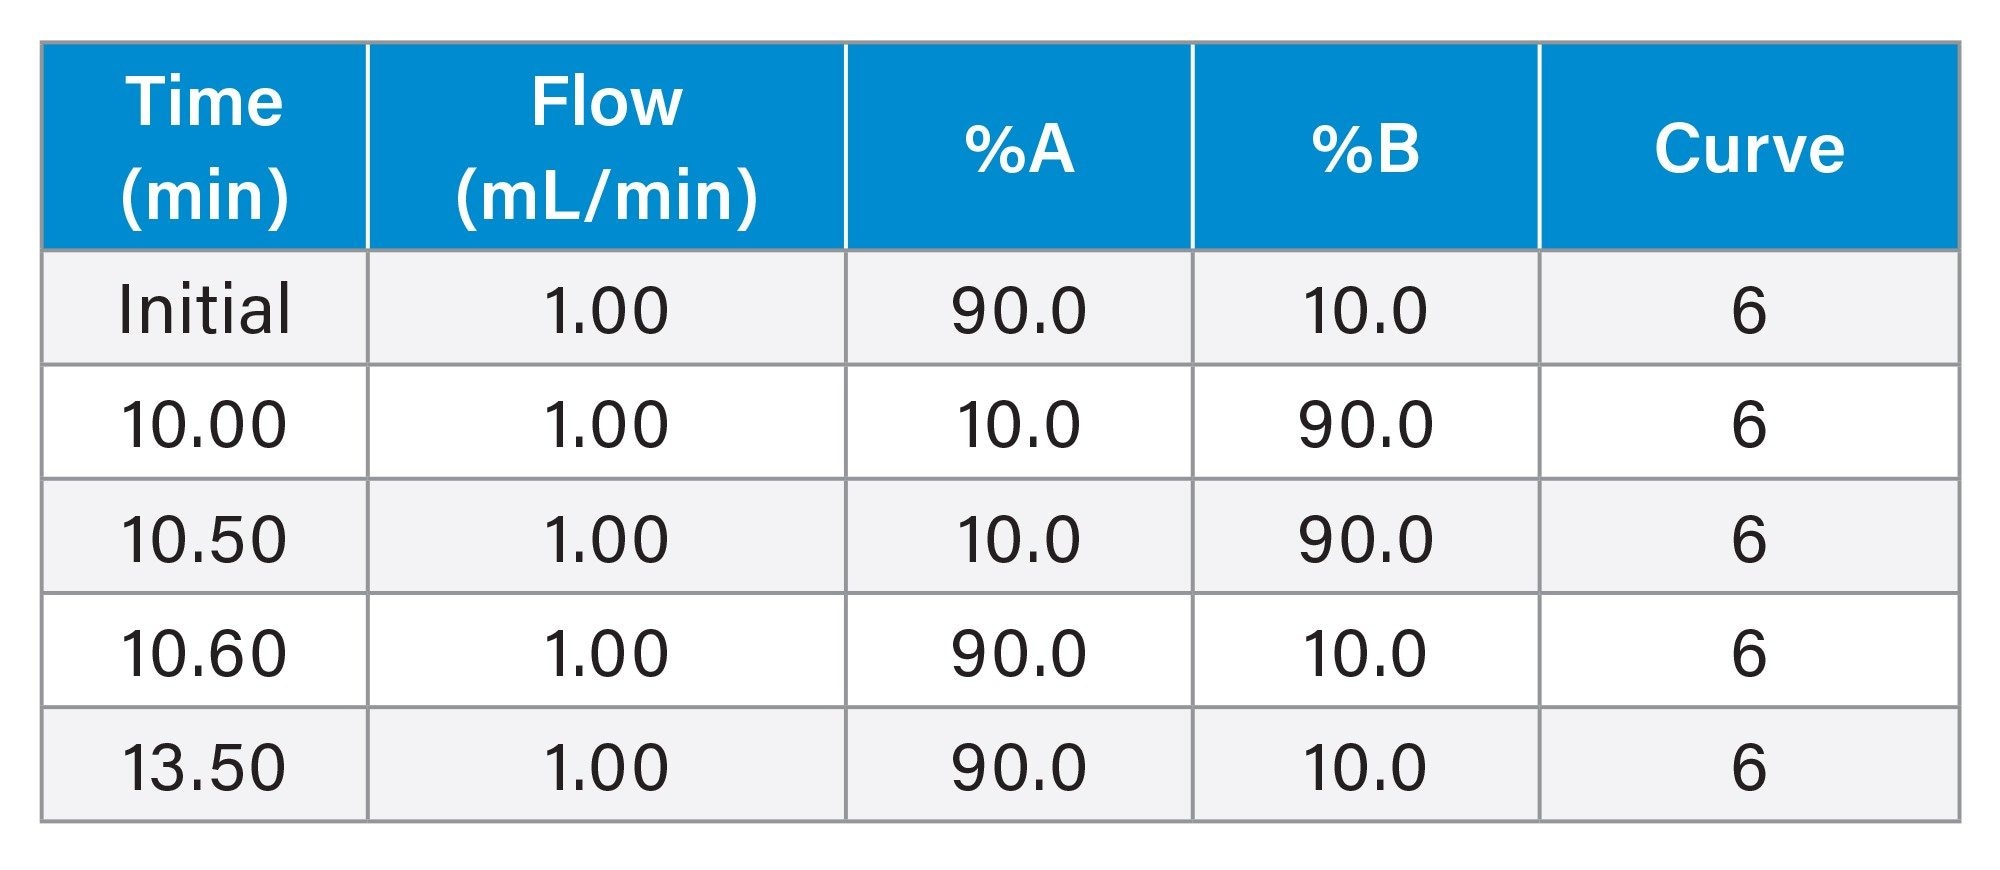
Gradient Table
MS Conditions
|
MS system: |
ACQUITY QDa II Mass Detector |
|
Ionization mode: |
ESI+ |
|
Acquisition range: |
85-350 m/z |
|
Capillary voltage: |
0.8 kV (+) |
|
Cone voltage: |
10 V |
|
Probe temperature |
450 °C |
|
Data: |
Centroid |
Isocratic Solvent Manager (ISM) Conditions
Makeup solvent: 50:50 water/acetonitrile with 0.1% formic acid
Flow rate: 0.5 mL/min, with 5:1 split and dilute ratio
Data Management
|
Data acquisition and control software: |
MassLynx™ version 4.2 SCN1049 |
|
MassLynx application manager: |
FractionLynx™ |
Method for Analysis of Collected Fractions
|
LC system: |
Arc Premier System with Quaternary Solvent Manager (QSM-R) and Flow-Through Needle (FTN-R) 2998 PDA Detector and ACQUITY QDa II Mass Detector |
|
Column: |
XSelect Premier HSS T3 Column, 4.6 mm ID x 100 mm, 2.5 µm (p/n: 186009851) |
|
Column temperature: |
30 °C |
|
Mobile phase: |
A: Water with 0.1% formic acid B: Methanol with 0.1% formic acid |
|
Flow rate: |
1.2 mL/min |
|
Separation: |
Gradient elution |
|
UV detection: |
210–450 nm, derived at 230 nm, sampling rate: 10 pts/sec |
|
MS detection: |
Same as in method for fraction collection |
|
Chromatography data software (CDS): |
Empower™ Chromatography Data System (CDS) |
Results and Discussion
In a purification workflow, the goal is to achieve high purity materials through efficient fraction collection. This starts with the development of a robust chromatographic method capable of separating the target compounds from other sample components. The purity of the collected fractions is generally verified using an orthogonal column chemistry to reduce the risk of missing co-eluting peaks.
For the analysis of propranolol and related impurities, chromatographic separation was carried out using a 100 mm XSelect Premier CSH C18 Column with 4.6 mm ID (Figure 1). The analysis was run on an Arc Premier System connected to a WFM-A Fraction Collector and two detectors: a PDA Detector and an ACQUITY QDa II Mass Detector. Both the PDA and mass data were acquired simultaneously for each injection. With the WFM-A in injection mode, the system was instructed to make sample injections only, without collecting fractions. This data acquisition facilitated an assessment of the chromatographic resolution and accurate identification of the target sample components. Subsequently, with the fraction collection enabled, the WFM-A was used to isolate N-nitroso-propranolol and other low-level impurities of propranolol. The mass spectral data facilitated identification of the unknown components and spectral peak purity verification of the collected fractions.

N-Nitroso-Propranolol: Isolation and Fraction Analysis
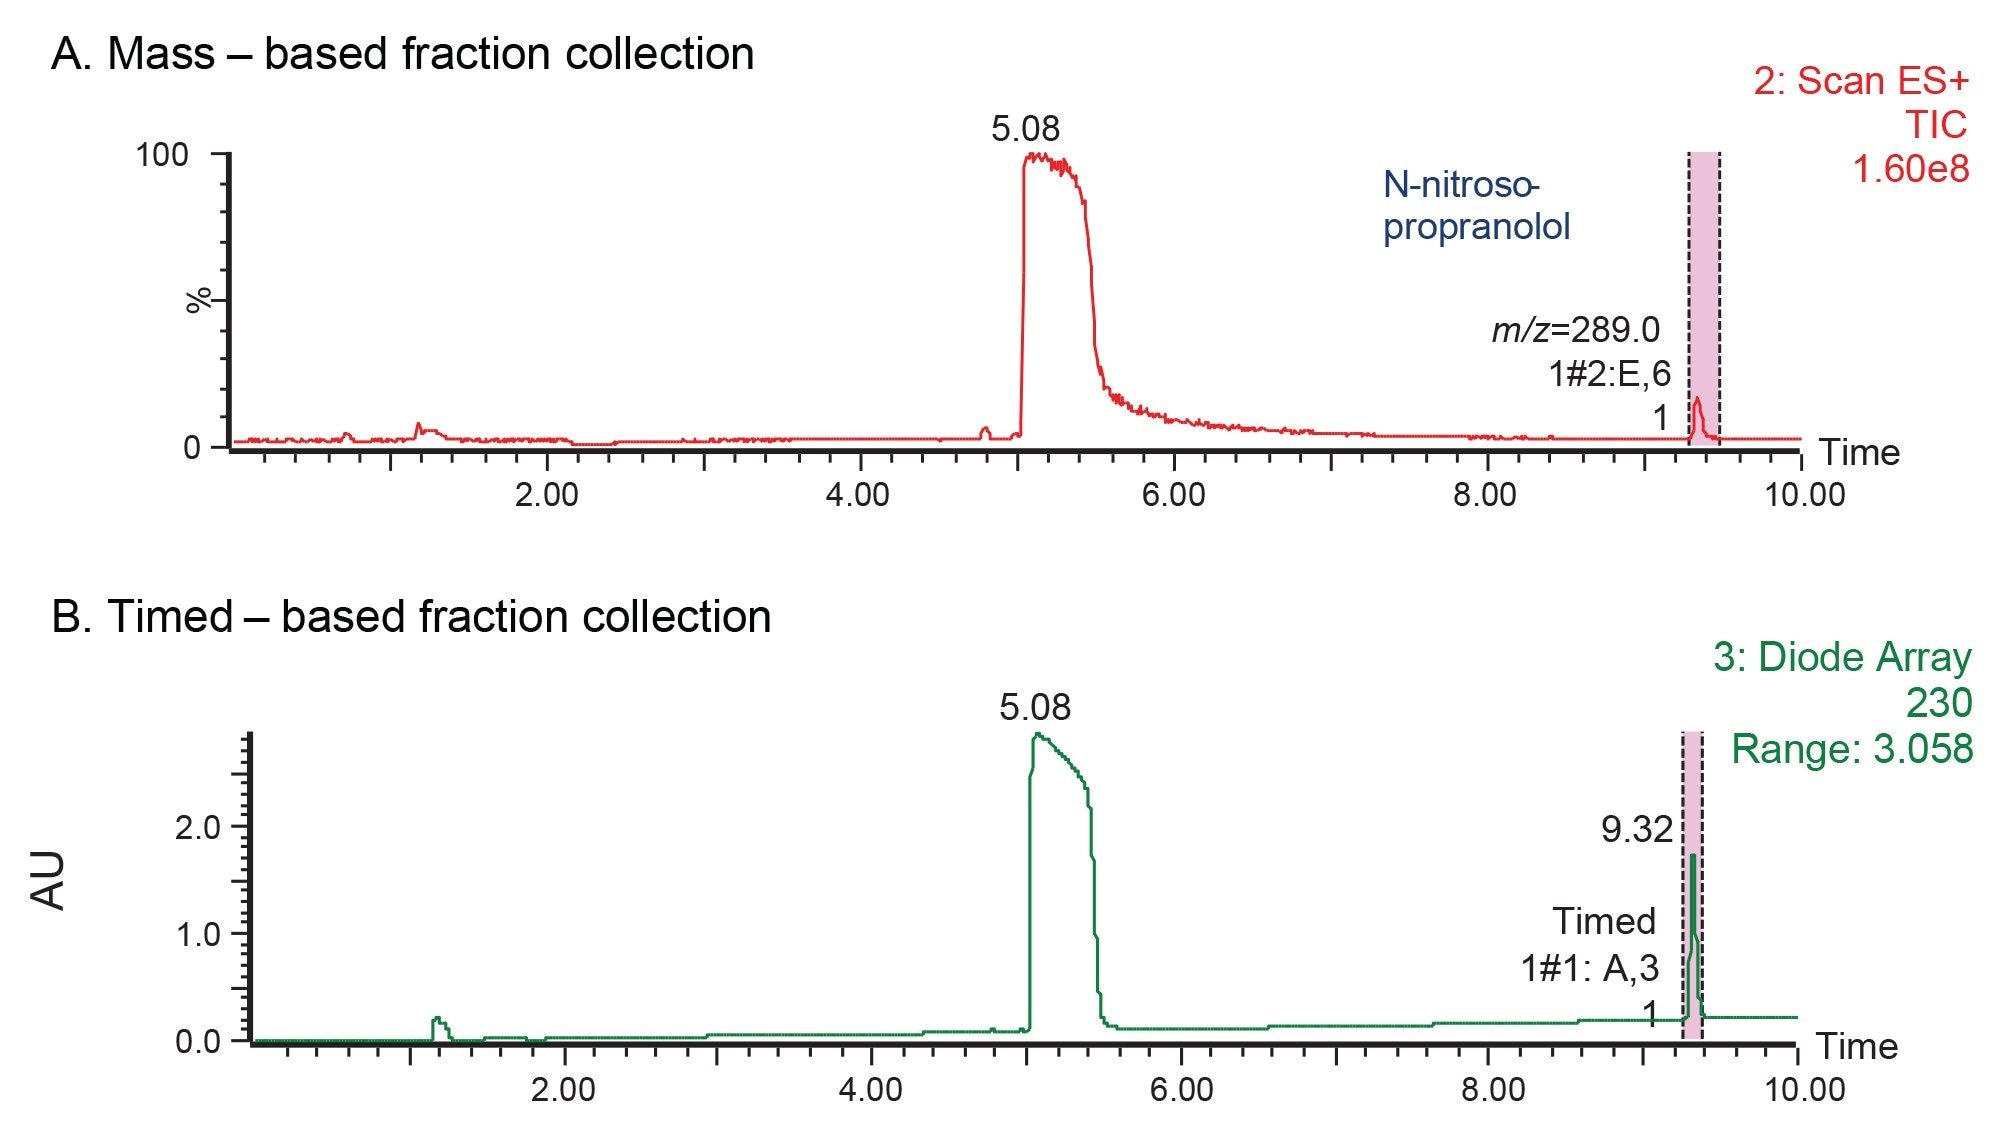
The chromatographic data acquired using the WFM-A System showed excellent resolution between propranolol API and N-nitroso-propranolol peaks (Figure 1). The detected mass for N-nitroso-propranolol impurity was found to be [M+H]+ with an m/z of 289. The MS-triggered and time-based fraction collection were applied to isolate the impurity peak (Figure 2).
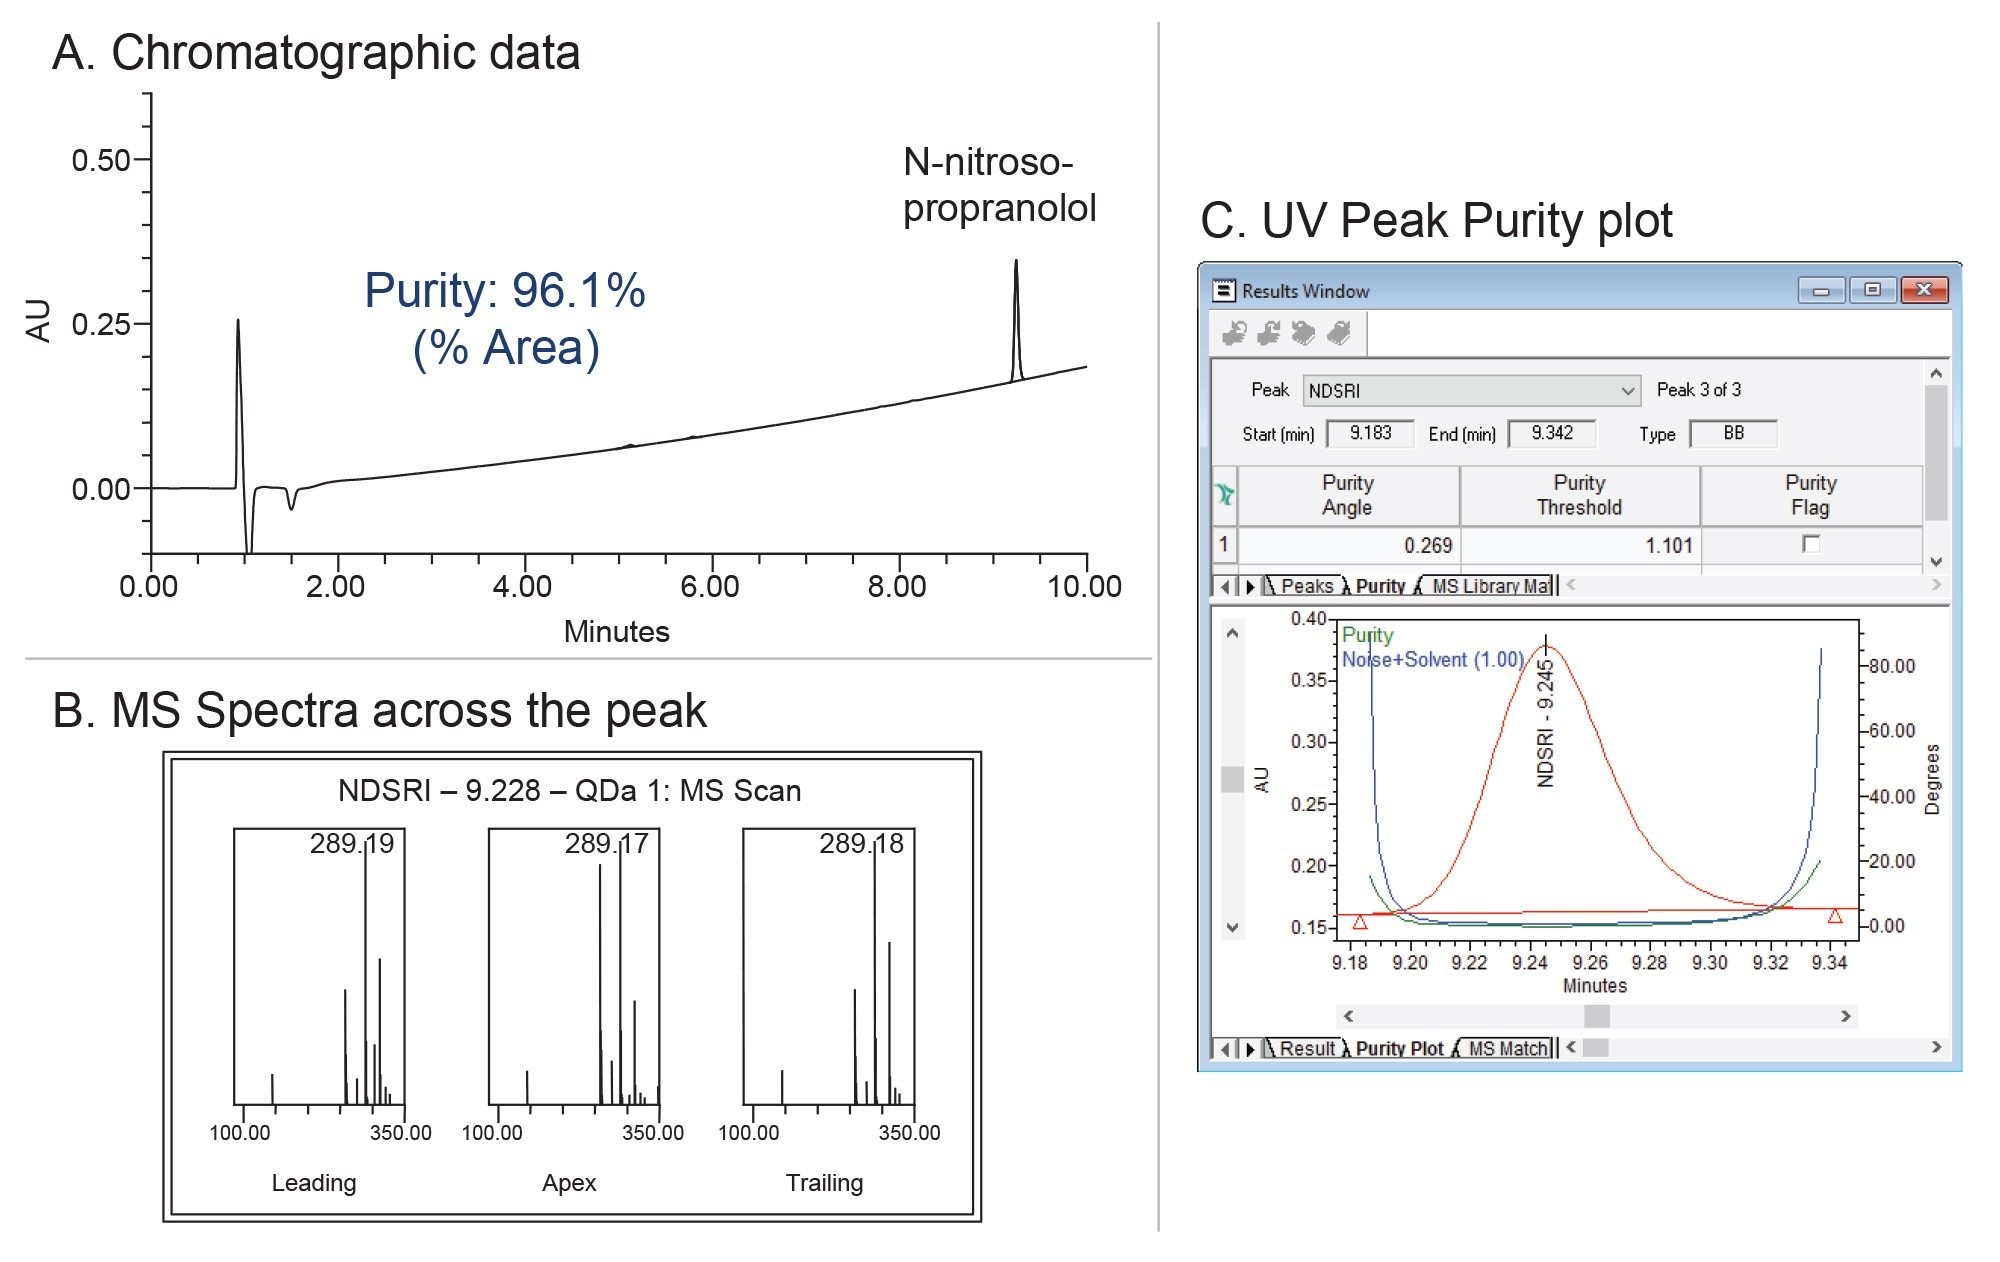
Purity verification of the fractions collected via MS-trigger was performed on an Arc Premier System controlled by the Empower Software (Figure 3). Both the chromatographic and spectral purity of the N-nitroso-propranolol were evaluated. A chromatographic purity of 96.1% was observed (Figure 3A). Additionally, the spectral analysis of the mass and UV data confirmed that the N-nitroso-propranolol peak is spectrally homogeneous, showing no evidence of coeluting impurities.
Focused Gradient: Isolation of Low-Level Impurities
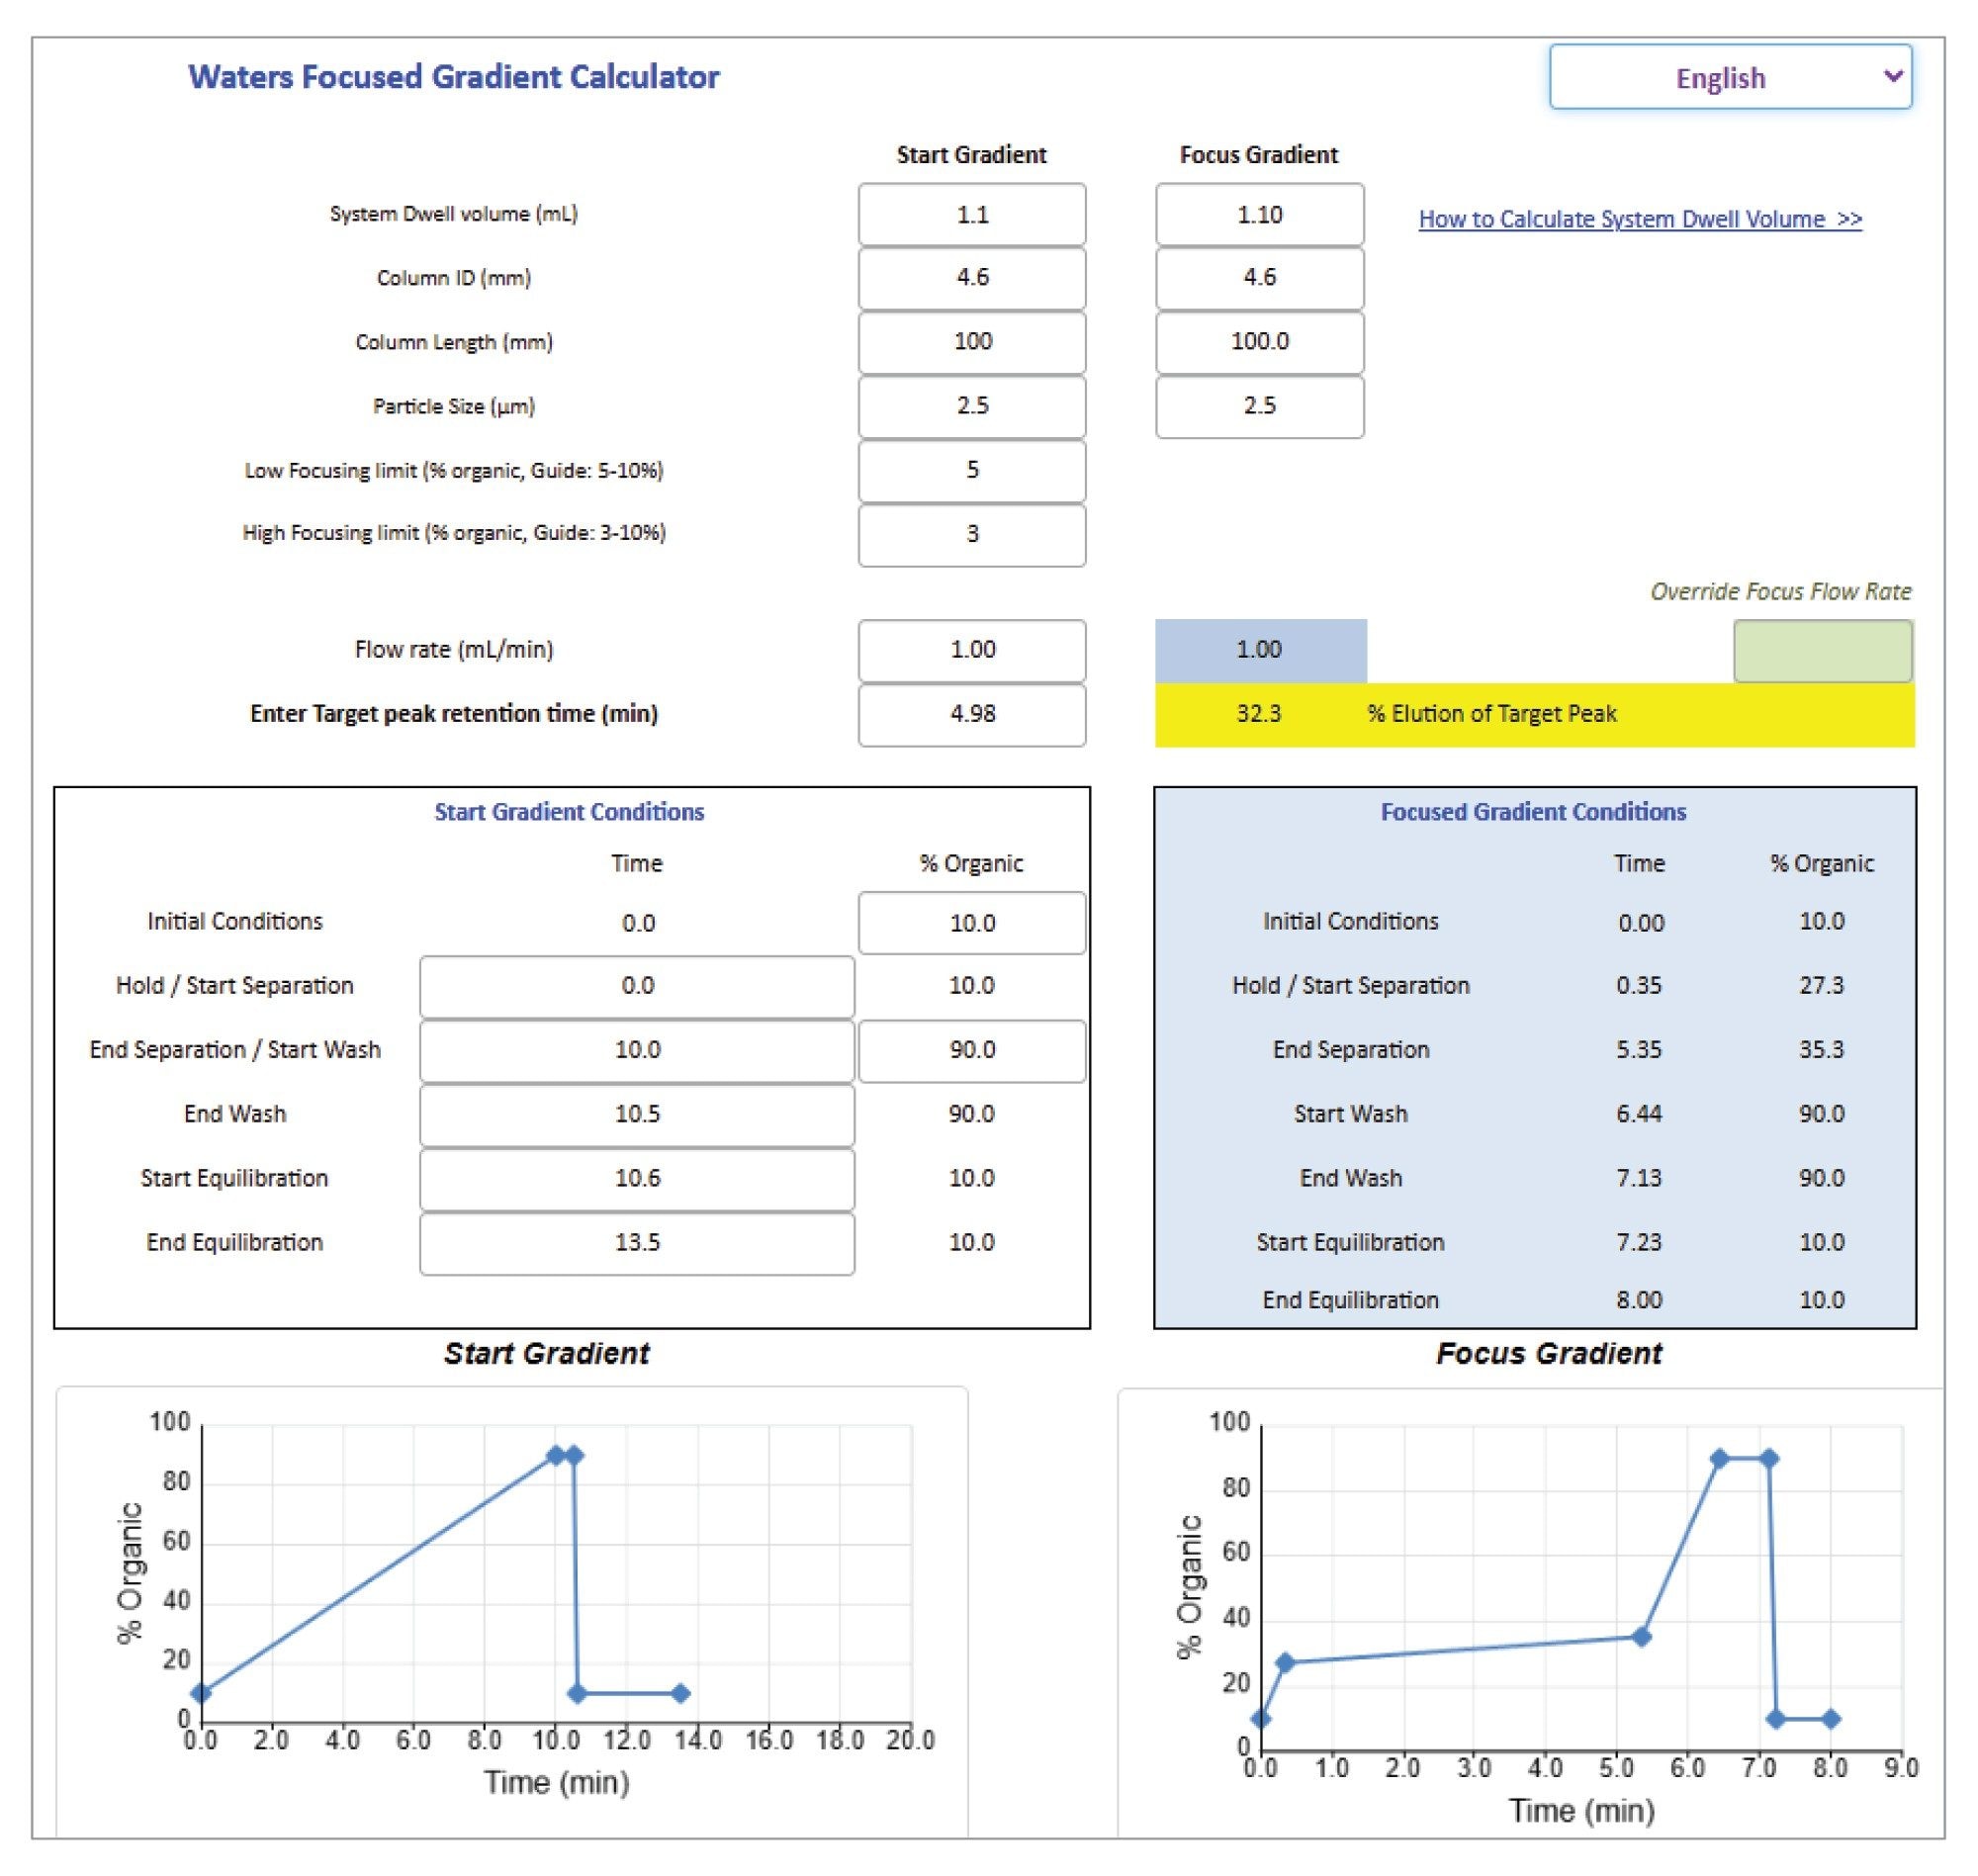
Focused gradients can be used to decrease the gradient slope for a targeted portion of the chromatographic region, in order to increase the resolution for closely eluting peaks without increasing the total run time.8–9 A focused gradient calculator assists in determining the focus gradient conditions for preparative analysis.10 These gradients are created based on the relationship between the percent organic composition and analyte retention times, while accounting for system dwell volume.
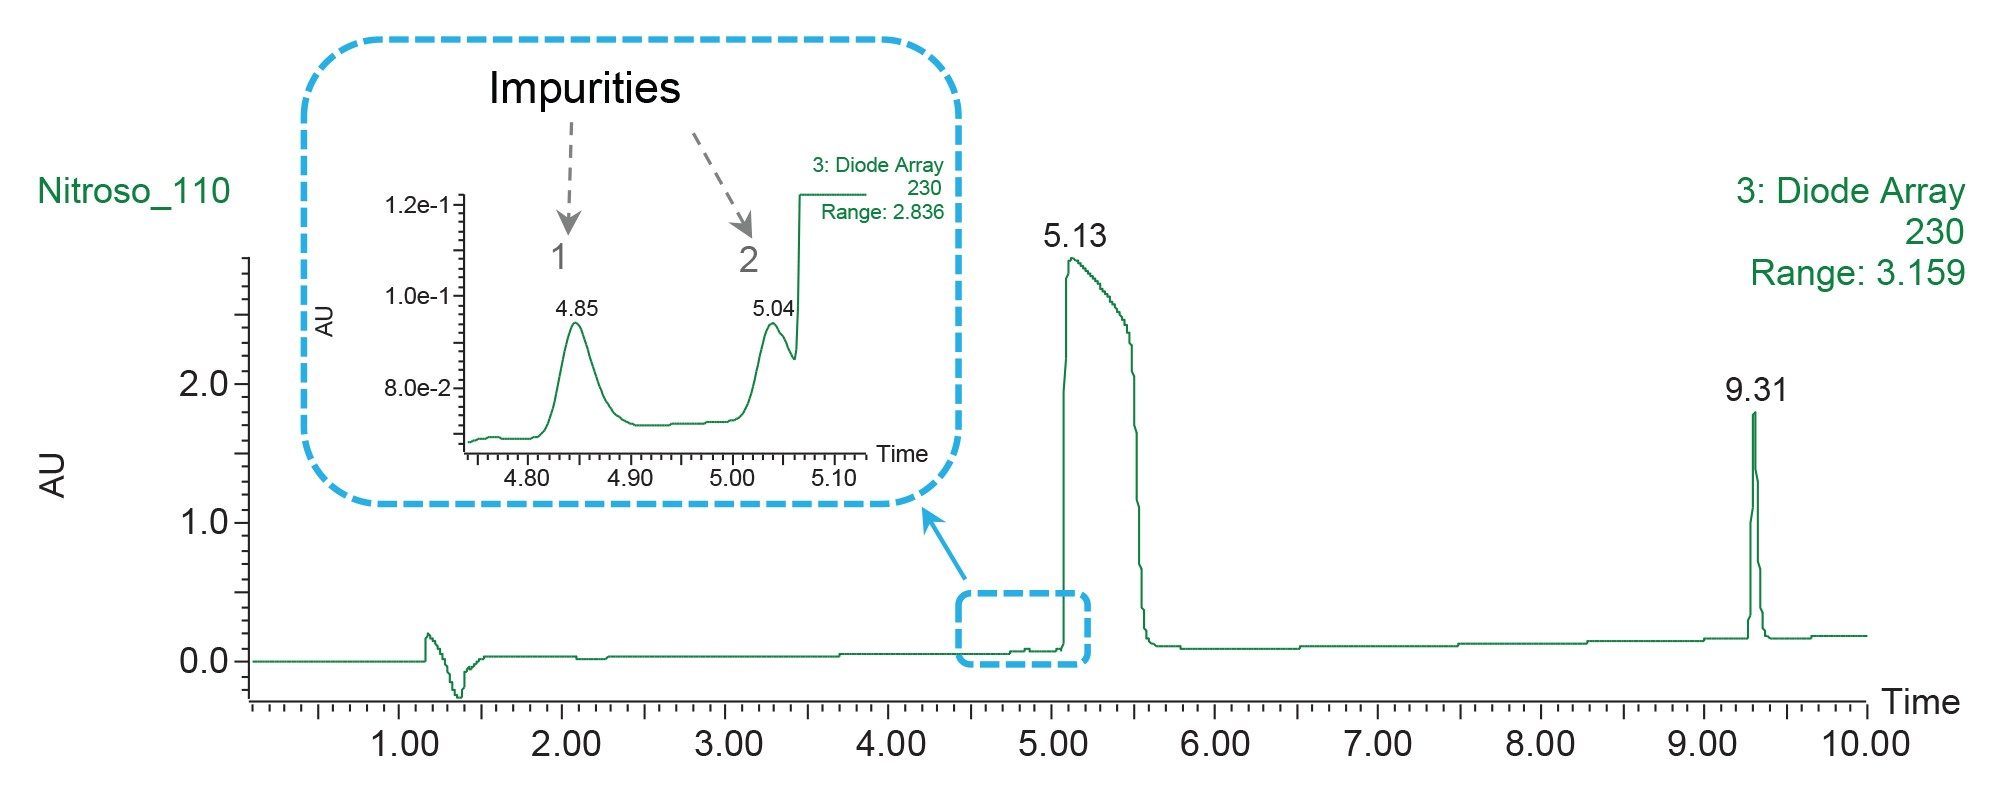
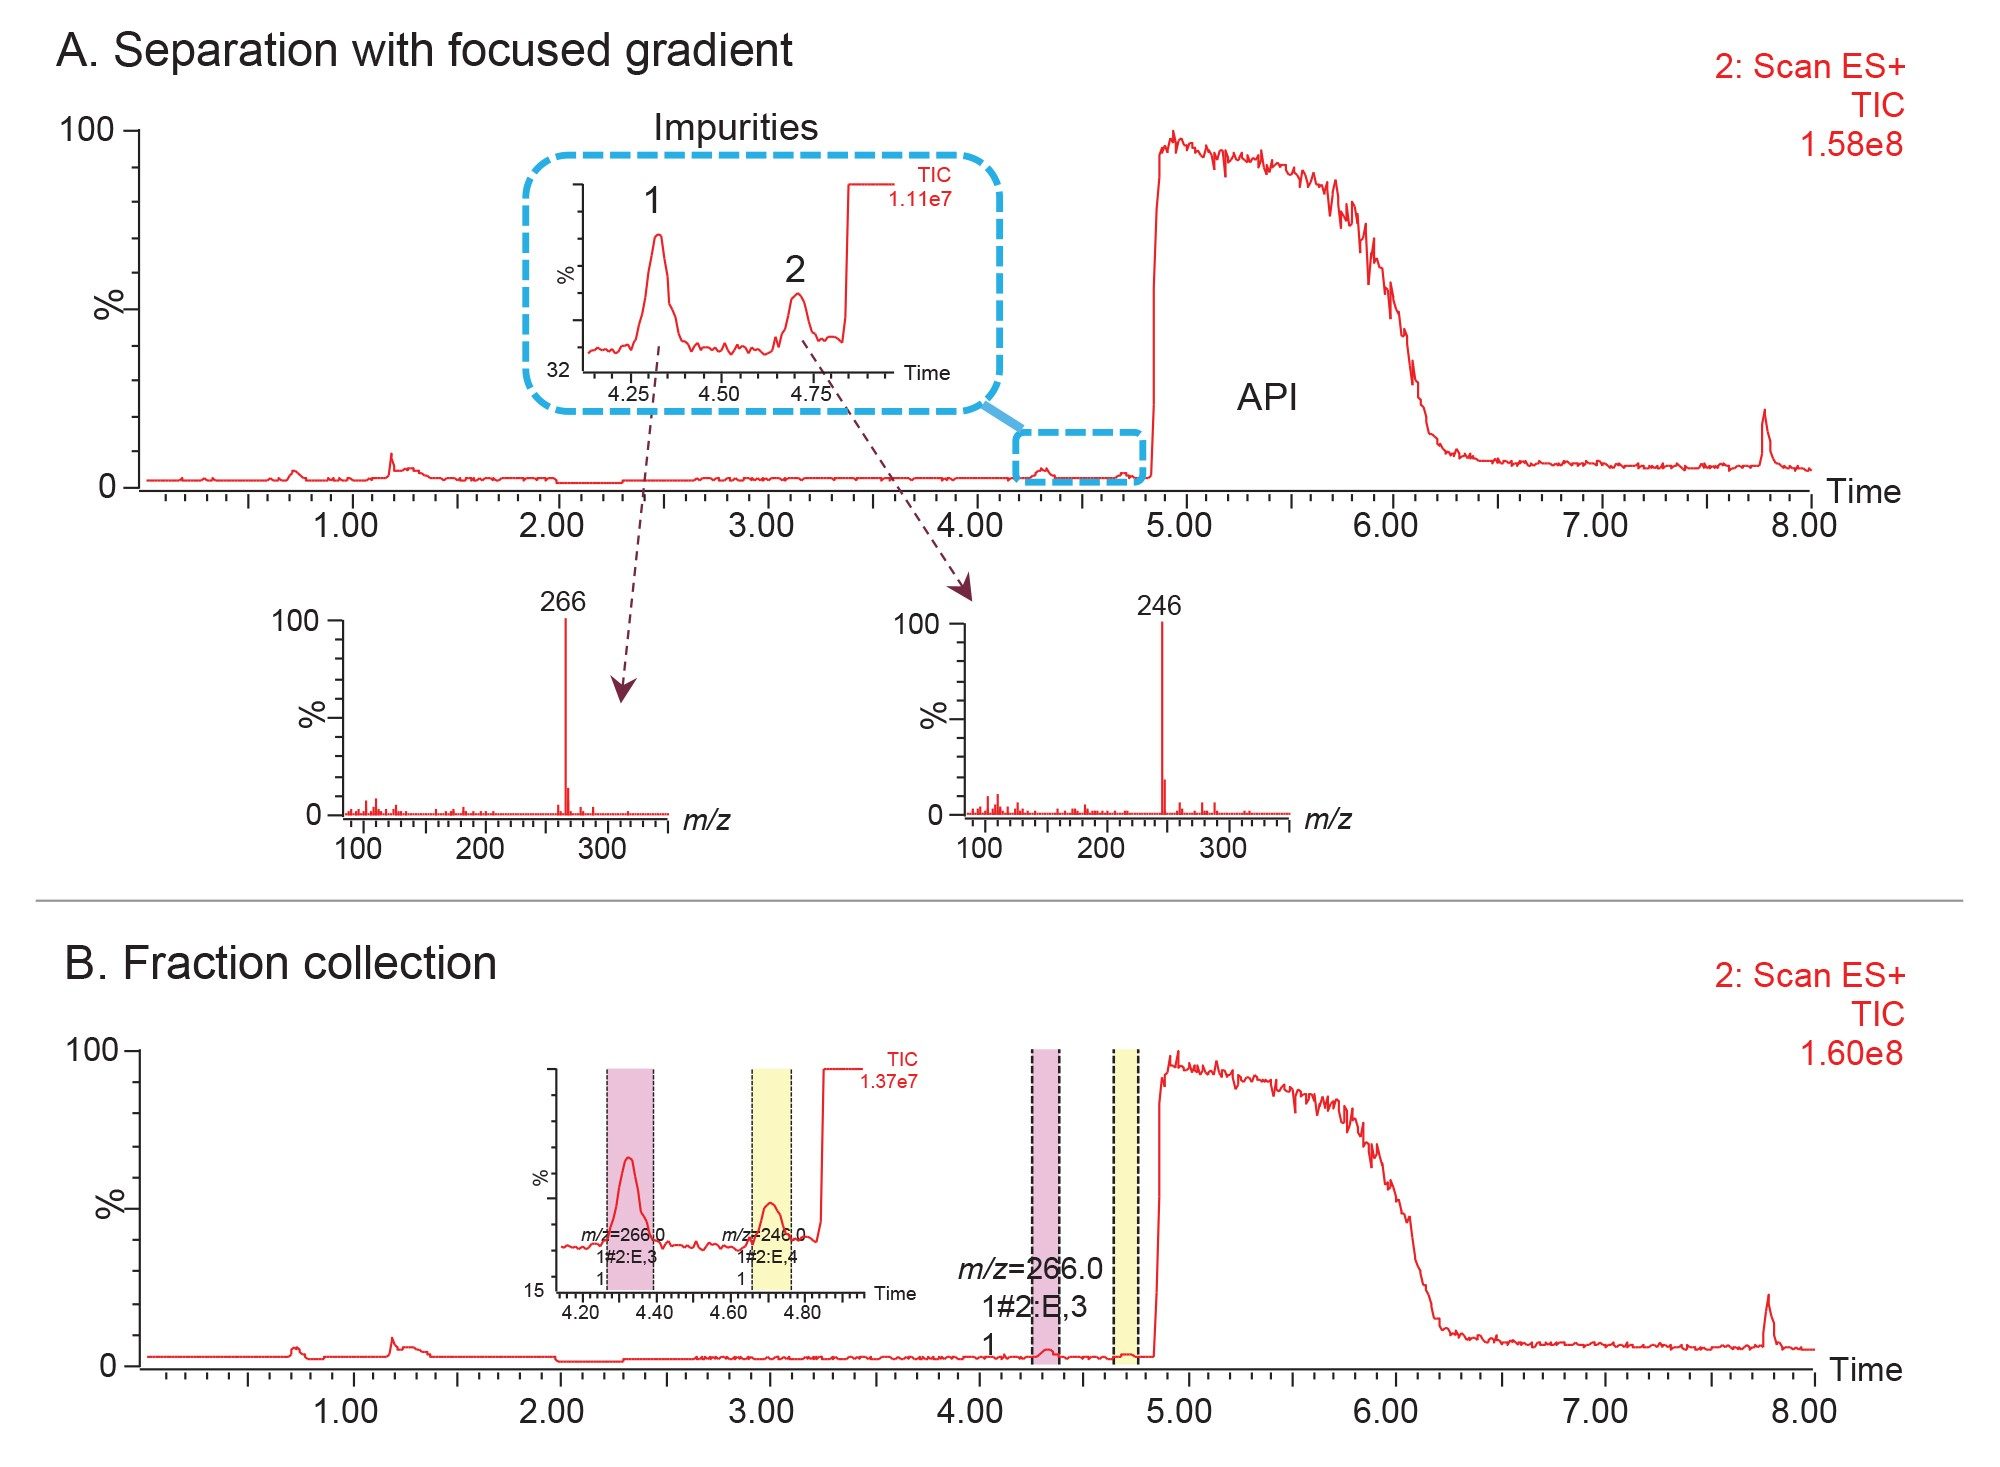
In this study of propranolol impurities, the chromatographic data showed presence of additional low-level impurities eluting before the propranolol API peak (Figure 4). While the method successfully separated the first impurity, the second impurity coeluted with the API. A focused gradient was applied to optimize the resolution between these two peaks. Using a calculator, the focused gradient conditions were determined to separate the impurity coeluting with the API (Figure 5). The method conditions for the start gradient were entered into the calculator, including column dimensions, focusing limits, flow rate, start and end of the separation. The retention of the target compound specified in the calculator was used to calculate the mobile phase composition in a focused gradient in order to improve the separation. When the shallow slope ended, a high percentage of organic was applied as a column washing step.
Performing the analysis using a focused gradient with a shallow slope provided a base-line separation of the impurity from the API peak (Figure 6). The first impurity peak also eluted under the focused gradient conditions. Optimizing the resolution for the target sample components by applying a focused gradient enabled effective collection of the low-level impurities (Figure 6B).
Conclusion
High purity fraction collection of N-nitroso-propranolol and the low-level impurities of propranolol API was successfully achieved using the WFM-A connected to an Arc Premier System. The specificity of the mass-directed trigger performed using the ACQUITY QDa II Mass Detector enabled efficient fraction collection of the target impurities. Applying a focused gradient with shallow slope improved the resolution between coeluting peaks without extending the overall run time, allowing for effective isolation of low-level impurities. The purity of the collection was successfully verified using orthogonal column chemistry, verifying the success of the purification strategy.
The workflow and tools described in this application note can be applied for the isolation and purification of pharmaceutical impurities and degradation products that may arise during development, manufacturing, or storage of drug products. The collection of pure factions yields high purity materials that can be used for further characterization, identification, and as reference materials.
References
- Răzvan C. Cioc, Ciarán Joyce, Monika Mayr, Robert N. Bream. Formation of N-Nitrosamine Drug Substance Related Impurities in Medicines: A Regulatory Perspective on Risk Factors and Mitigation Strategies. Organic Process Research & Development, 27:10, 2003.
- Nakka S, Muchakayala SK, Surya SBM. Strategic Approaches to Elevate Quality and Sustainability of NDSRIs Method Development: Synthesis and Simultaneous Quantification Study of Multiple Tamsulosin NDSRIs. Microchemical Journal, 214:114065, 2025.
- Li X, Le Y, Seo JE, Guo X, Li Y, Chen S, Mittelstaedt RA, Moore N, Guerrero S, Sims A, King ST, Atrakchi AH, McGovern TJ, Davis-Bruno KL, Keire Da, Elespuru RK, Heflich RH, Mei N. Revisiting the Mutagenicity and Genotoxicity of N-nitroso-Propranolol in Bacterial and Human in Vitro Assays. Regulatory Toxicology and Pharmacology, 141:105410, 2023.
- International Conference on Harmonization, ICH Q3A(R2), Impurities in New Drugs Substances, 2006.
- International Conference on Harmonization, ICH Q3B(R2), Impurities in New Drug Products, 2006.
- Guidance for Industry Q3A Impurities in New Drug Substances, U.S. Department of Health and Human Services Food and Drug Administration Center for Drug Evaluation and Research (CDER) Center for Biologics Evaluation and Research (CBER), June 2008.
- Prajapati PB, Wankhed N, Dr. Mehta PJ. A Review on Multi Approaches for Impurity Isolation and its Characterization. Journal of Drug Delivery & Therapeutics. 9(4-A):793-802, 2019.
- Jablonski J, Wheat TE, Diehl DM. Developing Focused Gradients for Isolation and Purification. Waters Application Note. 720002955, 2009.
- Cleary R, Lefebvre P. The Impact of Focused Gradients on the Purification Process. Waters Application Note. 720002284, 2007.
- Waters Focused Gradient Calculator:
https://www.waters.com/nextgen/us/en/shop/product-selection-tools- resources/preparative-obd-columns-calculator.html.
720009120, October 2025