• Application Note

Direct Ionization Technique as a Rapid Screening Tool for Reaction Monitoring

Direct Ionization Technique as a Rapid Screening Tool for Reaction Monitoring

  • Chris Henry
  • Paul D. Rainville
  • Waters Corporation

Abstract

Reaction monitoring is a critical step in the synthesis of new drug candidates. Multiple analyses can be required to assess the progress of a chemical reaction under a variety of different conditions e.g. different solvents or catalysts.

A rapid turnaround in sample analysis for reaction monitoring allows for rapid decision making and increased laboratory efficiency.

Benefits

  • Easy access to nominal mass data for increased result specificity
  • Rapid decision making on reaction progress 
  • Rapid analysis for compounds that are time/moisture labile
  • The RADIAN ASAP is simple to use and has a small footprint that can easily be integrated into existing workflows

Introduction

The goal of Medicinal Chemistry is to design and synthesize lead molecules that will successfully advance through the drug development process and ultimately become pharmaceuticals. In the process of SAR optimization, hundreds of compounds are synthesized; hence a multitude of reactions are performed. It is very important for chemists to get an understanding of their reactions so that they can make informed and timely decisions. Knowing what is happening in real-time can help chemists to design and control the reactions in the process vessels – increasing product yields and purity and reducing side reactions and by-products – reducing the costs and risks associated with unexpected processes.1

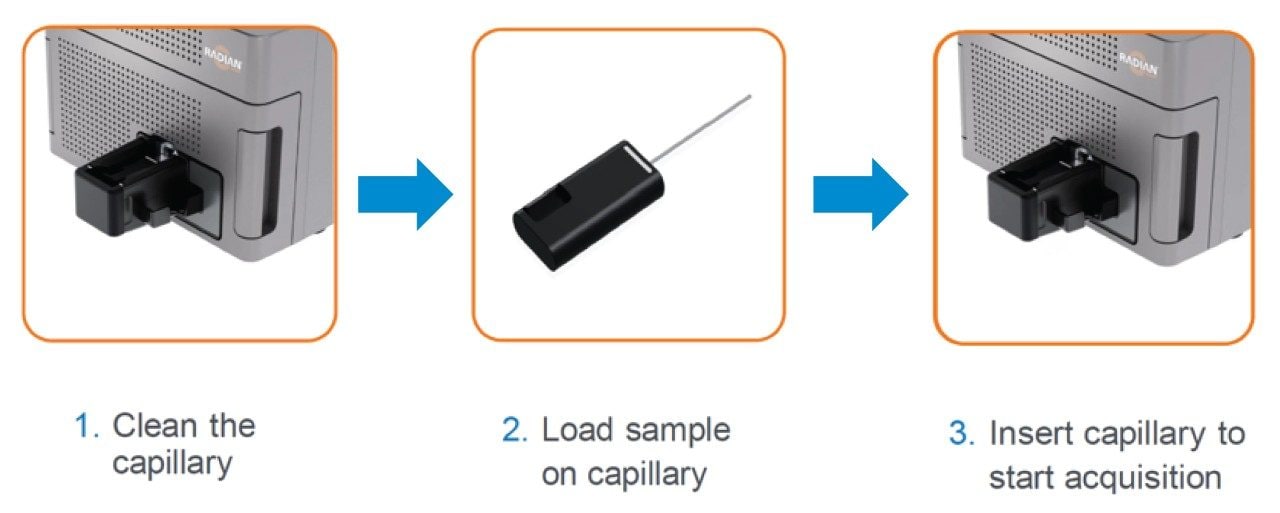
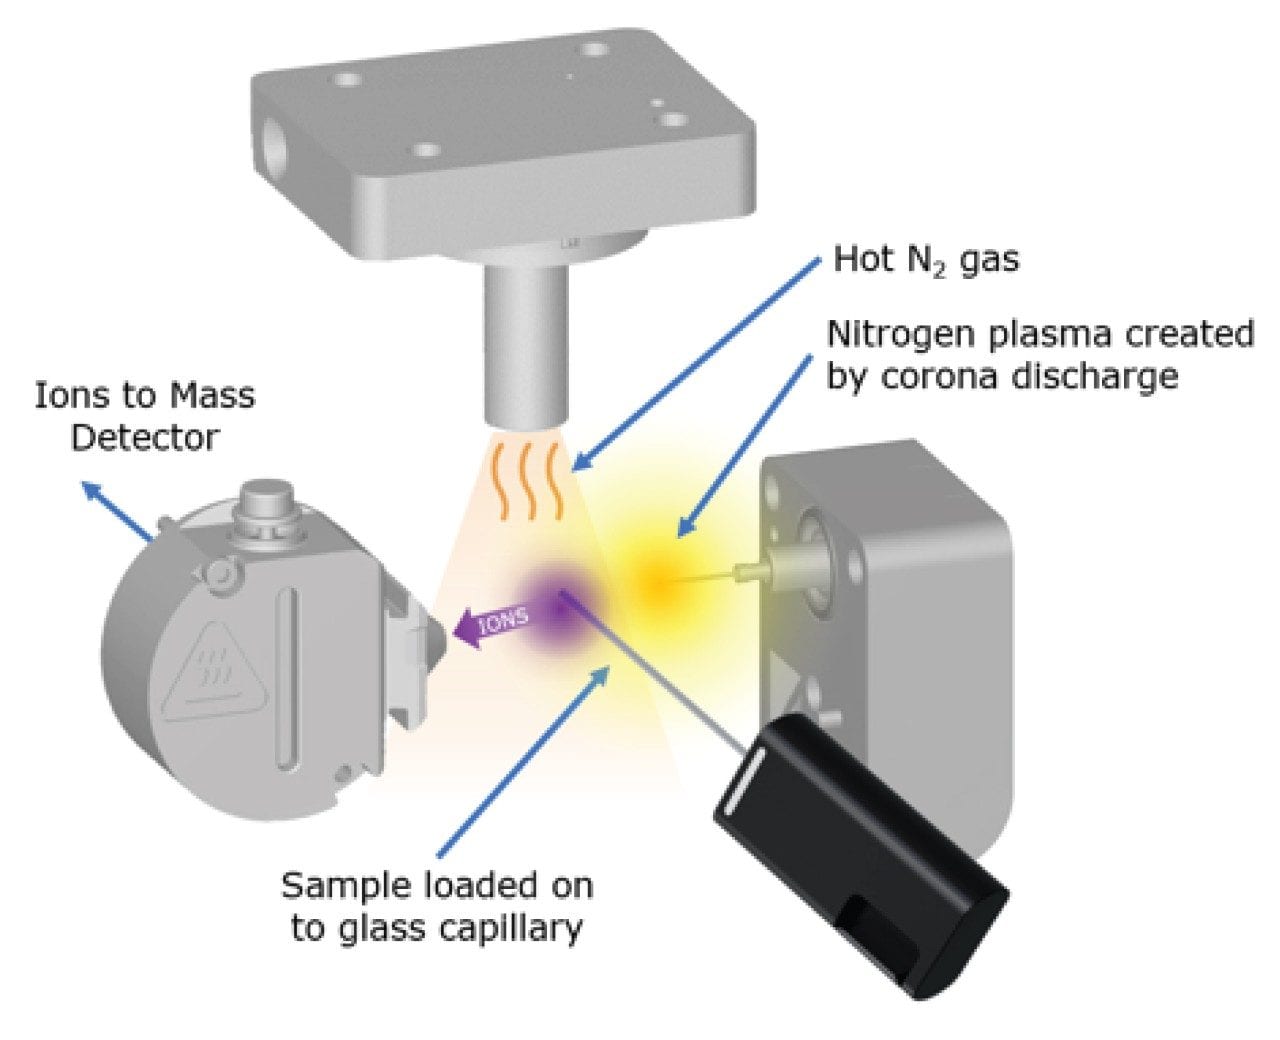
Waters has recently introduced the RADIAN ASAP (Rapid Direct Analysis Atmospheric Pressure Solid Analysis Probe) which is a dedicated nominal mass detector for the direct analysis of solid and liquid samples with little or no sample preparation.

With the introduction of the RADIAN ASAP samples can be taken directly from reaction vessels and introduced into the mass detector with little or no sample preparation required, giving the user a near instant result for rapid decision making on the progress of a reaction.

Combining a proven and robust single quadrupole detector with well-established ASAP direct sample analysis2 allows medicinal chemists with a diverse range of analytical expertise to rapidly access nominal mass data during drug synthesis reactions.

Within this body of work, we demonstrate a rapid screening workflow for the direct analysis of a reaction monitoring workflow for the synthesis of the beta blocker medication atenolol.

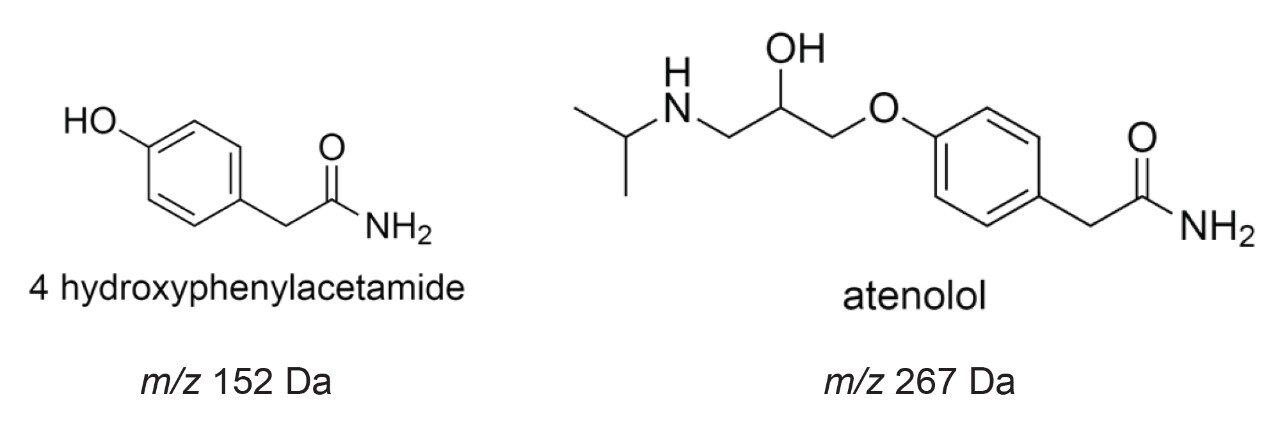
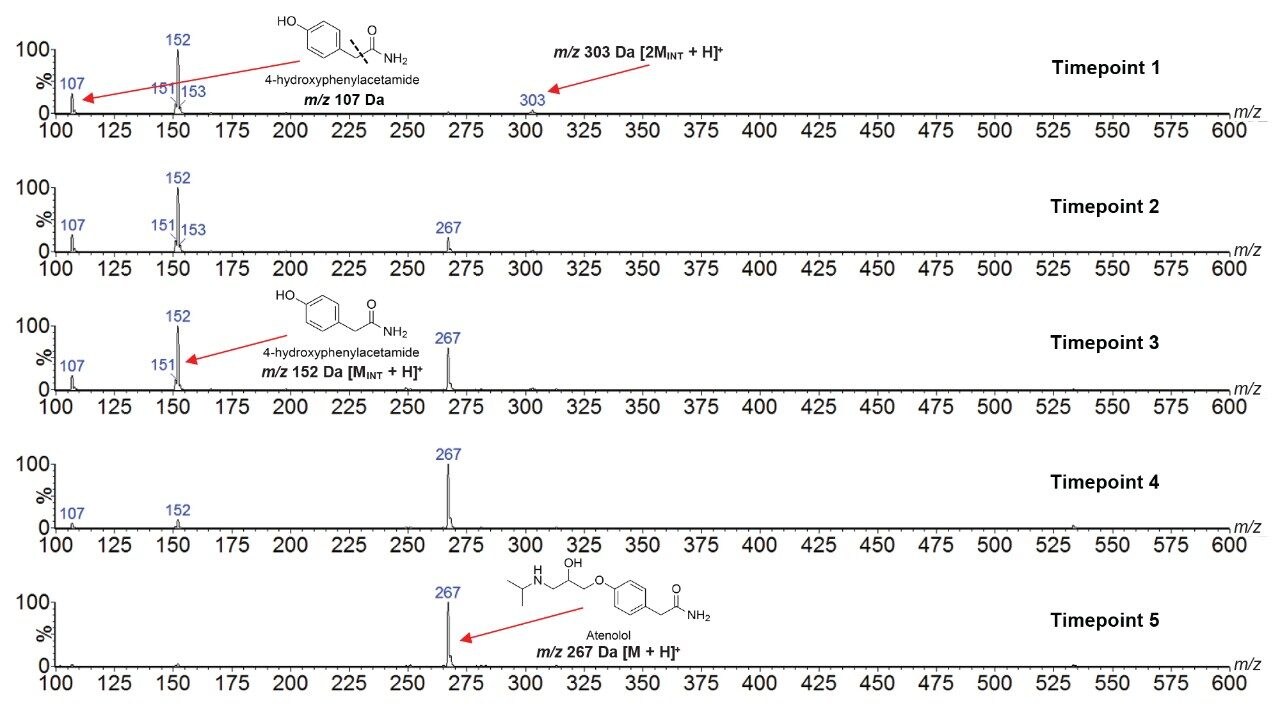
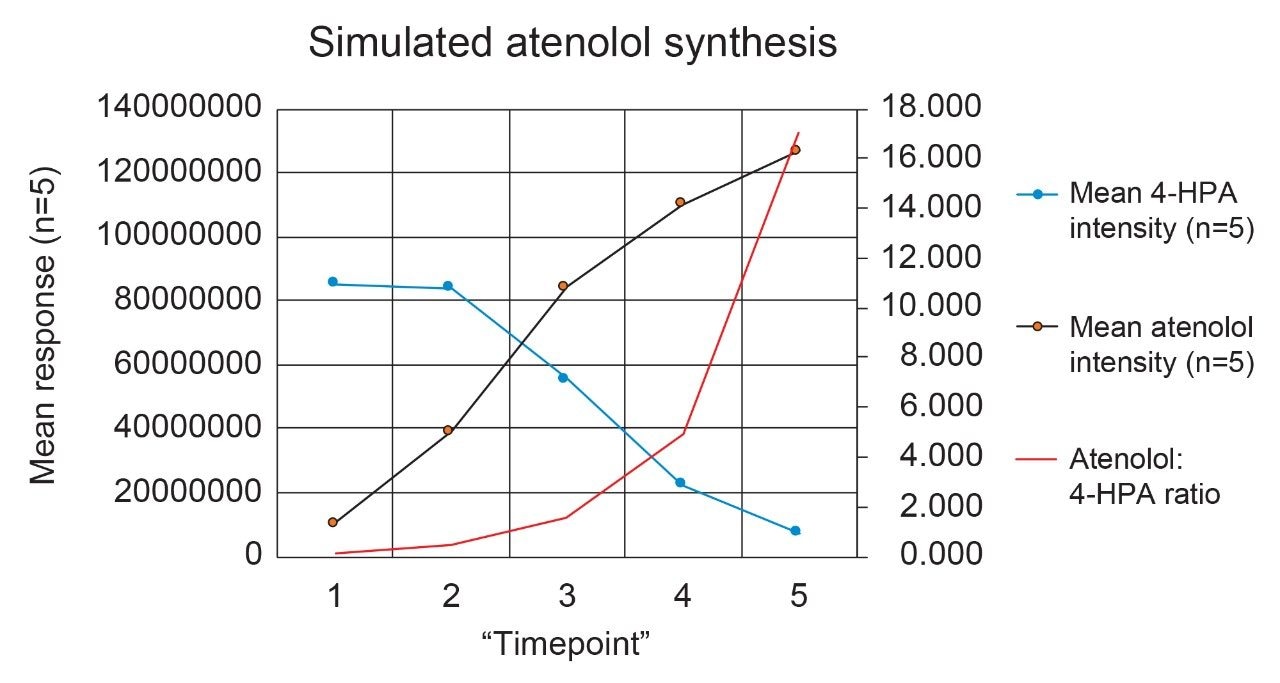
Samples were prepared to simulate the conversion of the intermediate 4-hydroxyphenylacetamide (4-HPA) to atenolol.

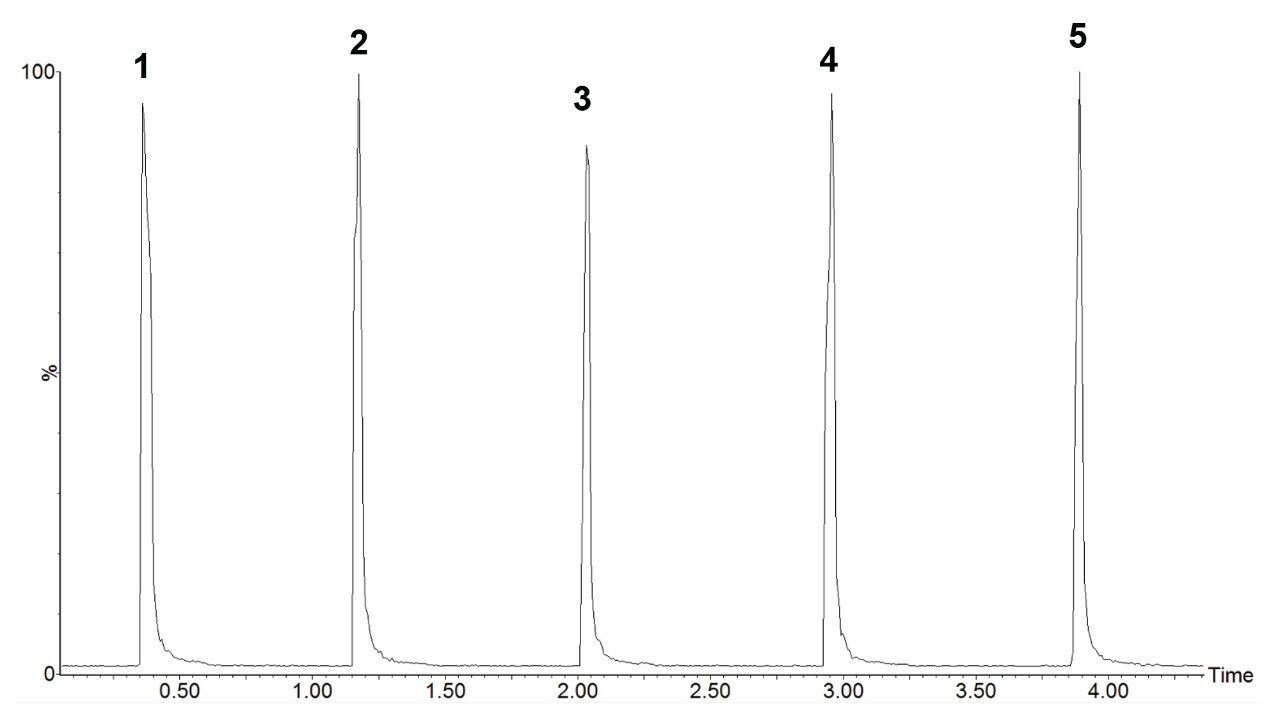
The RADIAN ASAP successfully detected both analytes showing the reduction in 4-HPA (m/z 152 Da) concomitant with the increase in atenolol (m/z 267 Da) response (Figure 1).

Figure 1. Structures of 4-HPA, 4-HPAA, and atenolol. 

Experimental

Sample Description

Samples of atenolol and (4-HPA) were prepared to simulate the progress of atenolol synthesis over five timepoints. 

To demonstrate reproducibility of results, five samples of each ‘timepoint’ were analyzed to evaluate the %RSD (Relative Standard Deviation) of the individual response of each analyte, and the ratio of atenolol: 4-HPA which reflects reaction progress. 

All standards were sourced from Sigma Aldrich chemicals (Poole, Dorset, UK).

RADIAN ASAP Operation

For each replicate, a glass capillary was taken and, prior to sampling, was inserted into the RADIAN ASAP and cleaned using the ‘Bakeout’ feature in MassLynx (Figure 2) which, when selected automatically increases the flow gas temperature to 600 °C for a fixed time period of 1minute to remove any contaminant which could interfere with sample results. Once this process is complete the software informs the user that the system is ready for sample analysis.

Figure 2. Instrument Console Page with Bakeout feature (highlighted in red). 

Once the bakeout procedure is complete the glass rod was removed and allowed to cool for approximately 10 seconds before being dipped into the first sample and then introduced into the RADIAN ASAP (Figure 3) before being removed. This procedure was carried out five times for each sample with a different glass capillary used for each sample following the bakeout procedure described above.   

Figure 3. Sample introduction for RADIAN ASAP. 

Instrument Conditions

Ionization mode:

ASAP+

Corona pin:

3 µA

Desolvation gas (N2) temperature:

500 °C

Desolvation gas (N2) flow:

3 L/min

Sampling cone:

10V

Acquisition mode:

Full scan (continuum)

Mass range:

100–600 Da

Scan speed:

2 Hz

Sampling technique:

Capillary dip

Data Management

MS software:

MassLynx 4.1

The ionization of samples using RADIAN ASAP (Figure 4) is achieved by introducing the sample into the corona discharge region on the glass rod. The sample is volatilized using a stream of heated nitrogen. The now gaseous analyte molecules are ionized by the N2 plasma. The gaseous analyte ions are guided into the instrument and analyzed by the single quadrupole mass detector.

Figure 4. Schematic of RADIAN ASAP Sample Ionization Process. 

There are two main mechanisms for APCI ionization as outlined by Horning3 et al in 1973.

The first is a charge transfer mechanism initiated by corona discharge ionization of the nitrogen in the source (Figure 5). This generates radical cations of nitrogen which can then undergo charge transfer with analyte molecules to generate radical cations of the analyte molecules.

This form of ionization is particularly useful for the analysis of non-polar compounds and will be more prevalent in source conditions without the presence of protic solvents.

Figure 5. Charge transfer. 

The second mechanism for ionization is by proton transfer (Figure 6).

This requires the presence of water or other solvent (such as methanol) which can act as a source of protons to form ionized solvent clusters as shown.

The ionization of the analyte then occurs by proton transfer which is the main ionization pathway associated with APCI in LC-MS.

In this experiment the latter mechanism is applicable as all samples are dissolved in methanol.

Figure 6. Proton transfer. 

Results and Discussion

The instrument was set up as described in ‘Instrument Conditions’. Samples were introduced to the RADIAN ASAP as described in ‘Experimental’ and ion intensities and ratios appraised directly from the MassLynx Software.

In practice rapid reaction monitoring samples would be taken singly to quickly assess reaction progress but here we have taken n=5 of each sample to demonstrate reproducibility of results.

The samples were introduced and the TIC (Total Ion Count) was acquired. An example TIC is given in Figure 7.

Figure 7. Example TIC. 

The spectra were extracted from the TIC for each simulated timepoint and clearly shows the reduction in 4-HPA (m/z 152Da) and the increase in atenolol (m/z 267Da), reflecting the relative concentrations of each compound within the samples (Figure 8). A potential fragment (m/z 107Da), and dimer (m/z 303Da) of 4-HPA was observed. The former as a result of in-source fragmentation and the latter an in-source reaction linked to high concentrations of 4-HPA.

Figure 8. Five timepoint comparison. 

Semi-quantitative analysis using ASAP has been achieved previously using an internal standard.4,5 As reaction monitoring is defined by the correlation of the reactant(s) and the product(s), it is possible for semi-quantitative monitoring to be carried out by measuring ratios between compounds of interest as they change over time.

The mean responses were plotted along with the mean response ratio of both analytes displaying (Figure 9). This provides a visualization of the changing intensities in each analyte with the line in red showing a clear upward trend in atenolol relative intensity.

Figure 9. Graphical representation 4 HPA : Atenolol. 

Reproducibility

As mentioned previously the samples were measured over five replicates to provide assurance of method reproducibility.

Any reaction monitoring method that is carried out routinely would be subject to some elements of validation to ensure results were reproducible.

Table 1 shows the individual intensities of both analytes for five replicates over all the samples prepared. RSDs for the mean ratio of each sample range between 4.8 and 15.8.

This demonstrates very good variability given that the sample is manually introduced to the instrument and no chromatographic separation is required.

The %RSD of 15.8% was observed at the lowest concentration of atenolol. Atenolol exhibited higher ionization intensity than 4-HPA in these experiments which could have contributed higher experimental variation at lower concentrations.

Table 1. Raw data. 

Conclusion

The RADIAN ASAP has demonstrated its potential to be a valuable tool for reaction monitoring. The simulated progression of atenolol synthesis was performed rapidly without the need for chromatographic separation while providing nominal mass data for near instant mass confirmation.

With its small footprint and ease of use, the RADIAN ASAP could be deployed in a variety of analytical settings for expert and non-expert users alike.

References

  1. What is Reaction Monitoring? Chromatography Today. July 21, 2015.
  2. McEwen CN, McKay RG, Larsen BS. Analysis of Solids, liquids, and Biological Tissues Using Solids Probe Introduction at Atmospheric Pressure on Commercial LC-MS Instruments. Anal. Chem. 2005, 77, 7826–7831.
  3. Horning EC, Horning MG, Carroll DI, Dzidic I, Stillwell RN. New Picogram Detection System Based on a Mass Spectrometer With an External Ionization Source at Atmospheric Pressure. Anal. Chem, 1973, 45, 936–943).
  4. Xiao X, Miller LL, Parchert K J, Hayes D, Hochrein J M. Atmospheric Solids Analysis Probe Mass Spectrometry for the Rapid Identification of Pollens and Semi-Quantification of Flavonoid Fingerprints I w. Rapid Commun Mass Spectrom. 2016 Jul 15;30(13):1639–46. doi: 10.1002/rcm.7601.
  5. l Doué M, Dervilly-Pinel. G, Gicquiau A, Pouponneau K, Monteau F, and Le Bizec, B. High Throughput Identification and Quantification of Anabolic Steroid Esters by Atmospheric Solids Analysis Probe Mass Spectrometry for Efficient Screening of Drug Preparations. Anal. Chem. 2014, 86, 12, 5649–5655, Publication Date: May 5, 2014, https://doi.org/10.1021/ac501072g.

720007111, January 2021

Back To Top Back To Top