• Application Note

Strategies for Improving Impurity Isolation Using Large Volume Loading and Easy Method Development in Preparative Chromatography

Strategies for Improving Impurity Isolation Using Large Volume Loading and Easy Method Development in Preparative Chromatography

  • Jo-Ann M. Jablonski
  • Andrew J. Aubin
  • Wendy Harrop
  • Waters Corporation

Abstract

The isolation and purification of impurities associated with the production of a variety of consumer products must be properly identified and characterized before these commodities can be sold to customers. Using large volume injections, focused gradients, and a change in column selectivity, we have shown that it is possible to effectively isolate a contaminant with excellent purity. This straightforward approach to impurity isolation is easy to adopt for many types of applications.

Benefits

  • The amount of impurity introduced to the column is increased when large volumes of sample are loaded on the column, making detection easier and improving the efficiency of the process.
  • Large volume sample loading reduces the number of runs, time, and solvent required for the isolation of compounds from weak diluents.
  • Focusing the gradient improves resolution and promotes increased column loading, which ultimately leads to better product purity.
  • A secondary column aids in impurity isolation by changing the selectivity of the separation and improving the resolution between the peak of interest and its closely eluting neighbors.
  • Mass-directed purification clearly identifies the product of interest and makes isolation straightforward.

Introduction

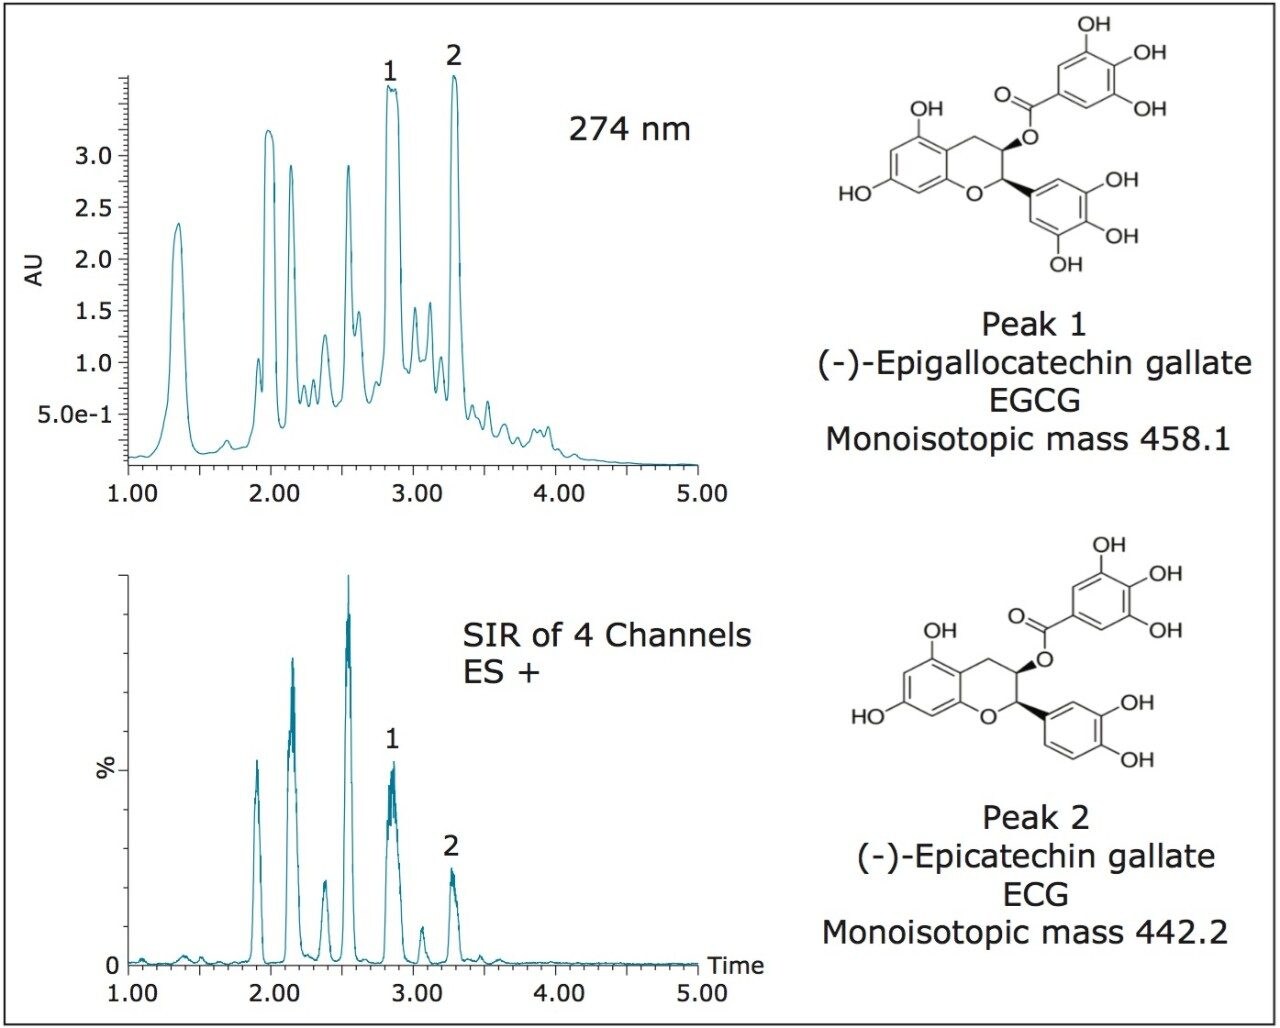
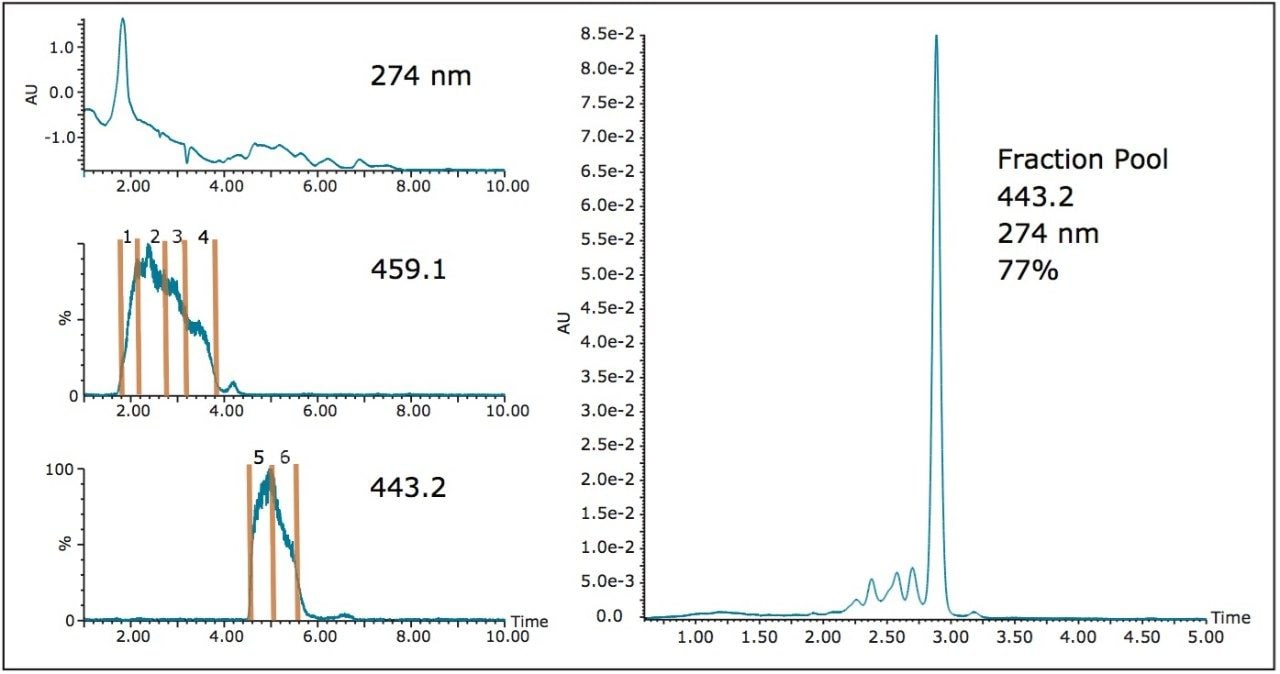
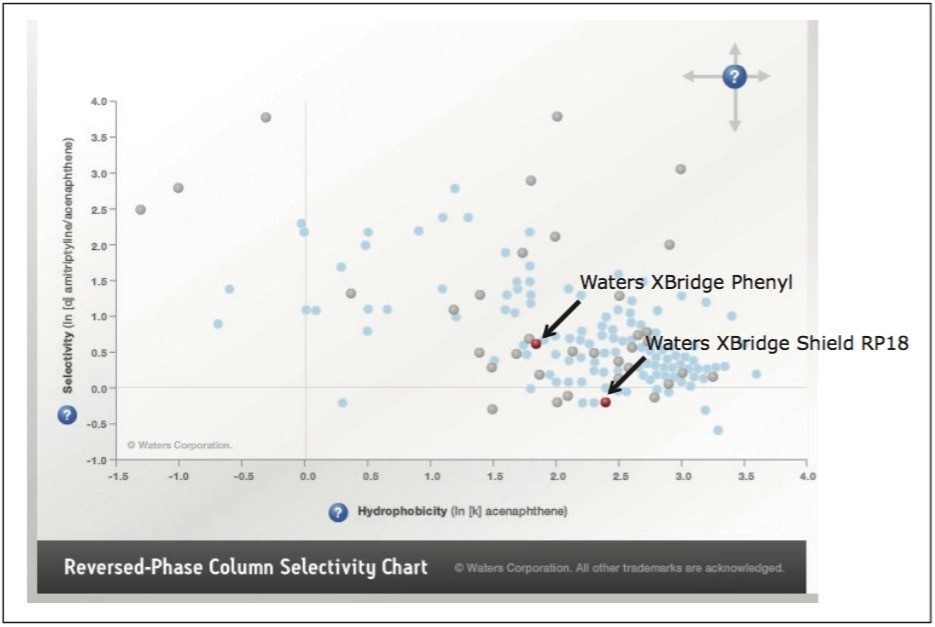
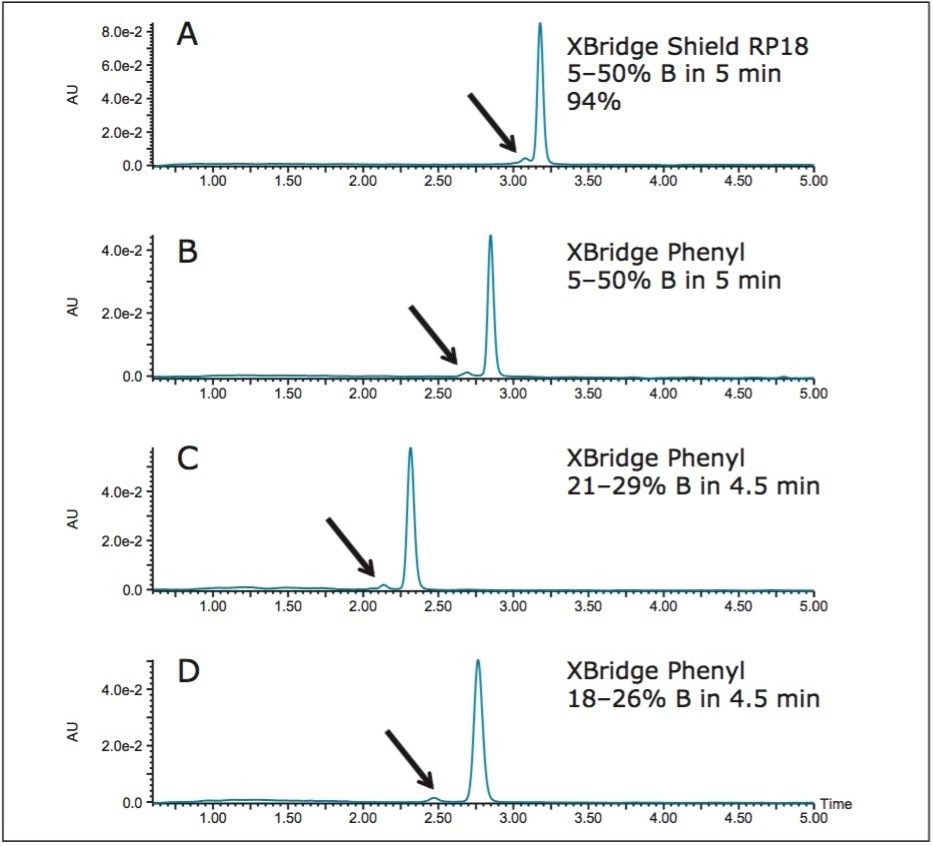
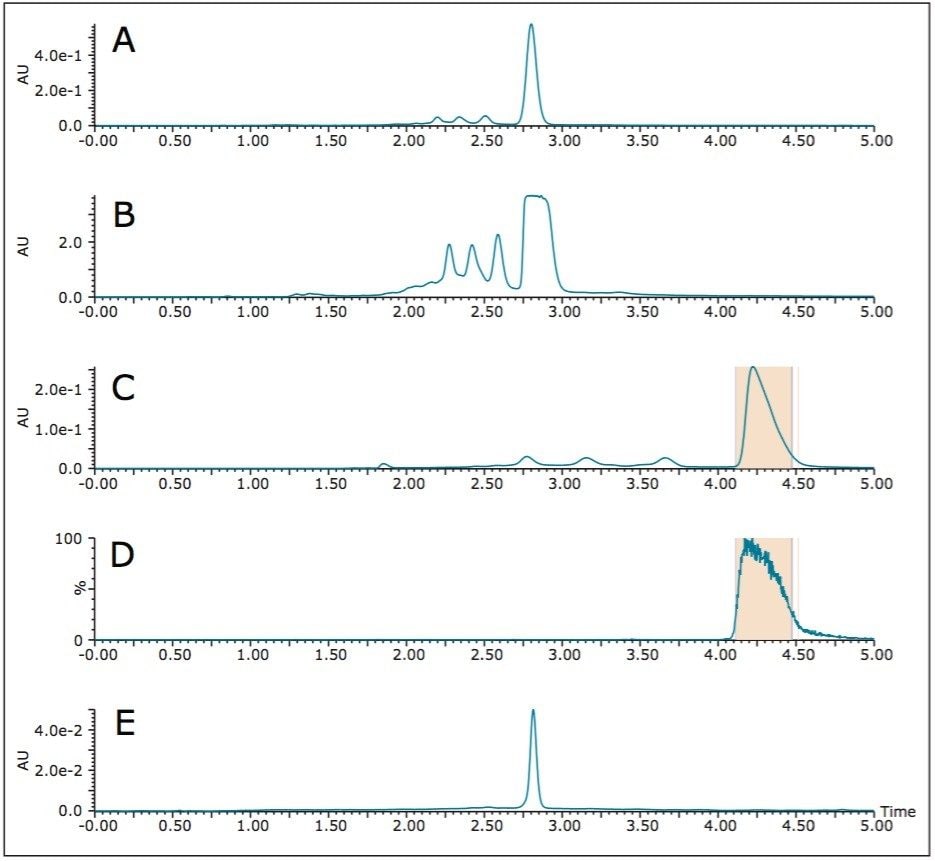
Impurities associated with the production of pharmaceuticals, agrochemicals, food and other consumer products must be properly identified and characterized before these commodities can be sold to consumers.1,2 While chemical synthesis is a viable option for obtaining enough impurity to analyze and characterize, isolation of the impurity using preparative chromatography of the product is faster and does not require skilled synthetic chemists.3 Techniques such as at-column dilution4 and large volume loading5 are effective for increasing loading capacity on preparative columns and decrease the number of chromatographic runs required to isolate sufficient material, whether it be product or impurity. Using green tea as the sample for illustrating the large volume loading technique in previous work, we successfully isolated epigallocatechin gallate, the most prevalent catechin in the extract. Epicatechin gallate, another catechin present in green tea in lower abundance and designated as the impurity in the current work, was also collected in each of the purification runs. In this study, we illustrate the subsequent purification of epicatechin gallate using a selectivity chart to aid in secondary column selection, and to demonstrate how focusing the gradient6 and using mass-directed purification led to the isolation of the impurity with very high purity. This straightforward protocol is easy to adopt and efficiently saves time and effort in the isolation of contaminating by-products.

Experimental

Methods

Green Tea Extract Isolation Conditions: Epigallocatechin gallate and epicatechin gallate

Analytical column and flow rate:

XBridge BEH Shield RP18, 4.6 mm x 50 mm, 5 μm; 1.46 mL/min

Prep column and flow rate:

XBridge BEH Shield RP18 OBD Prep, 19 mm x 50 mm, 5 μm; 25 mL/min

Mobile phase A:

0.1% formic acid in water

Mobile phase B:

0.1% formic acid in acetonitrile

Makeup solvent:

50:50 water:acetonitrile, 0.01% formic acid

Cone voltage:

15 V

Probe temperature:

500°C

Ionization mode:

ES +, continuum

Sampling frequency:

5 Hz

Scan range:

100–650 amu

Wavelength:

274 nm

Gradients and injection volumes:

as noted in figures

Sample:

10 bags Lipton Green Tea extracted with 1 L hot water for 10 minutes and filtered

Impurity Isolation Conditions:

Epicatechin gallate

Analytical column:

XBridge Phenyl, 4.6 mm x 50 mm, 5 μm

Prep column:

XBridge Phenyl, 19 mm x 100 mm, 5 μm

Sample:

Pooled epicatechin gallate fractions from large volume loading isolations.

Total volume:

60 mL

Instrumentation

Waters AutoPurification System:

2545 Binary Gradient Module, 2767 Sample Manager, System Fluidics Organizer, 8–30 mL Flow Splitter, two 515 HPLC pumps, 2998 Photodiode Array Detector, ACQUITY QDa Detector

Results and Discussion

Epigallocatechin gallate (EGCG)7 and epicatechin gallate (ECG), two of the many catechins found in green tea, were chosen as the compounds of interest for illustrating the concepts in these experiments. A loading study was performed to determine the amount of crude green tea extract that could be loaded on the analytical column, yet still give good resolution for the EGCG and ECG. The 200 μL maximum volume showed good resolution at 274 nm, but with mass detection, the two peaks of interest were clearly identified (Figure 1)even when running a fast screening gradient.

Figure 1. 200 μL crude green tea extract injected on the 4.6 x 50 mm column. Gradient: 5–50% B in 5 min. Peak 1 = Epigallocatechin gallate, M + H 459.1; Peak 2 = Epicatechin gallate, M + H 443.2.

Eight large volume injections of green tea extract were processed as described in previous work.8 The m/z 443.2 fractions were pooled for impurity analysis and purification. Figure 2 shows a representative 100 mL injection for the isolation of the two catechins of interest. While the prep chromatogram at 274 nm is rather unremarkable with poor peak definition, the mass chromatograms clearly define where the catechins elute and illustrate the utility of mass-directed purification. The m/z 443.2 pool had a 60 mL total volume and was 77% pure.

Figure 2. 100 mL green tea extract on the 19 x 50 mm XBridge Shield RP18 Column. Mass chromatograms are SIR channels. Prep gradient: 10–30% B in 11 min. Fraction pool focused gradient: 21–29% B in 4.5 min on 4.6 x 50 mm XBridge Shield RP18 Column, 20 μL.

Twenty mL of the m/z 443.2 fraction pool was dried and reconstituted in 1.4 mL water. Although the isolation of the two catechins was performed using a prep gradient that ran from 10–30% B in 11 minutes, focusing the gradient for the isolation of the impurity aided in increasing the resolution between the epicatechin gallate at 2.21 minutes and its most closely-eluting neighbor at 2.06 minutes. The new focused gradient ran from 21–29% B in 4.5 minutes and was used to purify 500 μL of the fraction pool on the 19 mm x 50 mm XBridge Shield RP18 Column. Fraction analysis on the collected fraction showed that the purity increased to a respectable 94%, a 17% improvement (Figure 3).

Figure 3. Purification of the 443.2 fraction pool. Prep focused gradient: 21–29% B in 4.5 min. Fraction pool analysis gradient: 5–50% B in 5 min on 4.6 x 50 mm XBridge Shield RP18 Column, 20 μL.

Although 94% is a reasonable purity for the characterization of a contaminant, a higher purity would ensure unambiguous results in later identity testing. Because the focused gradient used for the prep chromatography already had a very shallow slope, 0.67% B change per column volume, another column with different selectivity was selected for subsequent experiments. A column selectivity chart highlights the differences in selectivity between different column packing materials (Figure 4, http://www.waters.com/waters/promotionDetail.htm?id=10048475). The further the column positions are apart on the chart, the greater the difference in selectivity. The XBridge Phenyl Column selectivity was sufficiently different from the XBridge Shield RP18 selectivity to imply that further method development using this alternative chemistry might be suitable for increasing the resolution between the epicatechin gallate and its closelyeluting neighbor. Increasing the resolution between peaks often improves the purity of the compound of interest by reducing the incidence of peak co-elution.

Figure 4. Difference in selectivity between the XBridge Shield RP18 Column and the XBridge Phenyl Column.

The 94% pure fraction from the previous purification was used as the sample for developing the new method. For comparison purposes, Figure 5A shows the pure fraction run on the original XBridge Shield RP18 column with a 5–50%B gradient. Simply changing to the XBridge Phenyl Column moved the contaminant peak further away from the epicatechin gallate (Figure 5B). Although there was baseline resolution between the peaks using the 21–29% B focused gradient on the XBridge Phenyl Column (Figure 5C), focusing again (18–26% B) moved the peaks even further apart (Figure 5D). This increased resolution unquestionably suggested that the purity of the sample would be improved during isolation.

Figure 5. Method development on the 4.6 x 50 mm XBridge Phenyl Column, 20 μL injections of 94% pure 443.2 fraction.

Another 20 mL of the original m/z 443.2 fraction pool was dried and reconstituted in 1.4 mL water. Using the newly developed focused gradient, a loading study on the 4.6 x 50 mm XBridge Phenyl Column showed that a 60 μL injection gave baseline resolution between the m/z 443.2 peak and its closest eluting neighbor (Figure 6B). Geometric scaling to a 19 mm x 100 mm XBridge Phenyl Column suggested that a 2 mL injection volume was suitable for prep. We wished to retain some of the original sample, so with a total sample volume of only 1.4 mL, 600 μL of the pool was purified (Figure 6C and D). Analysis of the fraction showed a purity of 100% (Figure 6E).

Figure 6. Analysis of the dried fraction pool (A), 18–26%B in 4.5 min, 20 μL; loading study on the 4.6 x 50 mm column (B), 60 μL; preparative mass-directed purification of the impurity (D, mass 443.2) and its representative UV chromatogram (C), 18–26%B in 9 min on the 19 x 100 mm column, 600 μL; fraction analysis (E), 5–50%B in 5 min, 20 μL. All chromatography using XBridge Phenyl Column chemistry with detection at 274 nm or at mass 443.2.

Conclusion

Summary

The isolation and purification of impurities associated with the production of a variety of consumer products must be properly identified and characterized before these commodities can be sold to customers. Using large volume injections, focused gradients, and a change in column selectivity, we have shown that it is possible to effectively isolate a contaminant with excellent purity. This straightforward approach to impurity isolation is easy to adopt for many types of applications.

Conclusions

  • Loading large sample volumes increases purification efficiency by reducing the number of injections required for processing and increases the amount of impurity on the column making detection and collection easier to accomplish.
  • Focusing the gradient improves the resolution between compounds, promotes higher column loading, and reduces the incidence of co-elutions which improves the purity of the product.
  • Changing the column selectivity improves separations by promoting better resolution between sample components, which leads to high purity compound isolations.
  • Mass-directed purification unambiguously identifies the product of interest and makes isolation easy.

References

  1. ICH harmonized tripartite guideline, Impurities in new drug substances Q3A (R2), 25 October 2006.
  2. McCauley J, Twohig M. Isolating Trace Impurities for Structural Elucidation in a Commercial Fungicide Formulation Using Preparative SFC. Waters Application Note 720005374EN. 2015 April.
  3. Jones MD, Aubin A. Impurity Isolation and Scale-up from UPLC Methodology: Analysis of an Unknown Degradant Found in Quetiapine Fumarate. Waters Application Note 720003078EN. 2009 May.
  4. Wheat T, et.al. At-Column Dilution Application Notes. Waters Application Note 71500078010rA. 2003.
  5. Jablonski JM, Aubin AJ, Harrop W. Techniques for Improving the Efficiency of Large Volume Loading in Preparative Liquid Chromatography. Poster PSTR134833678. 2015 March.
  6. Jablonski JM, Wheat TE, Diehl DM. Developing Focused Gradients for Isolation and Purification. Waters Application Note 720002955EN. 2009 September.
  7. Aubin A. Qualitative and Quantitative Analysis of Natural Products. Waters Application Note WA01015. Waters Performance PerSPECtives WPP303. 2000.
  8. Jablonski JM, Aubin AJ, Harrop W. Techniques for Improving the Efficiency of Large Volume Loading in Preparative Liquid Chromatography. Poster PSTR134833678. 2015 March.

720005476, August 2015

Back To Top Back To Top