In this application note, we investigate various addition polymers, polystyrenes (PS) and polymethylmethacrylates (PMMAs), to evaluate the separations range of UltraPerformance Convergence Chromatography. This knowledge was then applied to the analysis of condensation co-polymers, bisphenol A- formaldehyde condensation polymer (PBAA) and poly[(phenyl glycidyl ether)-co-formaldehyde] (PGEF), using MS and UV detection.
The most common polymer analyses use gel permeation chromatography (GPC) to determine average molecular weight and polydispersity. However, when high resolution separations for individual oligomers are required to evaluate the material performance or understand polymer structure, other analytical techniques are used.1-4 Low molecular weight polymers can be analyzed by liquid chromatography (LC), gas chromatography (GC), and supercritical fluid chromatography (SFC) among others. The choice of separation technique usually is defined by solubility, average molecular weight, and thermal stability of the polymer. Waters UltraPerformance Convergence Chromatography (UPC2), the next step in the evolution of SFC, offers several advantages for the separation of complex oligomeric materials. Due to the low viscosity of supercritical carbon dioxide in comparison with liquids, higher flow rates can be used, which results in shorter analysis times than LC. Convergence chromatography operates at lower temperatures than GC, which is beneficial for the analysis of thermally labile material. Furthermore, UPC2 can separate higher mass, non-volatile oligomers than GC. Another advantage is the use of sub-2-μm particle columns which provide more theoretical plates and better resolution than traditional SFC. If the polymer has a chromophore, UV detection can be used. If information about isomer molecular weight is needed, a mass spectrometer (MS) can be used as the detector. UPC2 can be interfaced with both UV and MS detectors.
The simplest types of polymers are addition polymers. They are formed by sequential addition of monomer units without a loss of any molecules. Condensation polymers are formed in a condensation reaction between two or more different monomers, where individual molecules bind together and expel a by-product such as water. During polymerization reactions the individual molecules can attach to each other not only linearly but can also form branched isomers. Due to their ability to form various isomers, their separation and characterization can be challenging. In addition, degradation products and by-products can be formed under polymerization conditions which need to be characterized. The performance of polymeric materials can be affected by the isomer and oligomer distribution.
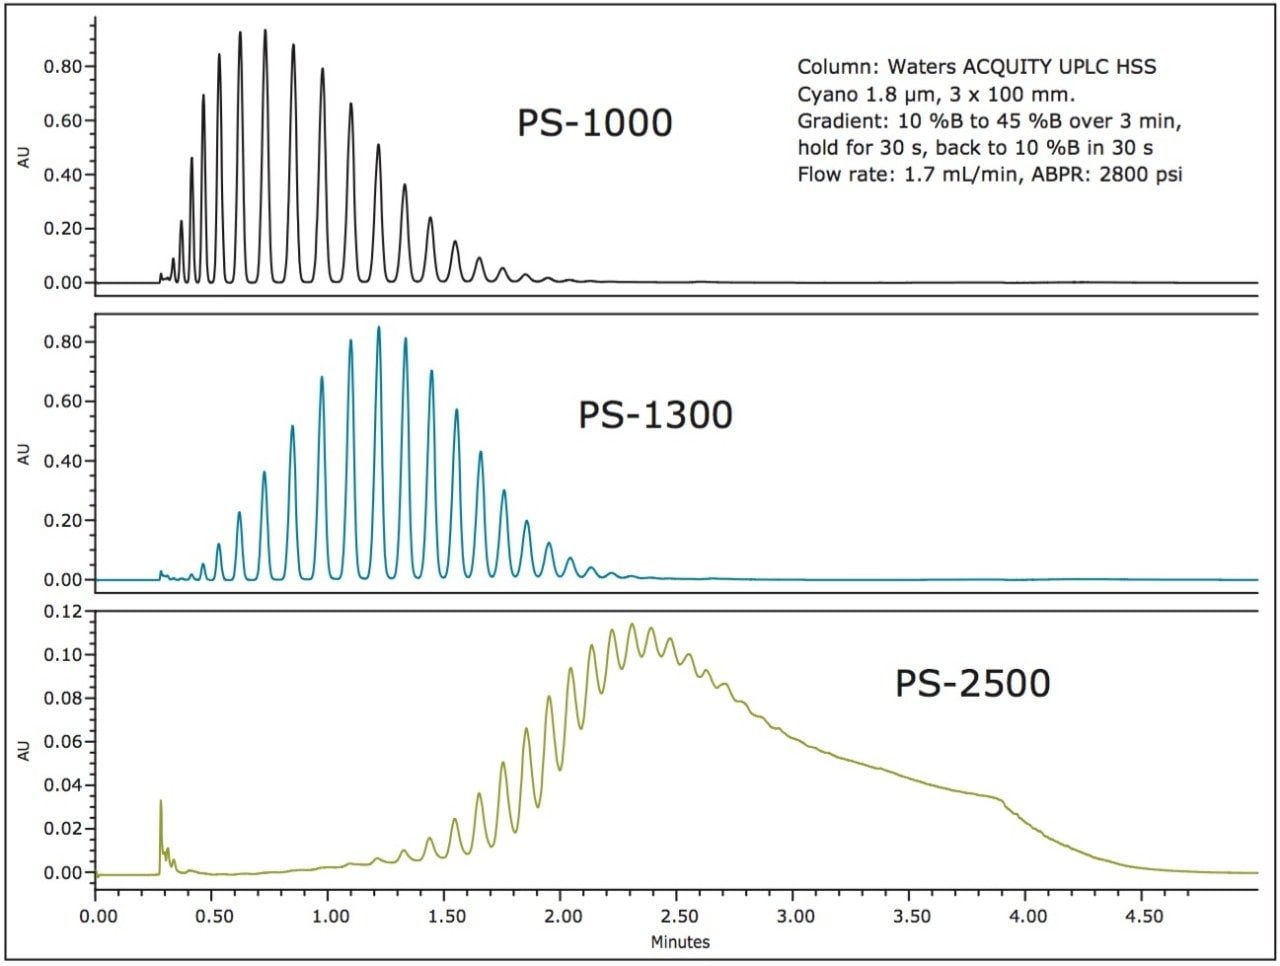
In this application note, we investigated various addition polymers, polystyrenes (PS) and polymethylmethacrylates (PMMAs), to evaluate the separations range of UPC2. This knowledge was then applied to the analysis of condensation co-polymers, bisphenol A- formaldehyde condensation polymer (PBAA) and poly[(phenyl glycidyl ether)-co-formaldehyde] (PGEF), using MS and UV detection.
All polymer samples were dissolved in tetrahydrofuran (THF) at a concentration of 10 mg/mL.
UPC2 conditions |
|
---|---|
System: |
ACQUITY UPC2 with PDA and ACQUITY SQD |
Mobile phase A: |
CO2 (food grade) |
Mobile phase B: |
0.3% ammonium hydroxide in methanol |
Column temp.: |
60 °C |
Injection volume: |
1.0 μL |
MS ionization: |
ESI (+ or – depending on sample) |
MS scan range: |
150 to 2000 m/z |
Capillary: |
1 kV |
Cone: |
25 V |
Make-up solvent: |
0.3% ammonium hydroxide in methanol |
ABPR: |
see specific sample |
Flow rate: |
see specific sample |
Vials: |
Clear Glass 12 x 32 mm Screw Neck Vial, 2-mL volume |
Data management: |
Empower 3 CDS |
Various molecular weight polystyrenes and PMMAs (Figure 1) were evaluated on sub-2-μm particle size columns for UPC2. Figure 2 shows the separation of three different polystyrenes. Separation of all oligomers for PS-1000 and PS-1300 was achieved in less than 2.5 minutes. However, only partial separation for PS-2500 was attained. As molecular weight increases, the complexity of the polymer increases so that baseline resolution is no longer achieved.
It was possible to resolve higher mass PMMA oligomers than polystyrene, as shown in Figure 3. As the average molecular weight of polymer increases, the retention time for complete elution goes up as well. The molecular weight range of polymers that can be analyzed by UPC2 will depend on the solubility of the sample in CO2, the type of polymer, and the length of run time the analyst is willing to accept for the separation to be achieved. Higher molecular weight polymers generally require a higher percentage of organic modifier to elute off the column. However, increasing the organic modifier percentage increases the back pressure. Keeping the back pressure within an acceptable range requires the flow rate to be decreased, which ultimately can extend the run time.
Examples of the value of UPC2 in polymer analysis are demonstrated in the following two case studies. The first one involves the analysis of bisphenol A- formaldehyde condensation co-polymer (PBAA), shown in Figure 4. The co-polymer is formed by addition of polybisphenol A to formaldehyde and expelling a water molecule in the process. Analyzing PBAA, the expected dimer, trimer, and subsequent oligomer peaks were observed. However, an additional large peak was observed at the retention time of 0.7 minutes with m/z 227 (Figure 5). The starting compounds for the polymer were bisphenol A and formaldehyde. m/z 227 (ESI-) corresponds to the bisphenol A molecular ion [M-H]-.
Confirmation of the unreacted bisphenol A was performed by UV and MS detection with an authentic standard (Figure 6). The retention time of bisphenol A standard corresponded to the unknown peak in the polymer sample. Also, the MS spectrum of bisphenol A matched the spectrum for the peak of interest. Additional confirmation was provided by the formic acid adduct also seen in the mass spectrum.
In this case, MS provided valuable information about an unreacted starting material in the polymerization reaction. This analysis method could be used in reaction monitoring to ensure complete utilization of the starting materials.
The second test case involved analysis of poly[(phenyl glycidyl ether)-co formaldehyde] (Figure 7). As shown in Figure 8, a separation for individual isomers was easily achieved for dimers. Based on the starting molecule’s structure, there are three possible positions for the attachment of the next unit. For the dimer that means six different isomers can be present in the sample – only three were observed. For the trimers and subsequent oligomers, the possible structures increased exponentially. In the current separation, seven individual trimers were resolved.
When looking at the total ion chromatogram (TIC) from the same separation (Figure 9), additional peaks were seen between the dimers and trimers. The observed m/z ratios of the clusters were 404 and 402. These masses can result from changes in phenyl glycidyl ether with either loss of a glycidyl ether chain or with opening of an ether ring (Figure 10). Subsequent oligomers containing the described degradation units appeared between trimers and tetramers as well.
UPC2-MS is a very powerful tool for characterization of complex oligomeric materials. A wide selectivity space is beneficial for the separation of similar compounds like isomers of polymer oligomers. Additional advantages include compatibility with polar and non-polar polymers, lower analysis temperatures, and higher mass range than GC. The use of supercritical fluid mobile phase shortens retention times for large molecular weight compounds in comparison to LC. The addition of detection by MS provides complementary information to UV data, which can be useful for reaction monitoring, characterization of individual oligomers, impurity determination, and formulation analysis.
720004759, July 2013