Okra is an important vegetable of the tropical countries and a popular diet component in several countries including India. According to the Food and Agriculture Organization of the United Nations (FAO),1 India is one of the largest okra producers in the world and it produced approximately 5,800 tons of okra in 2010 and 2011. Okra is susceptible to a variety of pests and diseases2 and a wide-range of pesticides are used to treat okra plants in India. Legislative limits are in place for the presence of pesticides in domestically produced, imported, or exported okra.3 It is, therefore, very important to monitor the presence of commonly used pesticides in okra at legislative limits.
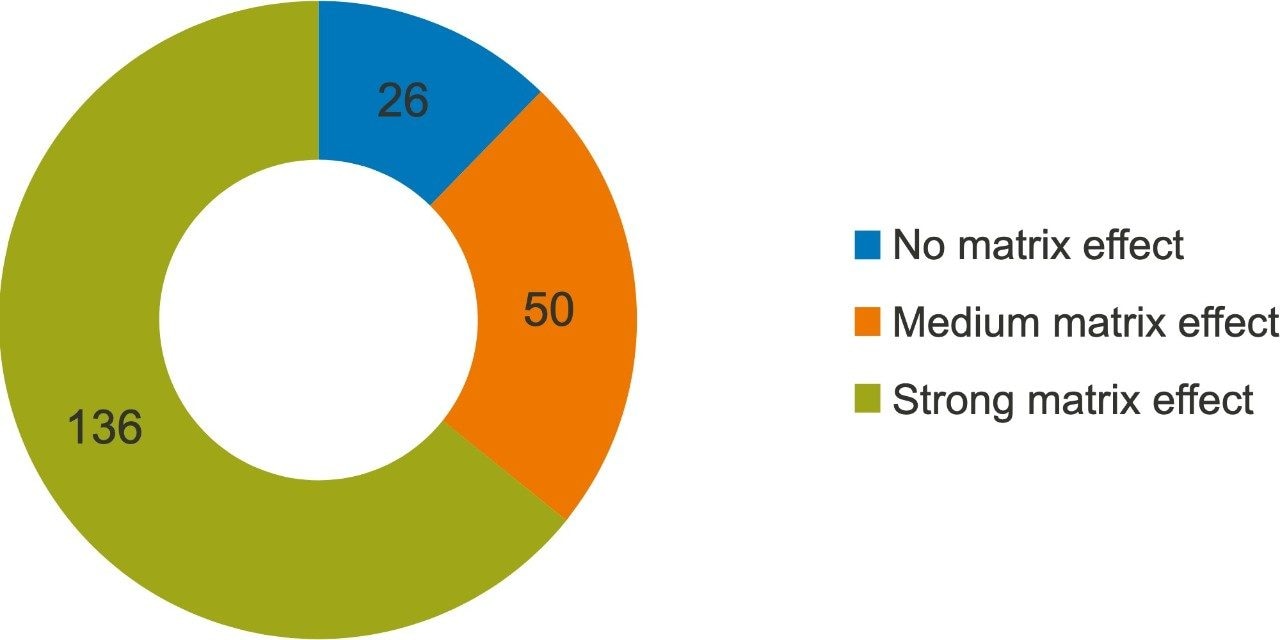
According to the PRiF (Pesticide Residues in Food) report, import controls under regulation (EC) No 669/2009 have been increased for okra imported from India because of the frequent detection of pesticide residues, mainly monocrotophos. The consignment is supposed to be rejected if it is non-compliant with MRLs
(Maximum Residue Limits). Since July 1, 2012, the frequency of testing consignments has been increased from 10% to 50%. With this frequent testing, monocrotophos, triazophos, and acetamiprid were found at 0.02 mg/kg in okra samples from India, while the MRL for these compounds is 0.01 mg/kg.4
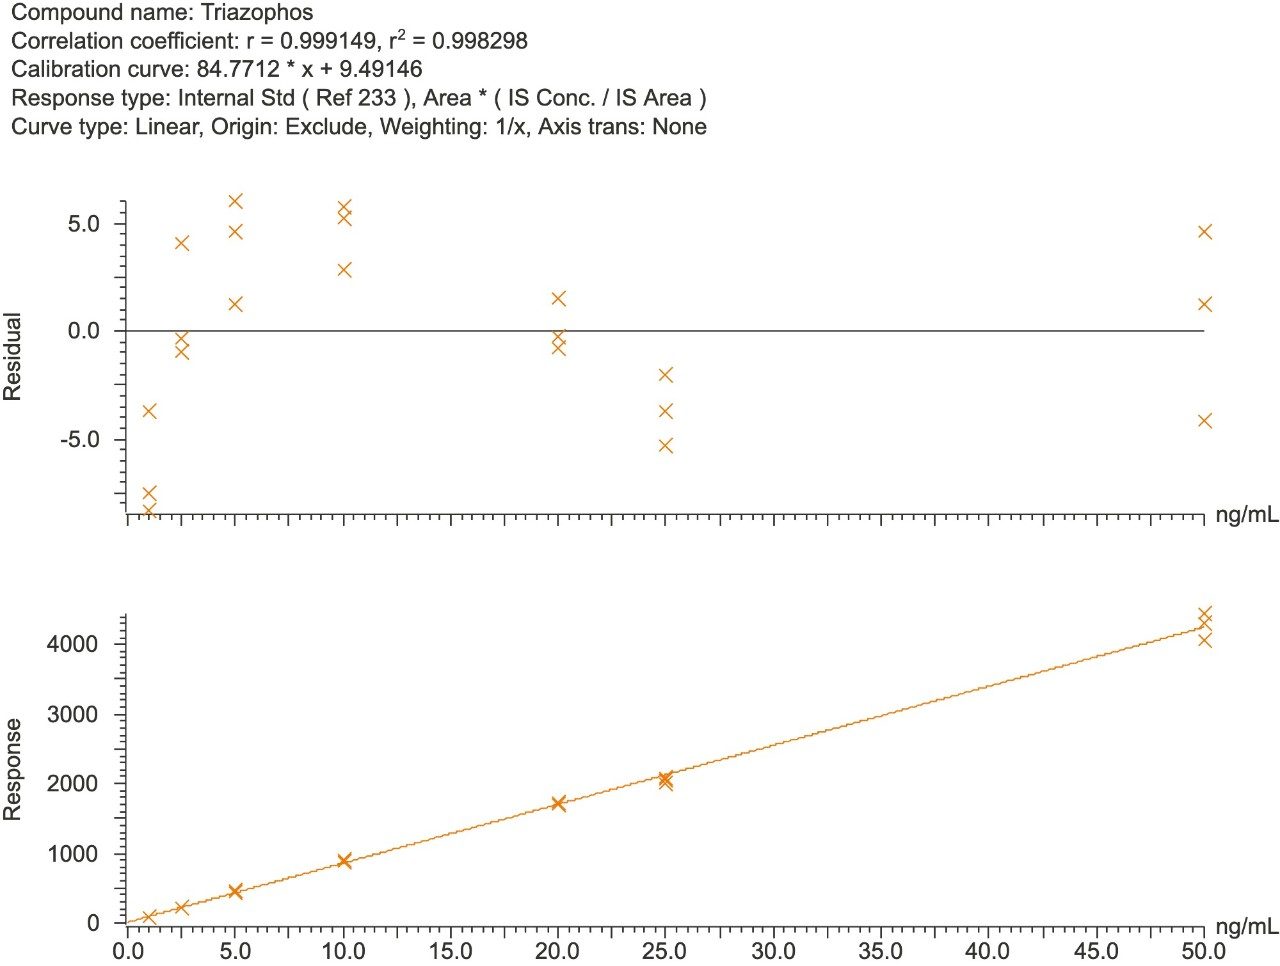
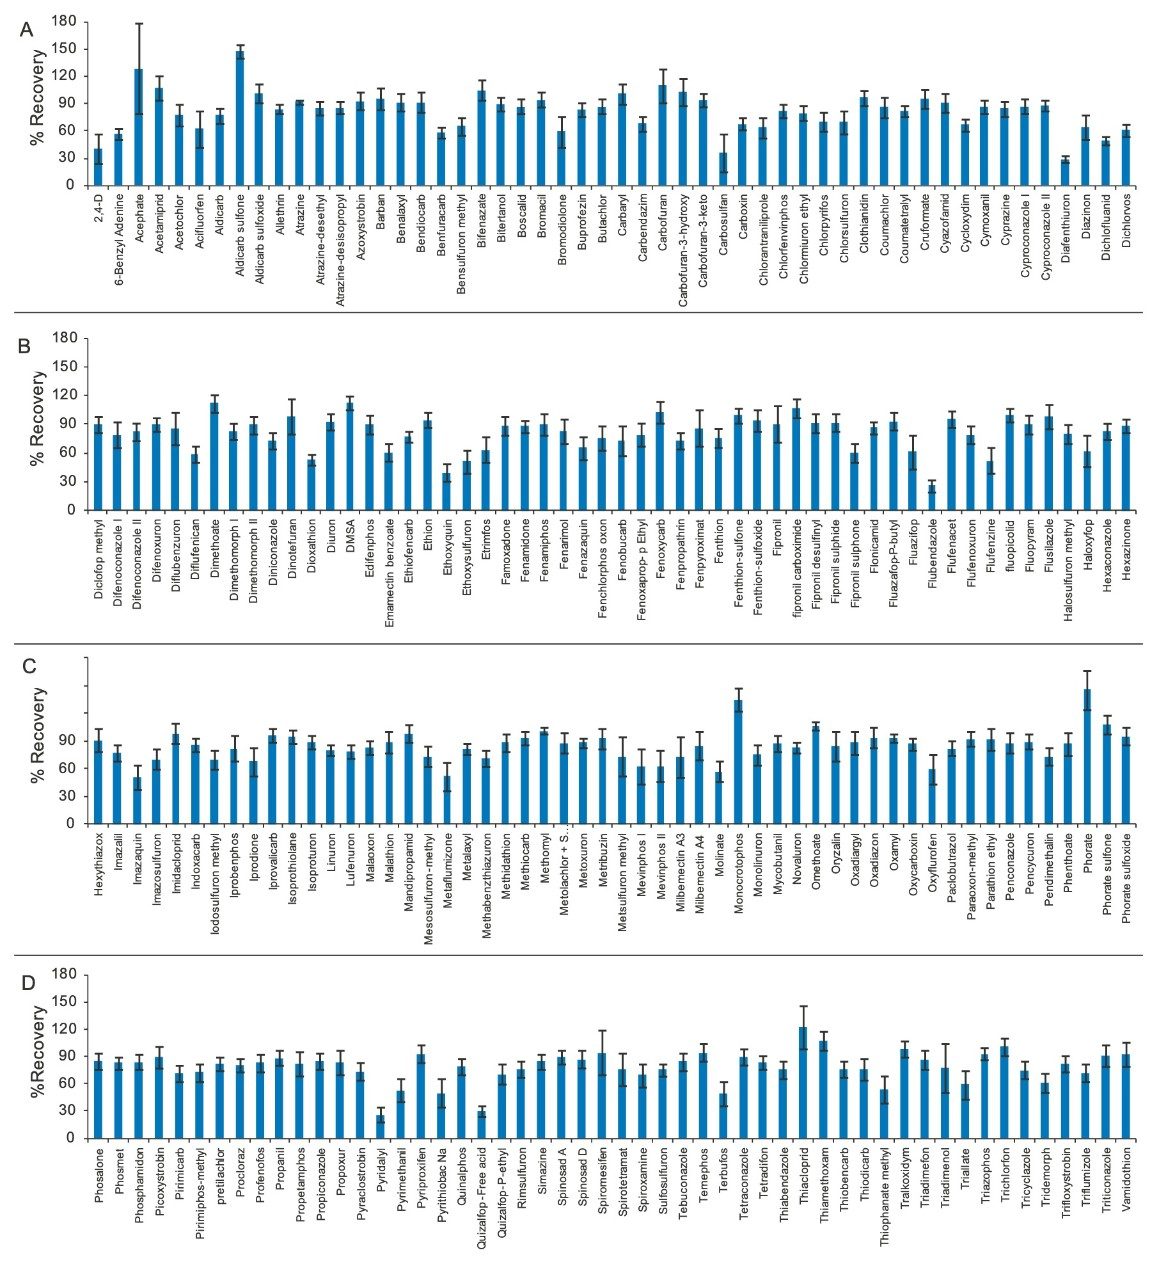
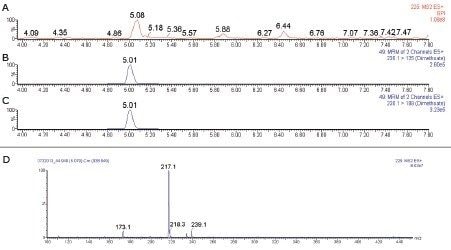
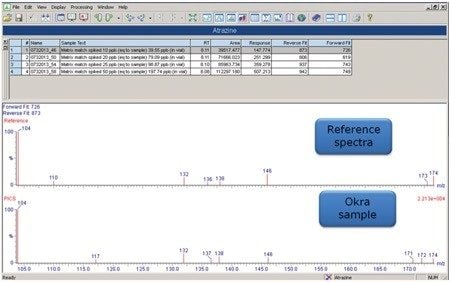
In this application note, a multi-residue analysis method for the detection of 212 pesticides in okra is presented. For a complete list of all pesticides, see Appendix A.