This application note describes the analysis of Ficus sp. extract using the ACQUITY UPLC and SYNAPT G2 HDMS System with IMS and MSE functionality for a comprehensive structural characterization of flavonoids.
Flavonoids are a remarkable group of plant metabolites that ubiquitously exist in natural products that have been considered as an active ingredient of many medicinal plants.1 Generally, the backbone of flavonoids consists of two phenyl rings and a heterocyclic ring, but they are often conjugated to a carbohydrate moiety with individual differences arising from various chemical processes, such as hydroxylation, methoxylation, glycosylation, and acylation.2
Plants containing flavonoids have been used for thousands of years in traditional Eastern medicine. In recent years, plant flavonoids have been shown to be of vital significance to humans. They have been linked as active contributors of health benefits, including its antioxidant properties in beverages such tea and wine, and in foods such as fruits and vegetables.
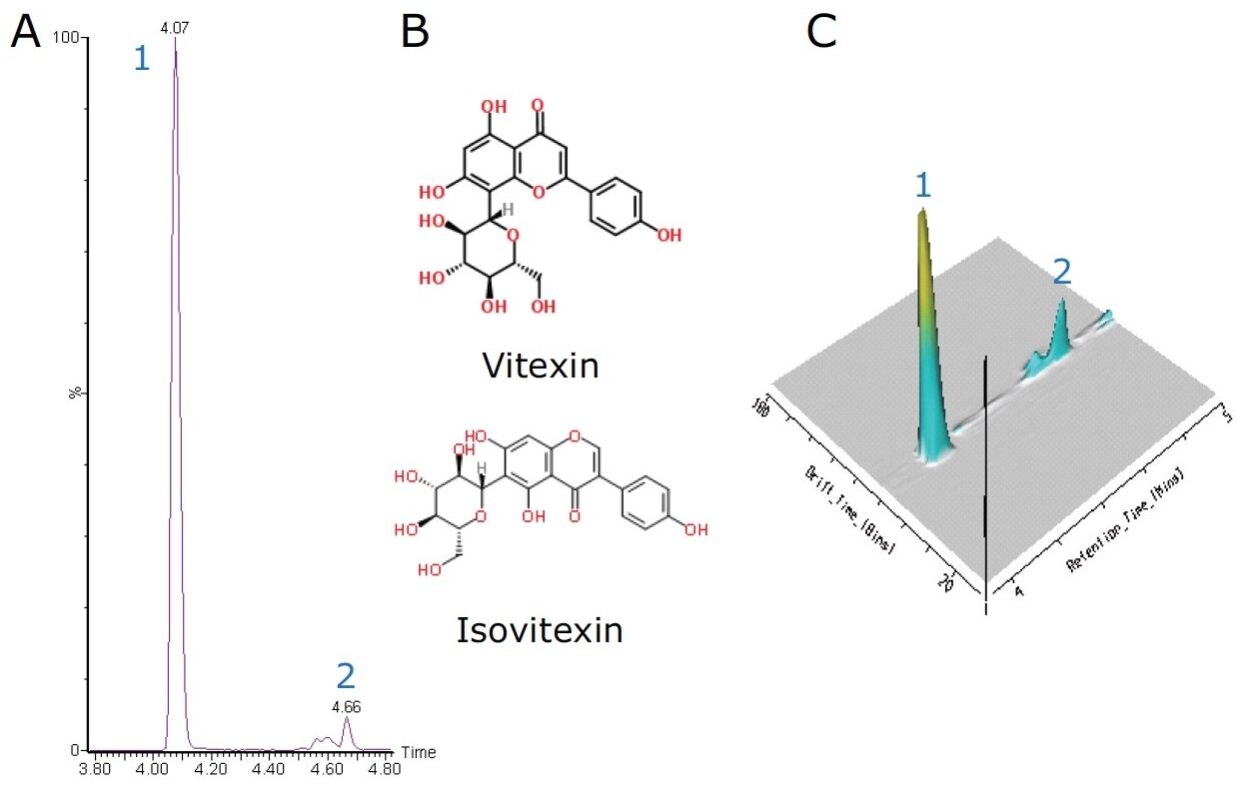
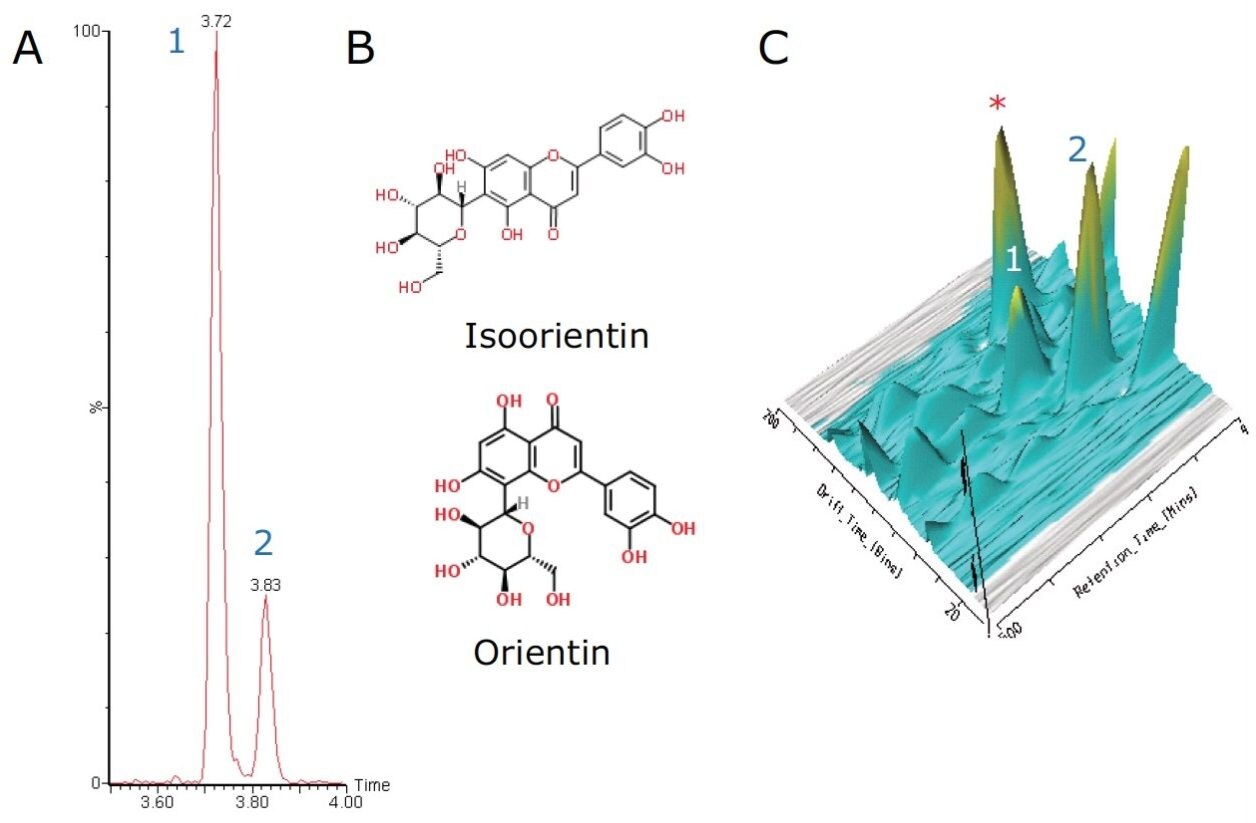
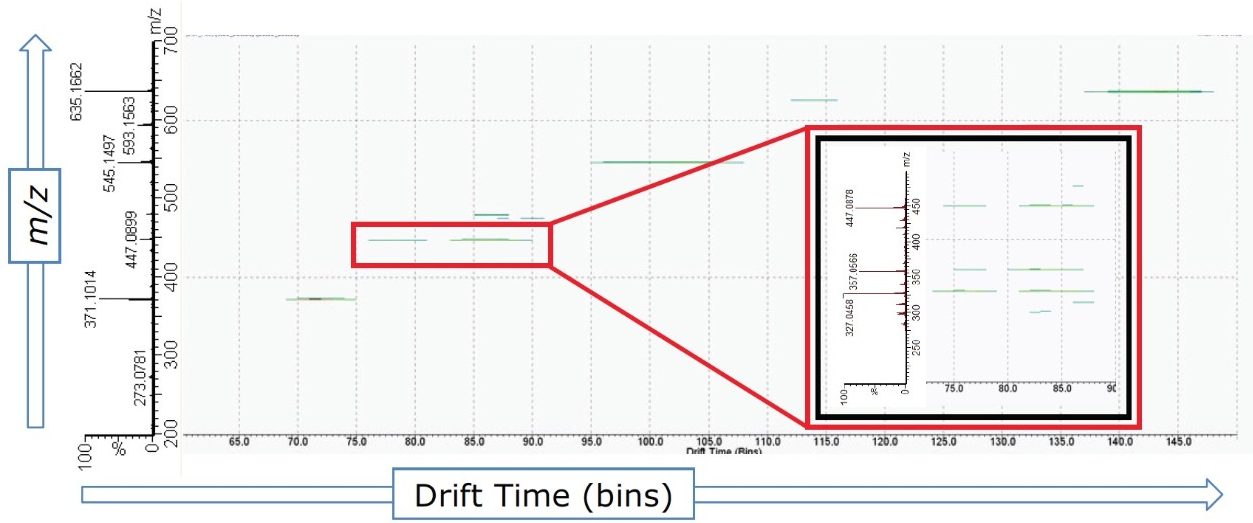
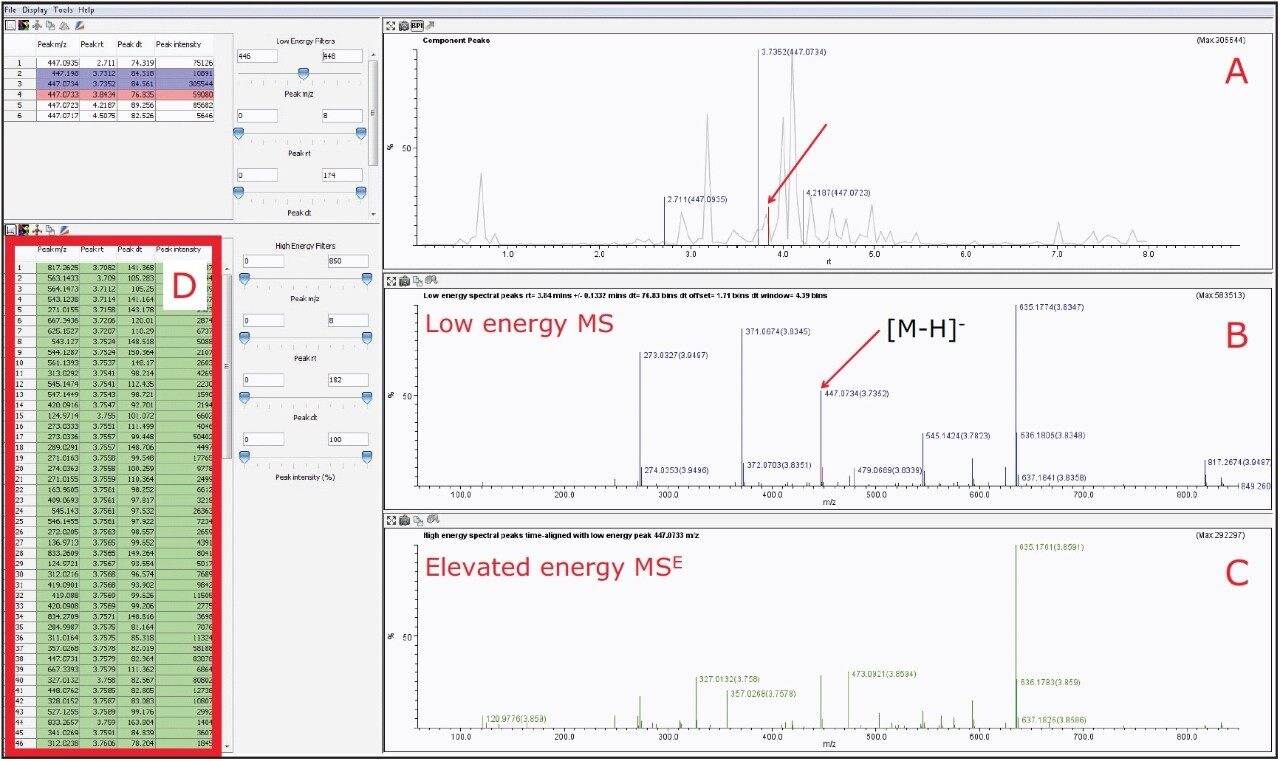
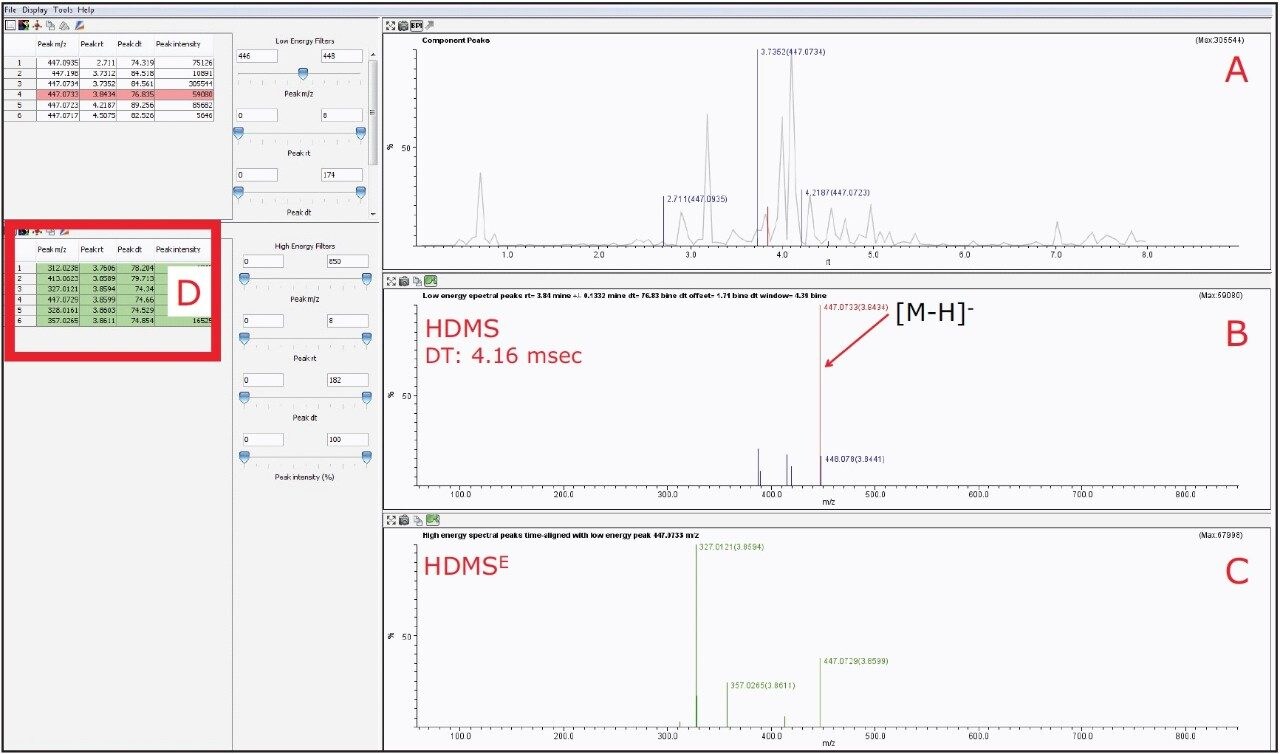
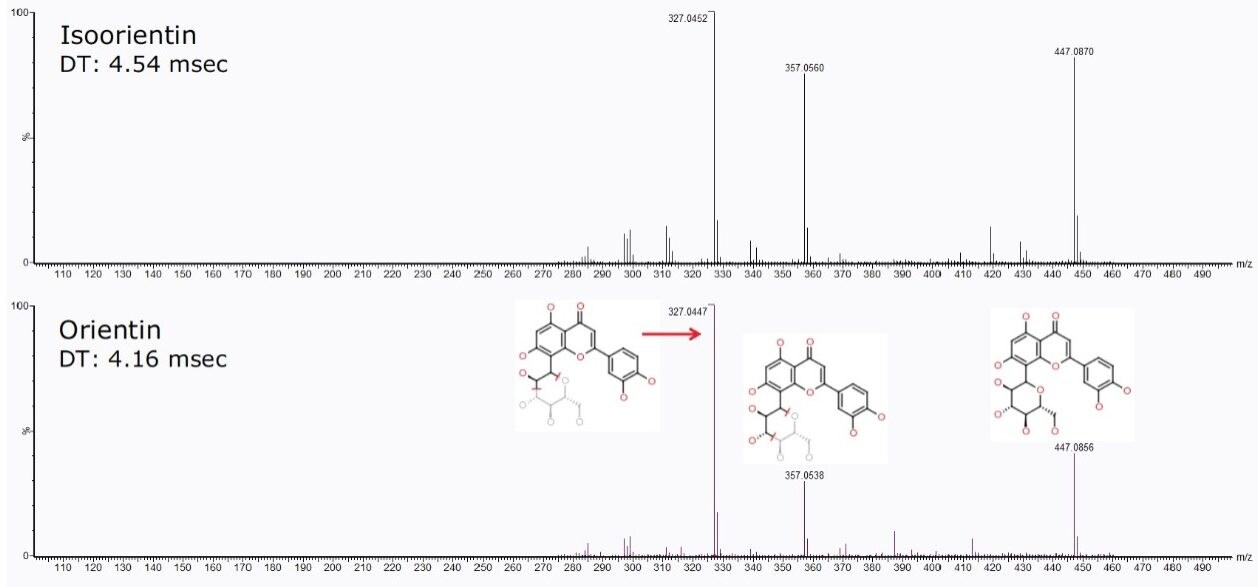
Waters SYNAPT G2 High Definition Mass Spectrometry (HDMS), a combination of high-efficiency ion mobility separation (IMS) and time-of-flight (TOF) mass spectrometry, has been used to effectively separate and identify natural product structural isomers.3 The rapid orthogonal gas separation technique in the IMS T-Wave allows another dimension of separation via their mass and shape without compromising MS data quality or sensitivity.
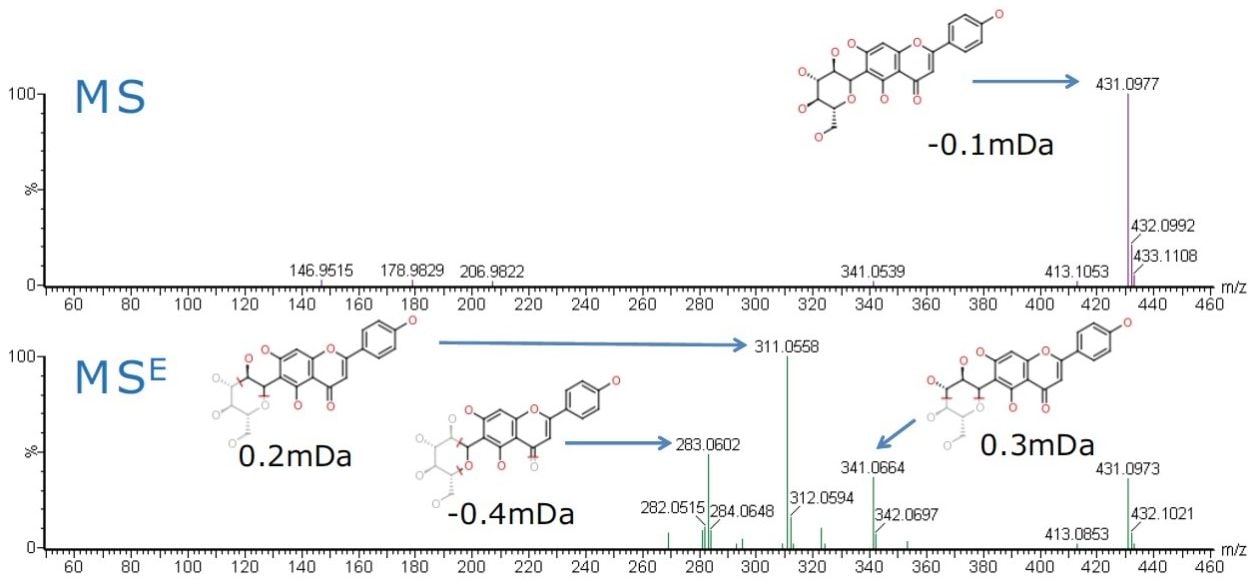
MSE is an acquisition technique that provides a simple, unbiased, and parallel route to deliver exact mass, low energy precursor (MS) and high energy fragment ion (MSE) information from every detectable component, without the need for multiple injections.
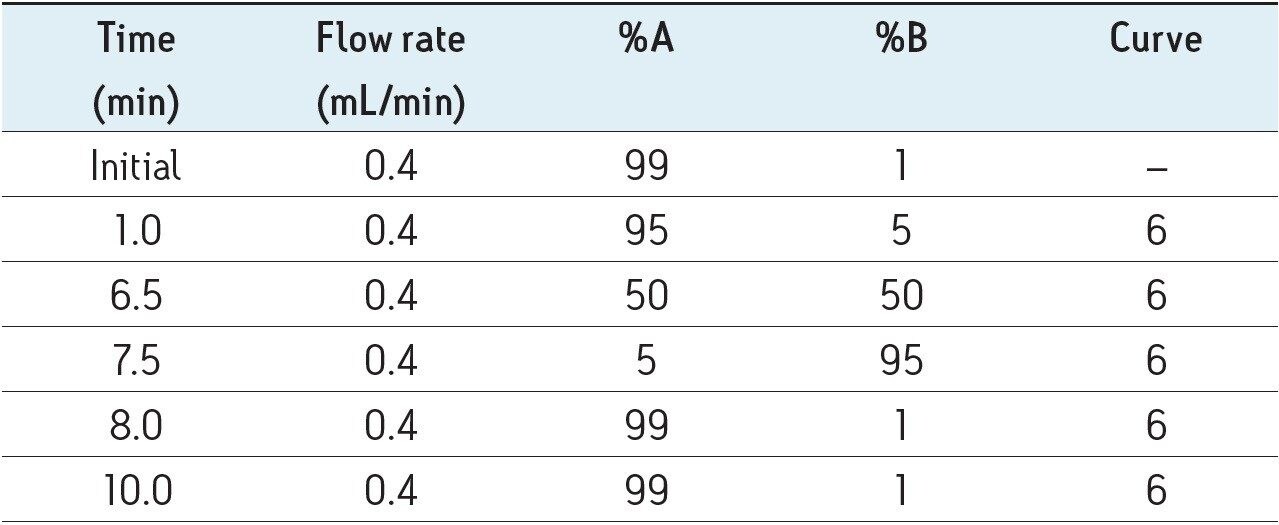
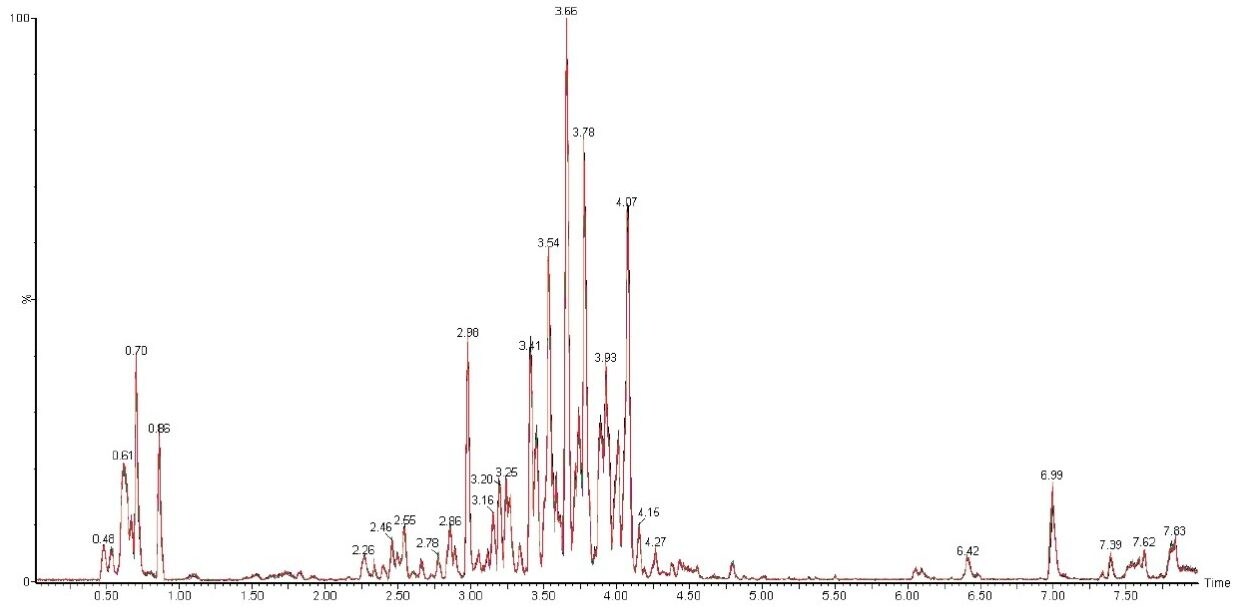
This application note describes the analysis of Ficus sp. extract using Waters ACQUITY UPLC System combined with the SYNAPT G2 HDMS System with IMS and MSE functionality to provide chromatographic and isobaric separation for a more comprehensive structural characterization of flavonoids.
LC system: |
ACQUITY UPLC |
Column: |
ACQUITY HSS T3 2.1 x 100 mm, 1.8 μm |
Column temp.: |
40 °C |
Mobile phase A: |
Water + 0.1% formic acid |
Mobile phase B: |
Acetonitrile + 0.1% formic acid |
Injection volume: |
5.0 μL PLNO |
Total run time: |
10.0 min |
MS System: |
SYNAPT G2 HDMS |
Ionization: |
ESI negative |
Capillary voltage: |
1.7 kV |
Sampling cone: |
30 V |
Extraction cone: |
4.0 V |
Source temp.: |
120 °C |
Desolvation temp.: |
500 °C |
Desolvation gas: |
1000 L/hr |
Cone gas: |
50 L/hr |
Trap CE: |
4 V |
Transfer CE: |
0 V |
Trap/transfer gas: |
Ar |
IMS gas: |
N2 (~3.4 mbar) |
IMS T-Wave speed: |
650 m/sec |
IMS T-Wave height: |
40 V |
Mass range: |
50 to 1200 m/z |
Plant samples (Ficus sp.) were extracted in 50% methanol/water solution. The extract was then centrifuged and the supernatant was collected for further analysis.
Mobile phase gradient is detailed in Table 1.
In this profiling study, the base peak ion chromatograms of the extracted Ficus sp. samples showed a high degree of complexity, with numerous co-eluting components and also the presence of isomers. The advantages of ACQUITY UPLC not only produces highly reproducible chromatograms between injections, as shown in Figure 1, but also high throughput with a rapid analysis time of 10 mins. When coupled together with IMS and MSE functionality of the SYNAPT G2 HDMS, another dimension for the separation of isomers/isobaric compounds is attained. With this system, comprehensive structural information can be acquired without compromising sensitivity and analysis time.
The flavone C-glycosides are an important subclass of the flavonoids family. Flavone C-glycosides are present in foodstuffs and nutraceuticals and they include orientin (luteolin-8-C-glucoside), isoorientin (luteolin-6-C-glucoside), vitexin (apigenin-8-C-glucoside), and isovitexin (apigenin-6-C-glucoside). They are also reported to exhibit anti-inflammatory and anti-nociceptive properties.4,5
Both vitexin and isovitexin have the same chemical formula of C21H20O10 with an exact mass of m/z 431.0978 [M-H]-. Using the above UPLC method, the extracted ion chromatogram showed two peaks with a baseline chromatographic separation at 4.07 min and 4.66 min, as shown in Figure 2A. As both compounds are isobaric, the assignment of vitexin and isovitexin to these peaks (4.07 min and 4.66 min) are not possible with only high resolution spectra alone. The identities of these two peaks were further confirmed using MSE and IMS.
Baseline chromatographic separation of vitexin and isovitexin via retention time was achieved. However the fragmentation patterns observed in the MSE spectra for both vitexin and isovitexin were identical. The predicted product ions of vitexin and isovitexin, were then cross-checked against the MSE spectra of the Ficus sp. extract samples using MassFragment Software to provide added confidence. The MS and MSE spectra of isovitexin are shown in Figure 3.
Using HDMS, both compounds were further separated via ion mobility based on their structural configuration and a 3D plot was generated, as shown in Figure 2C. From Figure 2C, it can be observed that vitexin and isovitexin have drift times of 81.78 bins (4.45 ms) and 83.44 bins (4.53 ms) respectively. Thus using retention times, MSE and HDMS, the identity of vitexin and isovitexin can be determined.
Two additional important C-glycoside flavonoids are orientin and isoorientin. They have a chemical formula of C21H20O11 with an exact mass of m/z 447.0927 [M-H]-. The extracted ion chromatogram in Figure 4 shows two major peaks at 3.72 min and 3.83 min.
Baseline chromatographic separation of isoorientin and orientin via retention time was achieved. However upon further interrogation of these peaks using ion mobility and DriftScope Data Viewer, when a 3D plot was generated, shown in Figure 4C, it was observed that an unknown peak (m/z 635.1767) co-eluted with the orientin peak (marked with an asterisk in Figure 4C).
The 2D DriftScope plot in Figure 5 illustrates the IMS separation of isobaric orientin and isoorientin (447.0927 m/z), showing two isomers with drift times of 76.83 bins (4.16 ms) and 84.33 bins (4.54 ms) respectively. Thus by estimating the cross-sectional structure of orientin and isoorientin, shown in Figure 4B, it can be proposed that the more compact orientin is the species with the drift time of 4.16 ms and the more extended structure of isoorientin has a longer drift time of 4.54 ms. Using the HDMSE available on the SYNAPT G2 HDMS, the product ions of orientin and isoorientin were easily visualized by their drift times and mass-to-charge ratios, as shown in the insert in Figure 5.
Using the MSE Data Viewer, with the selection of m/z 447.0927, the BPI chromatogram window showed two prominent peaks at 3.73 and 3.84 min, as shown in Figure 6A. However upon further data interrogation of the peak at 3.84 min, it was observed that there were several co-eluting compounds, which were of higher intensity than the peak of interest, as shown in Figure 6B. Thus due to the high complexity of the sample and the vast amount of product ions present in the MSE spectra. It is impossible to accurately determine the fragmentation pattern of orientin, see Figures 6C and 6D.
However, by activating the HDMS function of the MSE Data Viewer, the co-eluting components in the same peak at 3.84 min could be mobility resolved. As shown in Figure 7B, the precursor ion of orientin has a drift time of 4.16 ms. With the HDMS functionality activated, the product ions were easily resolved and the list of product ions were also greatly reduced, as shown in Figures 7C and 7D, thus increasing the confidence level of identifying orientin. HDMSE is an essential tool for separating compounds in complex mixtures containing numerous co-eluting compounds as it provides another dimension of orthogonal separation for increased confidence in isomer identification.
For isoorientin with a retention time at 3.73 min, a drift time of 4.54 ms with similar HDMSE fragmentation pattern as orientin was observed, as shown in Figure 8.
720004428, August 2012