• Note d'application

Rapid Identification of Major Metabolites of Gefitinib Using Ion Mobility Enabled MS (HDMSE) with the SYNAPT XS

Rapid Identification of Major Metabolites of Gefitinib Using Ion Mobility Enabled MS (HDMSE) with the SYNAPT XS

  • Robert S. Plumb
  • Lauren Mullin
  • Adam King
  • Ian D. Wilson
  • Waters Corporation
  • Computational and Systems Medicine, Imperial College, London UK

Abstract

This application note demonstrates the use of the SYNAPT XS combined with the Waters UNIFI Metabolite Identification Application Solution for identification of the drug-related metabolites of gefitinib (Iressa) in mouse plasma.

Benefits

Highly sensitive, rapid and accurate identification of drug metabolites using ion mobility enabled mass spectrometry

Introduction

Drug metabolism studies form an essential part of the drug discovery and development process, allowing molecules with unfavorable characteristics to be eliminated early on in favor of more promising compounds. Metabolite profiling and identification plays a critical role in this process, ensuring that the safety assessment models provide sufficient systemic exposure to allow investigatory dosing in humans. Mass spectrometry (MS), in particular high-resolution MS (HRMS), has become the platform of choice for drug metabolite profiling and identification.1 However, several challenges remain for high-throughput metabolite identification, including metabolite co-elution and endogenous interference, identifying the position of metabolism, and confirmation of functionalization or conjugation.

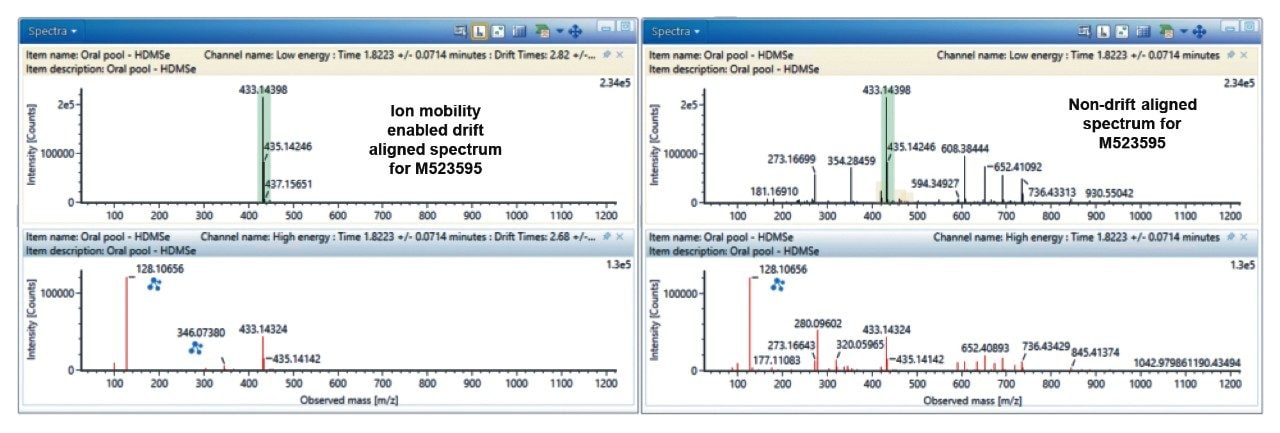
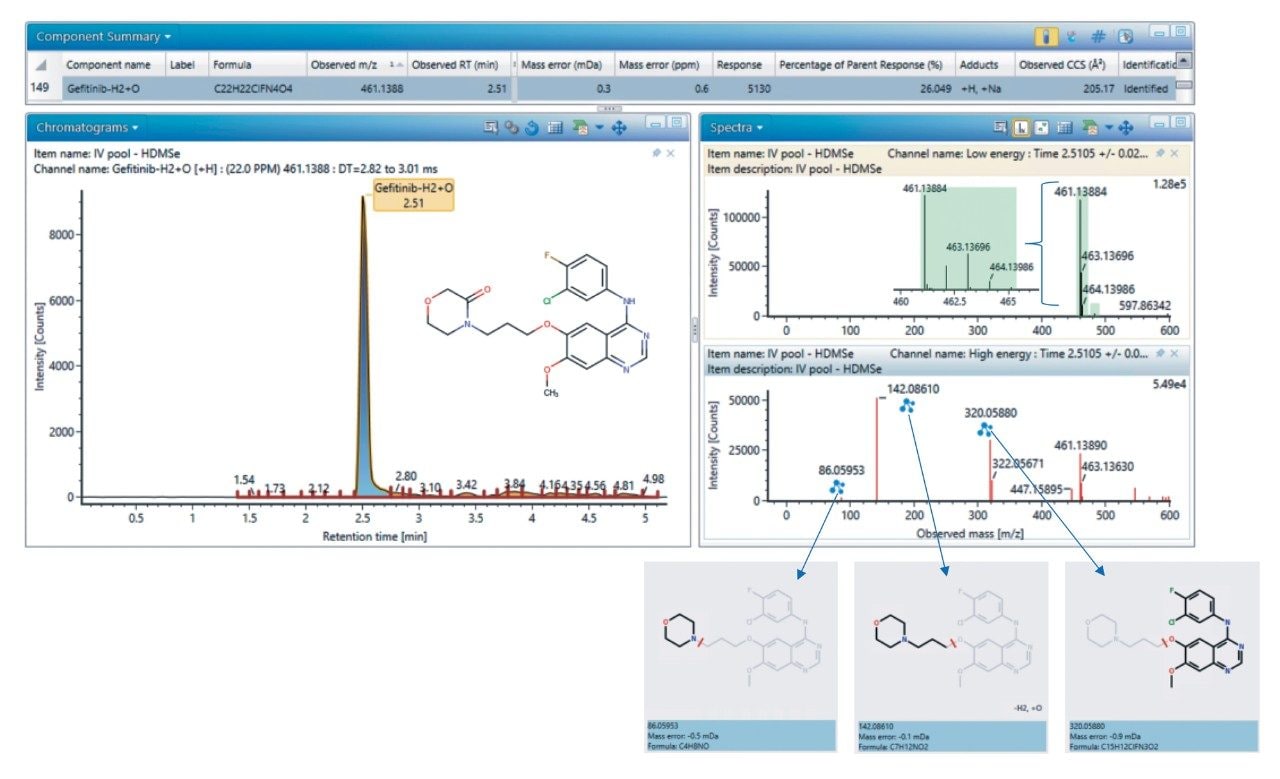
Ion mobility (IM) enabled MS combines the power of HRMS with the resolving power of gas phase ion mobility separations. This allows co-eluting metabolites or other compounds (endogenous or exogenous) to be resolved, resulting in cleaner spectra and greater confidence in the molecular origin of product ions. More recently, the ability to accurately measure and predict gas-phase collision-cross section (CCS) values has also enabled greater confidence in correct structural identification and regionalization of metabolism.

The SYNAPT XS High Resolution Mass Spectrometer is the newest addition to Waters’ HRMS portfolio of ion mobility enabled QTof mass spectrometers. The SYNAPT XS High Resolution System is equipped with a StepWave XS for improved analytical sensitivity and enhanced ion transmission, as well as an extended flight tube for improved resolution. Here, we demonstrate the use of the SYNAPT XS combined with the Waters UNIFI Metabolite Identification Application Solution for identification of the drug-related metabolites of gefitinib (Iressa) in mouse plasma.

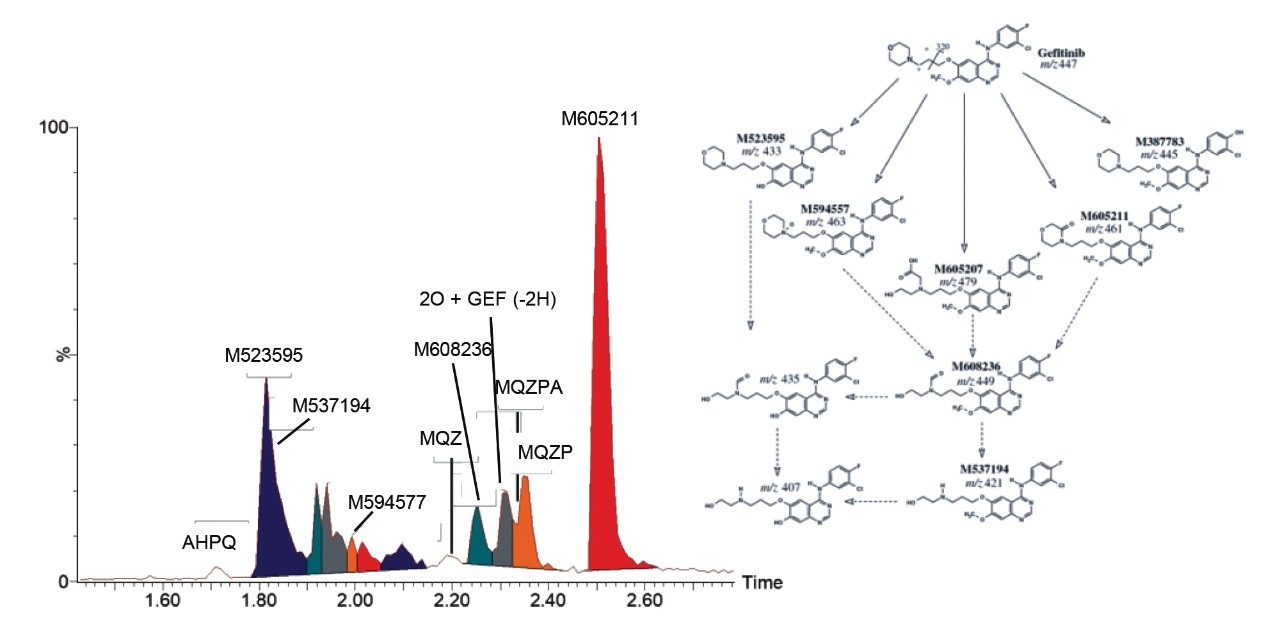
Gefitinib is an orally active and selective inhibitor of the epidermal growth factor receptor (EGFR; HER1) tyrosine kinase, used for the treatment of non-small cell lung cancer and marketed as Iressa.2-4 Previous studies have shown that gefitinib undergoes extensive first pass metabolism to form various metabolites.2,3 These methodologies employed chromatographic analysis times ranging from 15 to 45 minutes to generate the necessary MS and MS-MS spectral quality needed for confident drug metabolite identification. This throughput is not compatible with modern drug discovery. To address the throughput challenge, we employed reversed-phase UPLC-IMS/MS using gradient elution with an overall analysis time of 5 minutes. Following metabolite identification, the CCS values generated by the ion mobility system were used in conjunction with a prediction algorithm to confirm the identity and region of metabolism.

Experimental

Gefitinib was dosed intravenously (IV) and orally (PO) to the mouse at 10 and 50 mg/Kg respectively. Blood samples were obtained via tail bleeding over a 24 hour time period. Samples were selected for analysis by pooling the 2-6 hour time points. Mouse plasma samples were prepared by protein precipitation with three times the volume of methanol containing 0.1% formic acid. The sample-methanol solution was vortex mixed and centrifuged at 25000 g for 5 mins. The resulting supernatant was diluted 10 µL to 500 µL with 490 µL of 50:50 methanol:water.

Method Conditions

LC Conditions:

LC system:

ACQUITY UPLC I-Class

Column:

2.1 x 100 mm BEH C18 1.7 mm

Column temp.:

60 °C

Sample temp.:

4 °C

Injection volume:

2 mL

Flow rate:

650 mL/min

Mobile phase A:

0.1% formic acid in water + 10 mM ammonium acetate

Mobile phase B:

0.1% formic acid in acetonitrile

Gradient:

Linear gradient from 5-50% B over 2.9 mins. followed by 1.5 min. flush with 95% B

MS Conditions

MS system:

SYNAPT XS High Resolution Mass Spectrometer

Analyzer mode:

Resolution

Ionization mode:

ESI+

Full scan MS:

50-1200 m/z

Scan time:

0.3 sec.

Acquisition mode:

HDMSE

Capillary voltage:

3.0 kV

Collision energy (LE):

4 eV

Collision energy ramp (HE):

20-40 eV

IM drift gas:

Nitrogen

IM wave height:

40 V

IM wave velocity:

650 m/s

Data management:

MS software:

MassLynx v4.2

Informatics:

UNIFI 1.9.4 Scientific Information System

Results and Discussion

As previously described, a 5-minute LC-HDMSE method was employed using the SYNAPT XS High Resolution Mass Spectrometer for the detection and further characterization of drug related metabolites in gefitinib-treated mouse plasma samples. The resulting data was transferred to the UNIFI Scientific Information System for data analysis using the Metabolite Identification Workflow. Gefitinib eluted with a retention time of 1.88 minutes and a total of ten drug related metabolites were identified that eluted between 1.72 and 2.51 minutes (Figure 1). Despite the short analysis time, the overall method provided sufficient specificity and selectivity to detect and resolve the majority of the metabolites.

Figure 1. Extracted ion chromatograms from the LC-MSE ion mobility enabled (HDMSE) analysis of gefitinib metabolites in mouse plasma, as described in the schematic by McKillop et al. (2005) and additional metabolites in Liu et al. (2015).

One of the greatest challenges in metabolite identification, especially in automated software-driven analysis, is obtaining “clean” MS spectra for interpretation. Ion mobility provides an extra, orthogonal dimension of separation to the LC-MS process, based on size, shape and charge of the molecular ion. This separation is recorded as an ion drift time (ms) and is used to create a filter in the data view that removes ions that chromatographically co-elute but do not share the same drift time. An example of this enhanced spectral quality is shown in Figure 2, for the analysis of the o-desmethyl metabolite (M523595). In this example, the ion mobility generated drift-aligned precursor and product ion MS spectra are significantly cleaner than the non-drift-aligned data, due to a significant number of non-drug related endogenous peaks in the non-IMS enabled MS and MS-MS data. The drug metabolite related 346.0738 m/z peak is not visible in the non-IMS data, whereas it is easily observed in the IMS drift aligned data. This improved spectral quality makes manual and software enabled metabolite identification simpler and hence faster.

Figure 2. Enhanced metabolite spectral quality for major metabolite M523595 using ion mobility drift-alignment as compared to the non-drift aligned spectrum.

Gefitinib has the molecular formula C22H24ClFN4O3, with a mono isotopic molecular mass of 446.1521 Da. The precursor ion showed a characteristic chlorine isotope pattern with the base peak m/z value of 447.1598 (mass error of 0.2 ppm) Two major product ions were observed at m/z = 320.0597 and 128.1078. This information, along with knowledge of common metabolic routes of functionalization and conjugation, was used to detect and identify the metabolites of gefitinib. The derived LC-MS data was transferred to the UNIFI Scientific Information System for analysis with the Metabolite Identification Workflow. A more complete explanation of software can be found at https://www.waters.com/webassets/cms/library/docs/720006106en.pdf. Briefly, the metabolites are identified based on their m/z of precursor and product ions and single -Cl isotopic distribution pattern. Gefitinib is metabolized by cytochrome p450 3A4, and the major routes of metabolism are oxidation of the morpholine ring and O-demethylation of the methoxy-substituent on the quinazoline nucleus.2 The O-desmethyl metabolite (M523595) was identified as the major metabolite, eluting at 1.76 minutes, with the carbonyl metabolite (M605211) being the next most abundant. The M605211 precursor ion m/z was determined to be 461.1388, with a mass error of <1 ppm and representative single -Cl isotope distribution pattern. Three main product ions were detected: 320.0588 m/z (C15H12ClFN3O2, error 0.9mDa), 142.861 m/z (C7H12NO2, error 0.1mDa) and 86.0595 m/z (C4H8NO, error 0.5mDA). Figure 3 illustrates the use of UNIFI software for the elucidation of the structure of M605211. The SYNAPT XS System was able to deliver high quality MS and MS/MS spectra with high mass accuracy, enabling confident metabolite identification.

Figure 3. Identification of gefitinib carbonyl metabolite M2 (M605211).

Ion mobility-enabled MS not only provides an extra dimension of separation but also enables the accurate measurement of the collision cross-section (CCS). CCS provides an additional identification point, like retention time and accurate mass, by which a compound can be characterized. Recent advances in CCS calculations and predictionshave allowed the accurate and rapid prediction of CCS values, which can be used to support structural identifications.5,6 To evaluate the application of CCS prediction to this study, CCS values for the gefitinib metabolites were calculated using a previously reported machine learning approach and compared to the measured values.6 The resulting data is displayed in Figure 5 and Table 1. As can be seen from these results, there is excellent correlation between the predicted and measured CCS values for gefitinib metabolites, with the mean absolute error (MAE) being 1.8%. Use of CCS prediction is an active area of investigation for support of structural elucidation in IM experiments.

Conclusion

The SYNAPT XS System is a high resolution, high sensitivity ion mobility-enabled mass spectrometer which, when combined with the UNIFI Scientific Information System using the Metabolite Identification Workflow, is ideally suited for rapid metabolite identification to support drug discovery. The use of ion mobility MS enables generation of cleaner MS and MS/MS spectra by exploiting the orthogonal separating powers of the IMS cell to resolve closely eluting metabolites and endogenous components or isomers, which facilitates more confident metabolite identification. Additionally, ion mobility enabled-HRMS allows for the determination of molecule specific collision cross-section data which, along with machine learning prediction software, can be used to confirm structural assignments of metabolites.

References

  1. Schadt S. et al. (2017) A Decade in the MIST: Learnings from Investigations of Drug Metabolites in Drug Development under the “Metabolites in Safety Testing” Regulatory Guidance. Drug Metab Dispos. 46, 865-878.
  2. McKillop D. et al. (2005) Metabolic disposition of gefitinib, an epidermal growth factor receptor tyrosine kinase inhibitor, in rat, dog and man. Xenobiotica 4(4), 914-934.
  3. Liu X. et al. (2015) Metabolomics reveals the formation of aldehydes and iminium in gefitinib metabolism. Biochem. Pharmacol. 97(1), 111-121.
  4. Zhang Q. et al. (2017) Effect of weekly or daily dosing regimen of Gefitinib in mouse models of lung cancer. Oncotarget. 8(42), 72447-72456.
  5. Zhou, Z. et al. (2016) Large-scale prediction of collision cross-section values for metabolites in ion mobility mass spectrometry. Anal. Chem. 88, 11084-11091.
  6. Nye L.C. et al. (2019) A comparison of collision cross section values obtained via travelling wave ion mobility-mass spectrometry and ultra high performance liquid chromatography-ion mobility-mass spectrometry: Application to the characterisation of metabolites in rat urine. J. Chrom. A. 1602, 386-396.

720006908, June 2020

Haut de la page Haut de la page