For research use only. Not for use in diagnostic procedures.
MALDI Imaging High Definition MSE (HDMSE) enables detection and identification of lipid species in a single analytical run. This unique methodology provides MS and MS/MS information from detectable ion species within the same experiment, without the need for precursor selection.
Recent advances in mass spectrometry (MS) have enabled the simultaneous analysis of a wide range of chemically similar lipids as well as structurally diverse lipid classes, contributing to an increased interest in lipidomics research. However, the spatial localization of lipids within tissue micro-structures is often lost during the process of lipid extraction, as applied in more traditional analysis approaches, resulting in the loss of valuable information pertaining to origin and biological function.
Mass spectrometry imaging (MSI) visualizes the location of lipid species in entire tissue sections. The first step is typically an untargeted MS analysis experiment that enables large numbers of species to be detected and localized simultaneously. Structural identification of the detected lipid species is the next step; however, this can be time-consuming since it consists of manually conducting a series of MS/MS acquisitions on selected components, using either single or consecutive tissue sections.
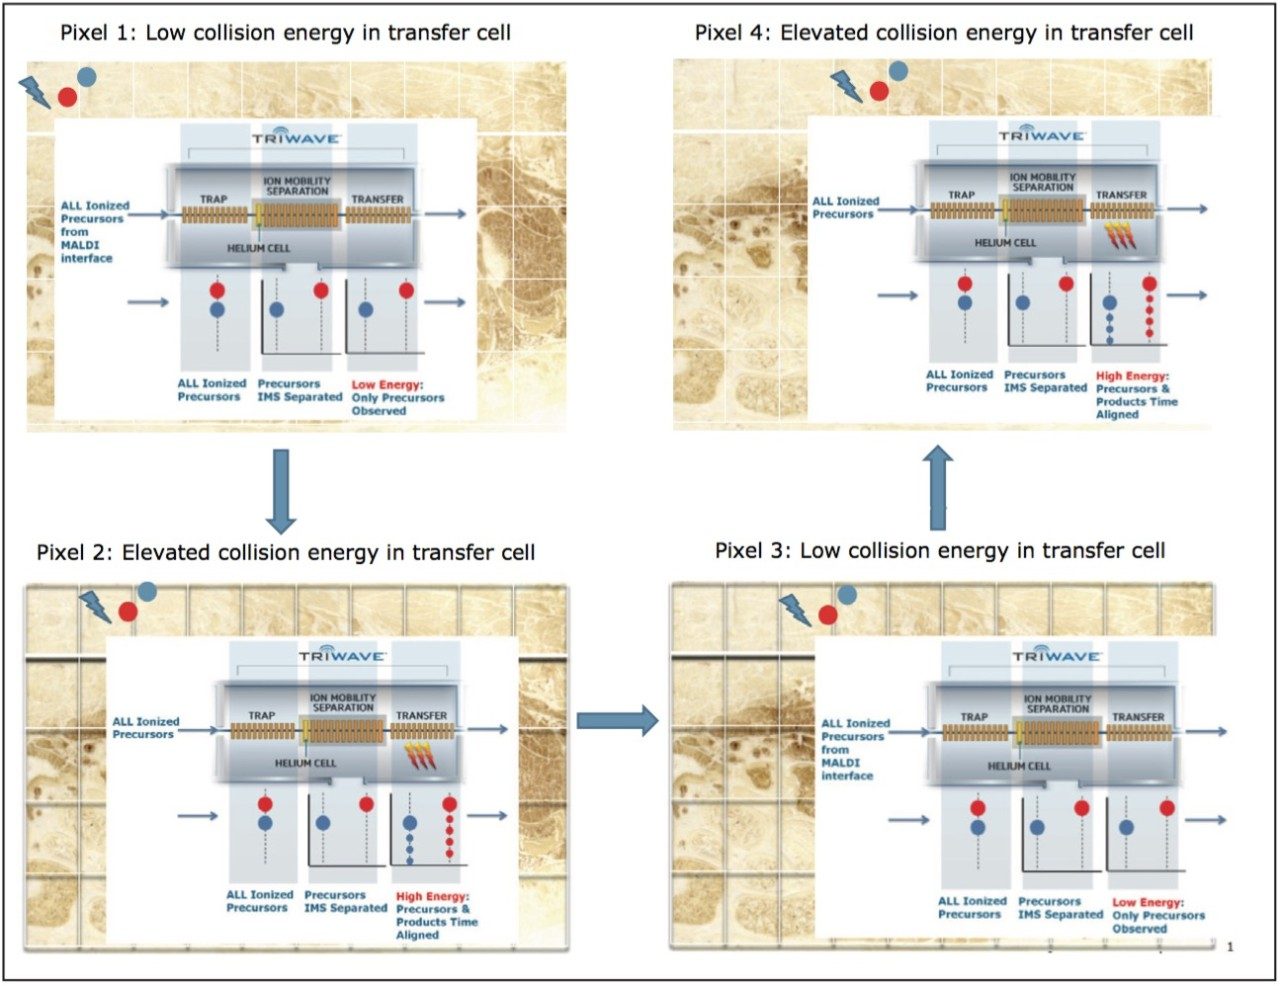
A data independent MALDI imaging acquisition method called MALDI Imaging High Definition MSE (HDMSE), presented here, enables detection and identification of lipid species in a single analytical run. This unique methodology provides MS and MS/MS information from detectable ion species within the same experiment, without the need for precursor selection. Post acquisition, precursors and fragments are correlated on the basis of ion mobility (drift time) and spatial distribution to provide highly informative results for every detectable molecular component.
A 30-μm-thick rat whole-body sagittal tissue section was mounted on invisible mending tape that was cut using a scalpel to fit a Waters MALDI target with double sided tape. A solution of α-cyano-4-hydroxycinnamic acid (CHCA) matrix at 5 mg/mL was applied evenly to the sample in several coats using a SunCollect (SunChrom GmbH) nebulising spray device.
Mass Spectrometer: |
MALDI SYNAPT G2 HDMS |
Mode: |
Positive |
Mass range: |
100 to 1000 Da |
Transfer collision voltage: |
Low energy function: 4 eV Elevated energy function: 50 eV |
Laser: |
1 KHz solid state Nd: YAG laser (λ = 355 nm) |
Spatial resolution: |
200 μm (lateral) |
The raw data obtained were subsequently processed using High Definition Imaging (HDI) MALDI Software, whereby the low energy and elevated functions were processed and combined in a .txt output file. Only a limited drift time range, specific for lipids, from 100 to 160 mobility bins was considered.
Identification based on mass accuracy and fragmentation information was carried out using SimLipid 3 (PremierBioSoft, US) Software and LipidMaps MS tools (http://www.lipidmaps.org/tools/index.html).
Ions are generated in the source of the mass spectrometer and passed through the quadrupole (with no precursor selection) in the Triwave region, as shown in Figure 1. The ions are rapidly separated (in 20 to 50 msec) based on their size, shape, and charge (i.e. ion mobility, or IM) to better enable detection of isobaric and isomeric components.1 Following IM separation, ions pass through the TRANSFER T-Wave collision cell, where, in the first low energy function precursor ion spectra are recorded (intact lipid information), and in the second elevated energy function energy product ion spectra are recorded (lipid fragment information). The two functions can be acquired on the same pixel (to maximize spatial resolution) or consecutive pixels (to maximize sensitivity). The low energy precursors can be associated with the relevant elevated energy fragments since they share similar drift time values from the IM separation, as shown in Figure 1. The datasets are subsequently processed, using the High Definition Imaging (HDI) MALDI Software, where the data from both the low and elevated energy functions are peak detected, aligned, and a two-step correlation based on drift time and position between precursor and fragment ions is performed.
The user interface of HDI Software and the display of the processed data are shown in Figure 2. In this view, the peak lists, mass spectra, and ion images from the two functions are integrated in an interactive manner. A two-dimensional plot of drift time versus m/z plot is also included, to enhance visualization and peak selection (blue dots represent the low energy information and green dots the elevated peak detected ions).
The main, distinct advantage of MALDI imaging HDMSE is its ability to generate precursor ion and fragment ion information for every detectable molecular ion. Initial correlation is achieved on drift time similarity, which is realized within the IM cell. However, one particular challenge with lipid samples is the high number of species within a limited mass and drift range. Fragments that do not belong to the correct precursor can sometimes be assigned incorrectly, but this situation is strongly improved using a second correlation step based on spatial distribution similarity of fragment ions and their precursors.
The workflow of the two-step correlation process for fine association of fragment ions to their originating precursors is illustrated in Figure 3. For example, precursor lipid ion m/z 760.6 was selected in the top HDI window. In the m/z versus dt plot, the drift time associated fragment ions are displayed as orange dots. After accepting the drift time correlation results, 108 potential fragments were drift time associated to this particular lipid precursor ion, as displayed in the middle window. The next step was the spatial correlation. When a correlation factor from 0.3 to 1.0 was applied, the number of potential fragment ions was reduced to 39, as can be seen in the bottom window.
The results from the two-step correlation process were imported into SimLipid 3 for lipid identification. Here, parent m/z values were internally lockmass-corrected after identification of lipid m/z 798.5. In this instance, lipid m/z 760.5859 was identified as either PC (16:0/18:1) H+ or PC (18:1/16:0)H+ with fragment ions m/z 478.3301 (M-18:1-H2O) and 496.3404 (M-18:1). T he annotated MS/MS spectrum is shown in Figure 4.
Using the information from the two-step correlation and mass accuracy, over 20 lipid species were identified from the single MALDI imaging HDMSE experiment and are summarized in Table 1.
720004471, October 2012