This application note describes a method using the ACQUITY UPLC Aflatoxin Analysis Application Kit and the ACQUITY UPLC H-Class System to analyze aflatoxins in almonds, cornmeal, and a packaged cereal mix containing powdered milk. Using the ACQUITY UPLC H-Class System, with the highly sensitive, large-volume flow cell on the ACQUITY Fluorescence (FLR) Detector, aflatoxins can be detected at legislated levels.
Using the ACQUITY UPLC H-Class System, with the highly sensitive, large-volume flow cell on the ACQUITY Fluorescence (FLR) Detector, aflatoxins can be detected at the legislated levels.
Contamination of foodstuffs with mycotoxins is one of the most concerning problems in food and feed safety. Mycotoxins are produced by molds that can grow under certain environmental conditions before harvest, during transport and storage, and through processing procedures. Aflatoxins, produced by the genus Aspergillus, are one of the most widely occurring mycotoxins. The main aflatoxins are B1, B2, G1, and G2. M1 and M2 are metabolites that appear when dairy animals eat grain contaminated with B1 and B2 aflatoxins. Structures for these compounds are shown in Figure 1.
These compounds are toxic and can be carcinogenic to humans and animals. Due to this toxicity, government regulatory agencies impose strict limits1,2 on their content in foodstuffs. B1 and G1 are more potent than B2 and G23, and this difference is reflected in the legislated levels. The European Union (EU) recently reviewed their legislation regarding permitted levels of aflatoxins and the sampling requirements for testing. The original regulations are set out in EU Commission regulation 1881/20061, with additional requirements in the EU Commission Regulation 165/20102. These requirements amount to the most stringent mycotoxin regulations worldwide.
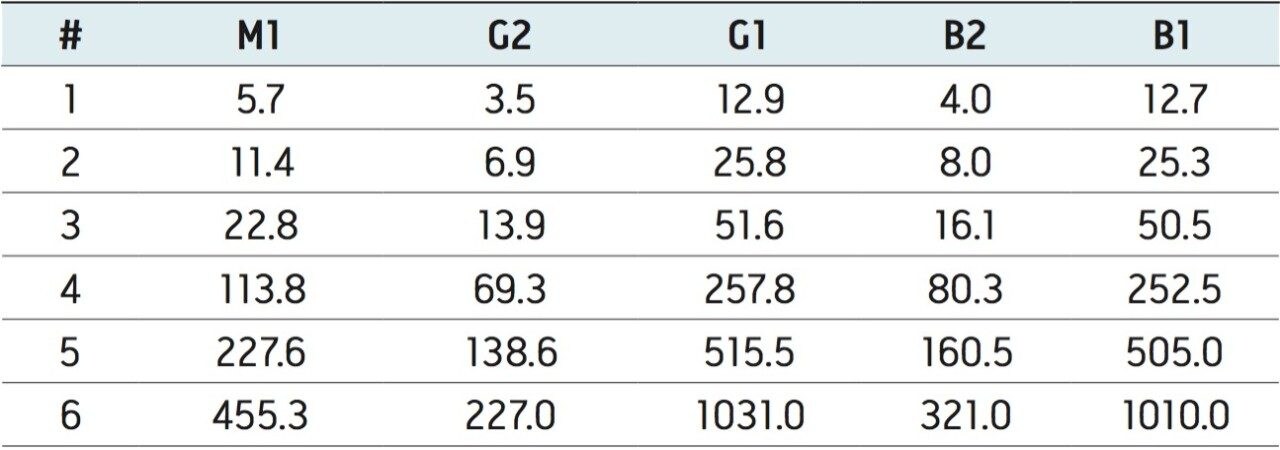
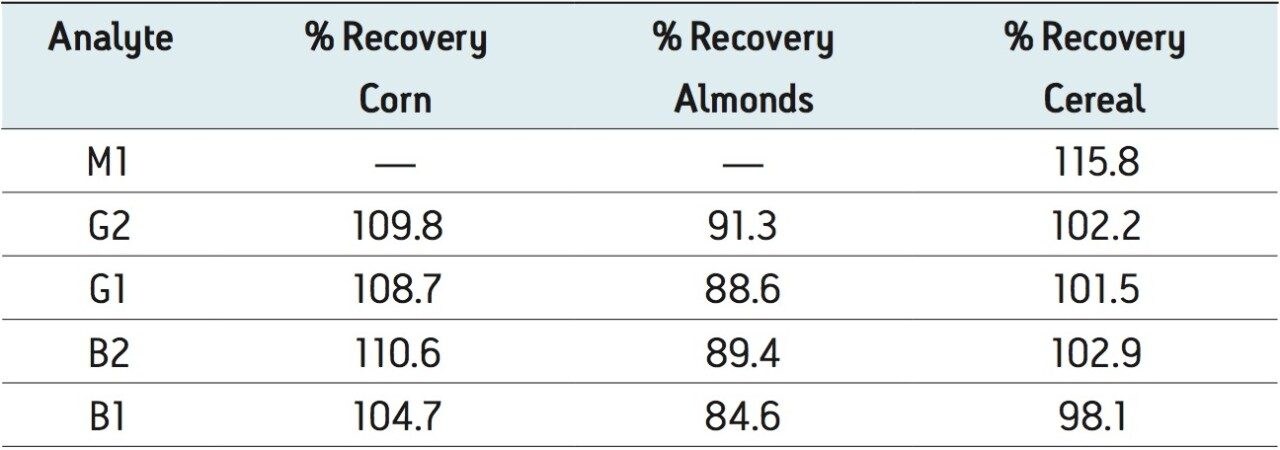
In the European legislation the maximum level of aflatoxin B1 allowed in cereals is 2.0 µg/kg, with a maximum level of the sum of B1, B2, G1, and G2 set at 4.0 µg/kg. For nuts, the levels vary between 2 and 12 µg/kg for B1 and 4 and 15 µg/kg for the sum of B1, B2, G1, and G2. Specifically in almonds, the levels are 8.0 µg/kg and 10.0 µg/kg, respectively. For M1 in raw milk the maximum level is 0.05 µg/kg. For infant formula and follow-on formula, the maximum permitted level of M1 is 0.025 µg/kg.
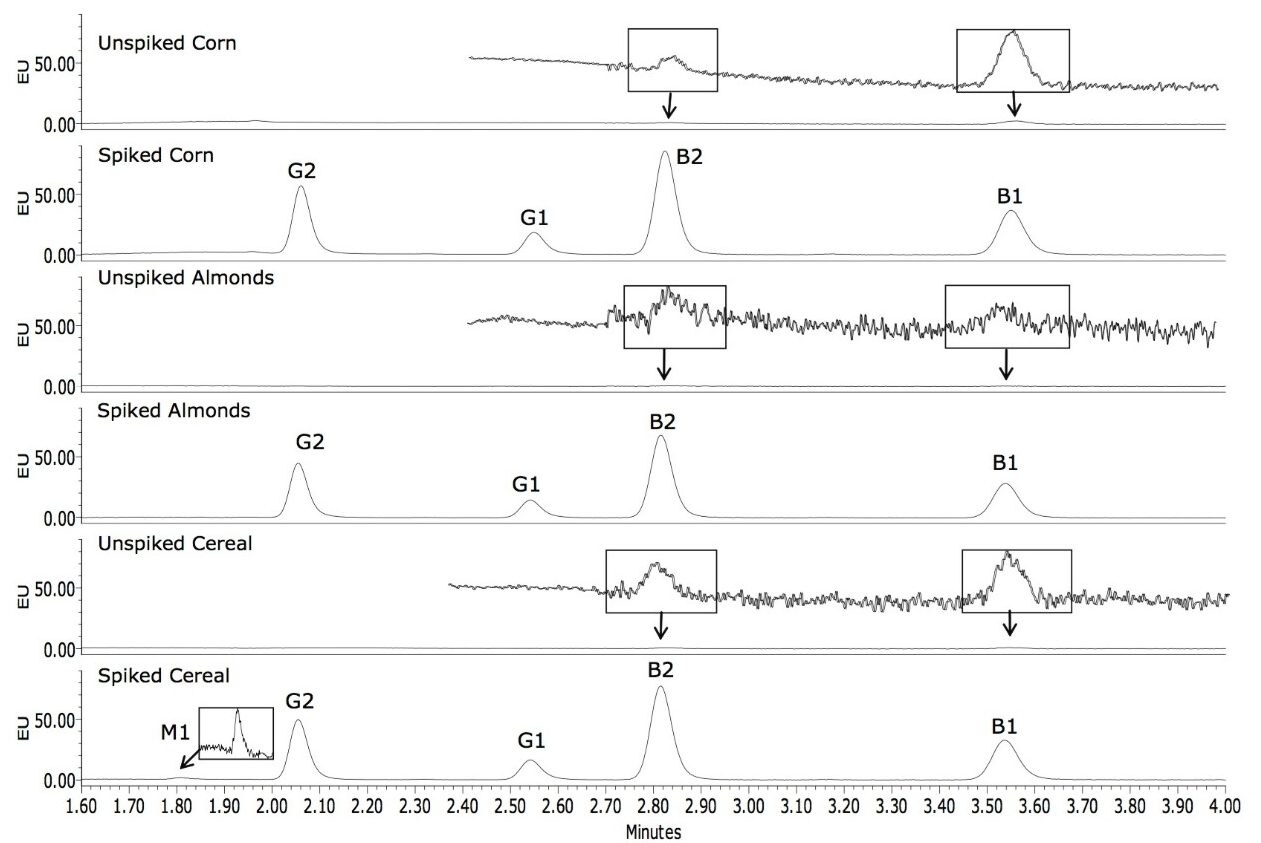
Many methods have been developed for the analysis of aflatoxins, including thin-layer chromatography (TLC), immunoaffinity chromatography, HPLC, enzyme-linked immunosorbent assay (ELISA), and LC/MS/MS. LC/MS/MS provides the ultimate in selectivity and sensitivity for quantitative analysis, but requires significant invest-ment for laboratories that do not already possess the required instrumentation or skill sets. The combination of selective immunoaffinity separations with highly sensitive fluorescence detection is an alternative technology for this application. However, since reverse phase eluents quench the fluorescence of aflatoxins B1 and G1, derivatization is common to enhance the response of these analytes.4,5
In this work, we used the Waters ACQUITY UPLC Aflatoxin Analysis Application Kit and the ACQUITY UPLC H-Class System to analyze aflatoxins in almonds, cornmeal, and a packaged cereal mix containing powdered milk.
The ACQUITY FLR Detector with the large volume flow cell removes the need for time-consuming and laborious derivatization steps often required for the detection of aflatoxins at the regulated levels. The simplicity of the ACQUITY UPLC H-Class System, capable of auto-blending up to four-solvents, delivers the ease-of-use and flexibility of HPLC with the performance of UPLC.
LC system: |
ACQUITY UPLC H-Class System |
Runtime: |
4.0 min |
Column: |
ACQUITY BEH C18, 1.7 μm, 2.1 x 100 mm at 30 °C |
Mobile phase A: |
water |
Mobile phase B: |
methanol |
Mobile phase C: |
acetonitrile |
Flow rate: |
0.4 mL/min |
Injection volume: |
20 μL (using optional 50 μL loop) |
Time (min) |
Flow rate (mL/min) |
%A |
%B |
%C |
---|---|---|---|---|
Initial |
0.4 |
64 |
18 |
18 |
(Isocratic)
Excitation: |
365 nm |
Emission: |
429 nm (M1, B2, B1) |
Emission: |
456 nm (G2, G1) |
Two stock solutions were purchased from Supelco; 46319-U and 46304-U. From these, intermediate stocks were prepared in methanol and diluted with 1% acetic acid (aq) to produce six standard mixes with concentrations, as listed in Table 1. These concentrations bracket the concentration of the final extract following the sample preparation procedure described below. From each standard, 20 µL was injected in triplicate.
Individual samples of whole corn kernels, shelled almonds, and non infant cereal containing powdered milk were divided into two 25 g portions. One portion was kept as a blank. The other was spiked with aflatoxin standards at the EU levels as described below. Both portions were then carried through the VICAM AflaTest cleanup procedure.
Each sample was spiked at 4 µg/kg total B and G (1.54 µg/kg B1). This was achieved by adding 384.6 µL of a 0.26 mg/L solution to the blender for the sample preparation. In addition, the cereal containing powdered milk was spiked at 0.05 µg/kg M1 by adding 125.0 µL of a 0.01mg/L solution of M1.
The resulting solution, assuming 100% recovery, had a calculated concentration of 1000 ng/L total aflatoxins B, G, and 12.5 ng/L M1 (spiked cereal). A total of 20 µL was injected for UPLC-FLR analysis.
The separation of the aflatoxins analyzed in this work was achieved in a run time of less than 4 min. Figure 2 shows a representative overlay of the six different concentrations of the standard mixes.
The response of B1 and G1 was less than B2 and G2 due to the quenching effect of the solvents on the fluorescence of these two compounds. However, the ACQUITY FLR Detector with the large volume flow cell was easily able to detect B1 and G1 at the required levels without derivatization.
Quantitation of the spiked samples was calculated against a calibration curve for each of the analytes. Figure 3 shows the calibration curves for each of the analytes. The coefficient of determination (R2) was >0.995 for all analytes.
The concentration ranges, shown in Table 1, were selected to bracket the concentration of the extracts from samples that were fortified at the legislated levels.
Figure 4 shows chromatograms of the unspiked and spiked corn, almonds, and cereal, respectively. Traces of B1 and B2 were found in the unspiked matrices, the largest amount being 0.025 µg/kg B1 in corn, well below the regulated limit of 2 µg/kg. Pertinent sections of the chromatograms have been rescaled to highlight this. These amounts were subtracted from the recovered amounts prior to the calculation of the percentage recovery. The percentage recovery for each of the analytes is shown in Table 2. All of the recoveries ranged between 84% and 116%. A magnified portion of the spiked cereal sample is included in an inset to Figure 4 to more clearly show the M1 peak that was detected.
Table 3 lists the retention time and area reproducibility for 3 injections of each of the different spiked matrices. The retention time repeatability for all injections of both standards in solvent and spiked samples is shown in Table 4. These data are from a total of 27 injections.
In this work, the ACQUITY UPLC H-Class System, coupled with a large volume flow cell, enabled the quantitative analysis of aflatoxins using fluorescence without derivatization. Eliminating the derivatization step reduces the additional post-column volume that can lead to band broadening, and thereby ensures that high signal-to-noise ratios are maintained. With fewer instrument modules there is less training, troubleshooting, and upkeep.
Using the AflaTest cleanup procedure, aflatoxins were extracted from three different matrices with excellent recoveries. The most stringent worldwide regulated limits for each of the aflatoxins was achieved in the matrices tested.
The ACQUITY UPLC H-Class System, used with the Aflatoxin Analysis Application Kit, provides an easy-to-use solution for the detection of aflatoxins. The ability to automatically blend up to four solvents removes the need for premixing of mobile phases, and provides added flexibility for method development. The short run time of less than 4 minutes increases throughput, compared with HPLC methods, thereby improving laboratory productivity.
We thank Marjorie Radlo, Nancy Zabe, and the staff of VICAM for their assistance with this study.
720003644, July 2010