In this application note, we present the use of a tandem quadrupole MS/MS instrument equipped with a novel collision cell that enables the collection of both MRM and full-scan MS/MS data for any targeted chromatographic peak. This is performed in such a way that more than 12 MRM points can still be collected across a 1.5-second-wide chromatographic peak, ensuring that the quality of quantification data is not compromised.
The Xevo TQ MS combined with the ACQUITY UPLC System enables rapid and high-quality collection of both quantitative multiple reaction monitoring (MRM) and qualitative full-scan MS/MS data without the need for long analysis times or repeat injections.
2008 U.S. FDA guidelines on Metabolites In Safety Testing (MIST)1 suggest that it is necessary to monitor steady state clinical trials for the presence of human drug metabolites. Furthermore, these guidelines recommend that all drug metabolites that produce greater than 5% of the exposure of the total drug-related compound must be identified and quantified.
This requires the drug metabolism scientist to investigate the late-stage clinical trial samples for the presence of metabolites produced in preclinical safety assessment studies. To achieve this would involve a high-sensitivity, targeted analysis to quantify the active compound (usually by MRM mass spectrometry), followed by a full-scan qualitative analysis of the samples to detect metabolites present. This is time consuming, requires extra sample processing, and duplicate analysis.
Tiller and Romanyshyn2 employed the use of linear ion trap technology with MRM monitoring of both parent and predicted metabolites to acquire quantitative data on the parent compound and obtain metabolite information.3 However, the relatively long cycle times associated with this approach, 1.5 seconds, are incompatible with the peak widths produced by modern fast UPLC-MS/MS.
In this application note, we present the use of a tandem quadrupole MS/MS instrument equipped with a novel collision cell that enables the collection of both MRM and full-scan MS/MS data for any targeted chromatographic peak. This is performed in such a way that more than 12 MRM points can still be collected across a 1.5-second-wide chromatographic peak, ensuring that the quality of quantification data is not compromised.
LC system: |
Waters ACQUITY UPLC System |
Column: |
ACQUITY UPLC BEH C18 Column 2.1 x 50 mm, 1.7 μm |
Column temp.: |
45 °C |
Flow rate: |
600 μL/min |
Mobile phase A: |
20 mM Ammonium Acetate, pH 5.0 |
Mobile phase B: |
Acetonitrile/Acetone (9:1) |
Gradient: |
5 to 95% B/5 min |
MS System: |
Waters Xevo TQ MS |
Ionization mode: |
ESI positive |
Capillary voltage: |
3200 V |
Cone voltage: |
35 V |
Desolvation temp: |
450 °C |
Desolvation gas: |
800 L/Hr |
Source temp: |
120 °C |
TargetLynx Application for MassLynx Software
The Xevo TQ MS System was set up in the product ion confirmation (PIC) acquisition mode. In this mode, the instrument collects MRM data for the quantification of targeted compounds. At the same time the MRM data is used as a very specific trigger that enables the automatic acquisition of an enhanced product ion spectrum when a target compound elutes from the column.
In this mode, the collection of an enhanced product ion spectrum is actually triggered 4 data points after the apex of the chromatographic peak; at this point the instrument switches from MRM to MS/MS mode and collects a full-scan MS/MS spectrum of the MRM precursor ion. The MS/MS spectrum is collected over several scans with a user-defined scan time, typically 100 to 200 ms. Following the collection of the spectral data, the instrument returns to MRM mode to accurately define the tail of the peak. This mechanism of post-peak apex triggering ensures that the peak of interest can still be accurately quantified.
A series of MRM transitions were identified for each target metabolite using known parent compound fragment ion information. PIC collection was enabled for each of the metabolite MRM channels to enable automated acquisition of MS/MS spectra for each of the targeted metabolites.
This approach for the quantification and confirmation of a drug and associated metabolites was evaluated using rat plasma samples spiked with propranolol along with metabolites of propranolol obtained from a microsomal incubation (at 100, 20, 10, 1 and 0.1μMol) and propranolol at 10 pg/mL to 50 ng/mL. The MS/MS spectrum obtained for propranolol is shown in Figure 1. The molecular ion (m/z 260) gave rise to three major fragment ions, m/z 116, 157, and 183.
As previously shown by Baughman, et al,2 metabolic addition is likely to preferentially occur on the alkyl chain of the both the 157 ion and, therefore, the 183 ion may not be present in the fragment pattern of a metabolite molecule. For this reason the instrument was configured to collect the MRM transitions for the metabolites using the 116 ion as the common product ion. The MRM transitions employed were 452 > 116 for the hydroxyglucuronide metabolite, 436 > 116 for the glucuronide metabolite, and 276 > 116 for the hydroxy metabolite. The combined UPLC-MS/MS MRM traces for hydroxy, glucuronide, and hydroxyglucuronide are shown in Figure 2.
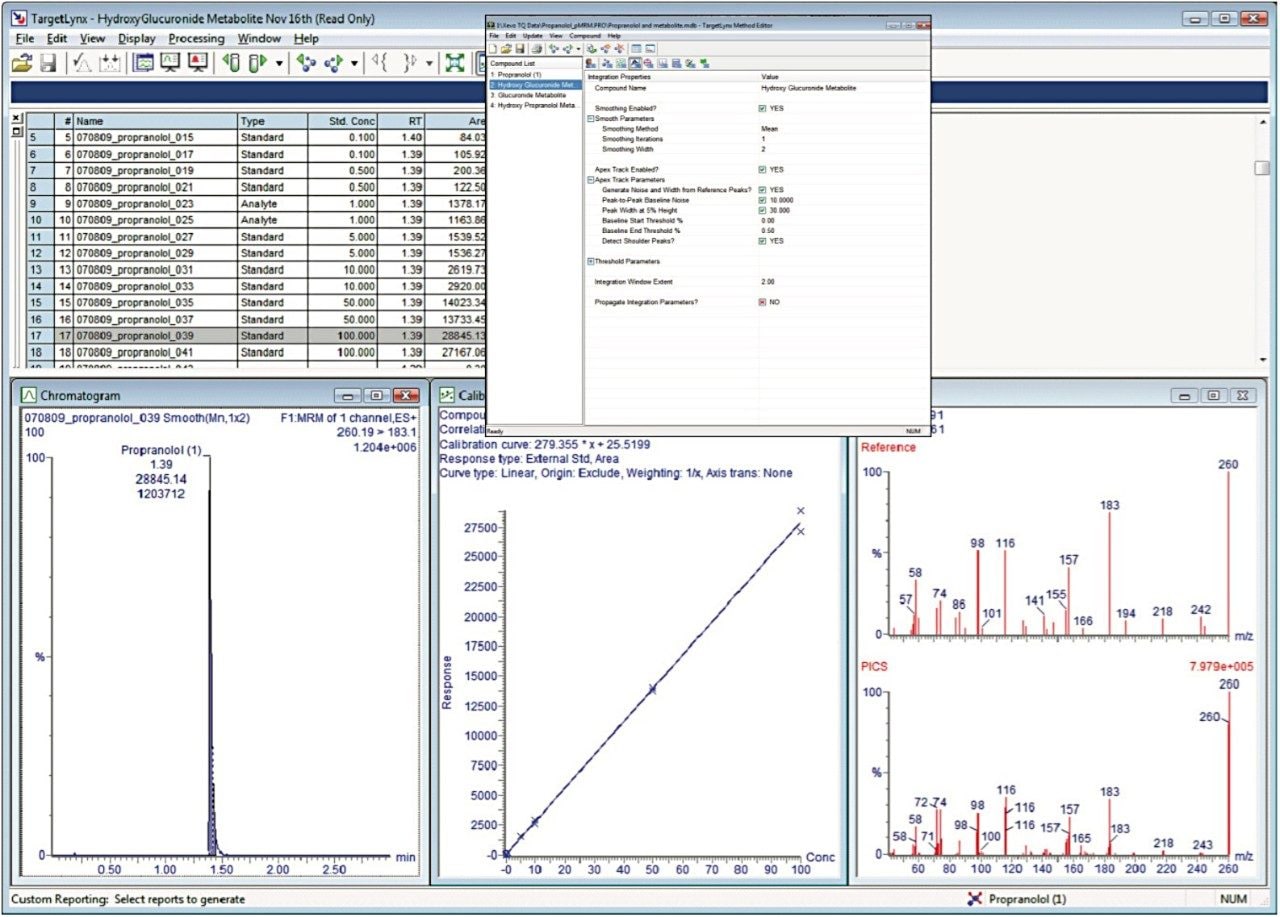
From the data it is possible to detect two hydroxy metabolites of propranolol (m/z 276), two glucuronide metabolites of propranolol (m/z 436), and three hydroxyglucuronide metabolites of propranolol (m/z 452). This data is in agreement with that of Wilson, et al,3 who detected the same number of hydroxy, glucuronide, and hydroxyglucuronide metabolites. The MRM peak area data showed a linear response relative to concentration over the range of 10 pg/mL to 50 ng/mL (without the use of an internal standard, data not shown).
The extracted ion chromatograms and mass spectra produced are displayed in Figure 3. The LC-MS/MS system detected three hydroxyglucuronide metabolites, two glucuronide metabolites, and one hydroxy metabolite of propranolol eluting with retention times of 0.76, 0.86, and 1.13 minutes, respectively. Representative spectra of the hydroxyglucuronide (RT 0.86 min) are shown in Figure 3A. The spectra show the major ions m/z 276, 199, and 116. These correspond to the hydroxylated phase I metabolite and the fragment ion associated with this metabolite. The m/z 116 ion is a common fragment ion from the parent molecule. The mass spectrum displayed in Figure 3B is from the glucuronide metabolite eluting with a retention time of 1.33 minutes.
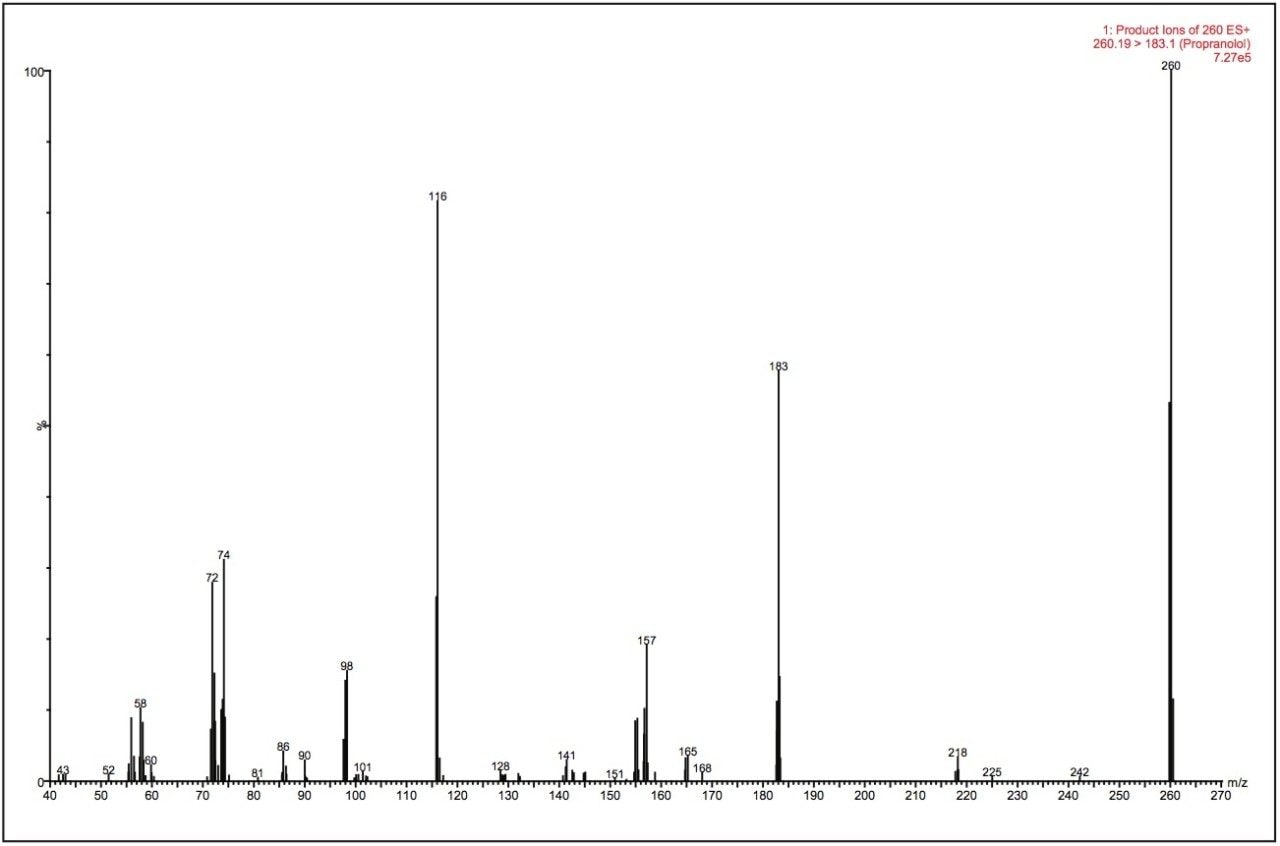
In the spectra shown in Figure 3, we can clearly see the m/z 260 ion produced from the cleavage of the sugar moiety from the propranolol analyte. The m/z 183 and 116 ions come from the fragmentation of the propranolol molecule itself. The data displayed in Figure 3C show that there are two peaks detected. A careful examination of the PIC spectra showed that the peak with a retention time of 1.13 minutes is actually from the thermal degradation of one of the hydroxylated glucuronide metabolites in the MS ion source and not a second hydroxylated metabolite. The PIC MS/MS spectra of the second, smaller peak at 1.24 minutes gave rise to peaks with m/z values of 116, 161, 198, and 233. The 116 ion is common to all metabolites. The 161 ion comes from the oxidation of the 145 ion, and the 198 ion comes from the addition of 16 to the 182 ion.
From this data we can clearly see that it is possible to obtain high-quality spectra of drug metabolites in a crude plasma sample preparation, even at the 1 μMol level, without the need to resort to unnecessarily long chromatographic run times.
The mass spectra produced from the PIC acquisition can be automatically reviewed and compared in the TargetLynx Application Manager browser. A representative PIC MS/MS spectra obtained from an authentic standard is uploaded into the processing method for the particular compound (metabolite) within TargetLynx. When the acquired data is processed, any PIC produced during the acquisition is compared to the reference spectrum within the processing method. Forward-fit and reverse-fit scores are automatically applied to the data to enable the simple assessment of spectral match.
A high forward-fit result indicates that most major peaks seen in the reference spectrum are also present in the spectrum collected. A high reverse-fit result indicates that there are few extra peaks in the collected spectrum that are not seen in the reference spectrum, indicating the purity of the spectrum. Figure 4 shows the spectrum obtained for the hydroxyglucuronide metabolite of propranolol identified and confirmed using TargetLynx in the 10 μMol incubation.
The TargetLynx Application Manager will simultaneously process multiple analytes, allowing the quantification of the target analyte as well as the drug-related metabolites at the same time, as shown in Figure 5. The inset box shows the method editor with all of the metabolites included in the processing method. The data produced for the analysis of the target compound, propranolol, was not affected by the acquisition of metabolite MRMs, PIC metabolite spectral data, or target analyte spectral PIC data. The data displayed in Figure 5 shows the acquisition sample queue, representative chromatogram, calibration line, and PIC spectrum of the target analyte.
Recent regulatory guidelines and recommendations place a greater emphasis on the detection and confirmation of metabolites in clinical trial studies. This could result in an increase in the number of analytical runs required to support these studies. The Xevo TQ MS is equipped with a novel collision cell design that allows for the rapid collection of MRM and full-scan data without the need for long analysis times and wide chromatographic peaks.
720003350, February 2010