• Note d'application

Probing Conformational Changes of Cytochrome c Induced by Acidification Using SYNAPT High Definition Mass Spectrometry

Probing Conformational Changes of Cytochrome c Induced by Acidification Using SYNAPT High Definition Mass Spectrometry

  • Weibin Chen
  • John C. Gebler
  • Waters Corporation

Abstract

This application note presents a study that uses a novel ion mobility mass spectrometer, the Waters SYNAPT High Definition Mass Spectrometry (HDMS) System, to probe the conformational structures of a model protein, cytochrome c. 

Introduction

The function of protein-based drugs strongly depends on three-dimensional structures. Conformational changes such as protein denaturation generally result in the loss of drug potency and the alternation of the pharmacological properties of the product. Thus, physicochemical characterizations of the higher-order structures of protein drugs are very important to drug development. Methods that allow fast determination of protein conformations or conformation changes in drug formulations for protein therapeutics are of high value.

Conventional NMR and X-ray methods can elucidate protein geometries in detail but are slow and generally require large quantities of pure protein. These methods are unsuitable to directly analyze real biological matrixes (e.g., drug formulation) that often contain many additives in addition to the drug protein itself.

The conformation of proteins can also be analyzed by optical spectroscopy, such as UV spectroscopy, or circular dichroism. However, these methods only provide information about a particular structural or functional feature of a protein and are generally not sensitive enough to detect the subtle conformational changes caused by small alterations in the protein structure. The need to rapidly identify and quantify a mis-folded protein from a real biological matrix is a particular challenge.

Electrospray ionization mass spectrometry (ESI-MS) has been widely adopted for the study of proteins. Coupled with a time-of- flight (TOF) analyzer, ESI-MS not only enables accurate mass measurement of intact proteins, but also provides useful information on the number of charges and the charge-state distributions of protein ions. However, MS methods are generally insensitive to the three-dimensional structure of proteins and protein complexes.

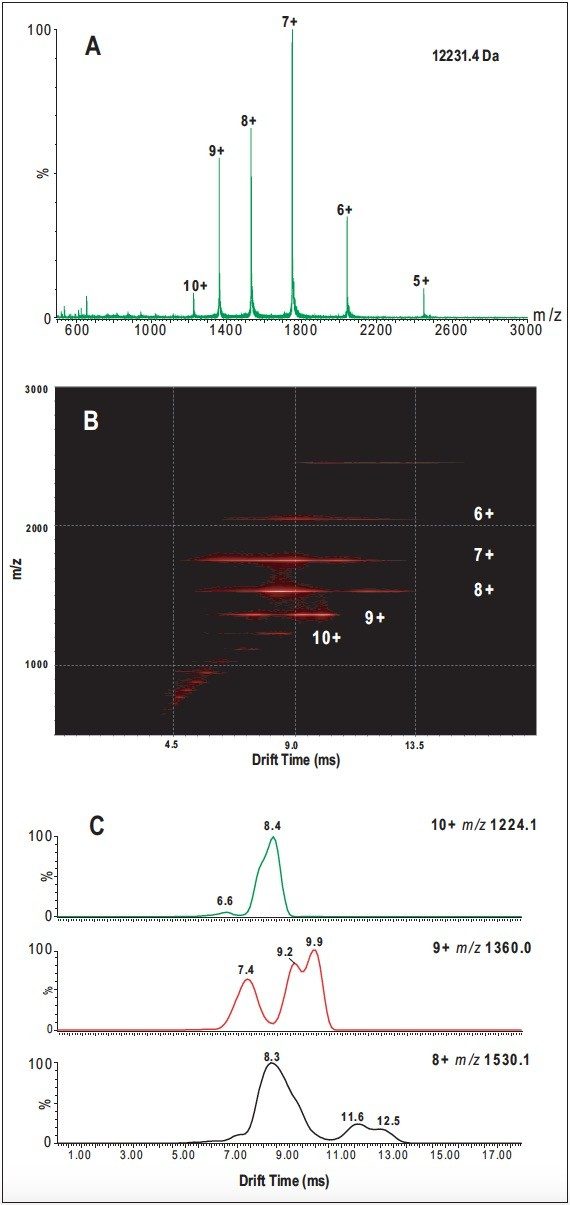
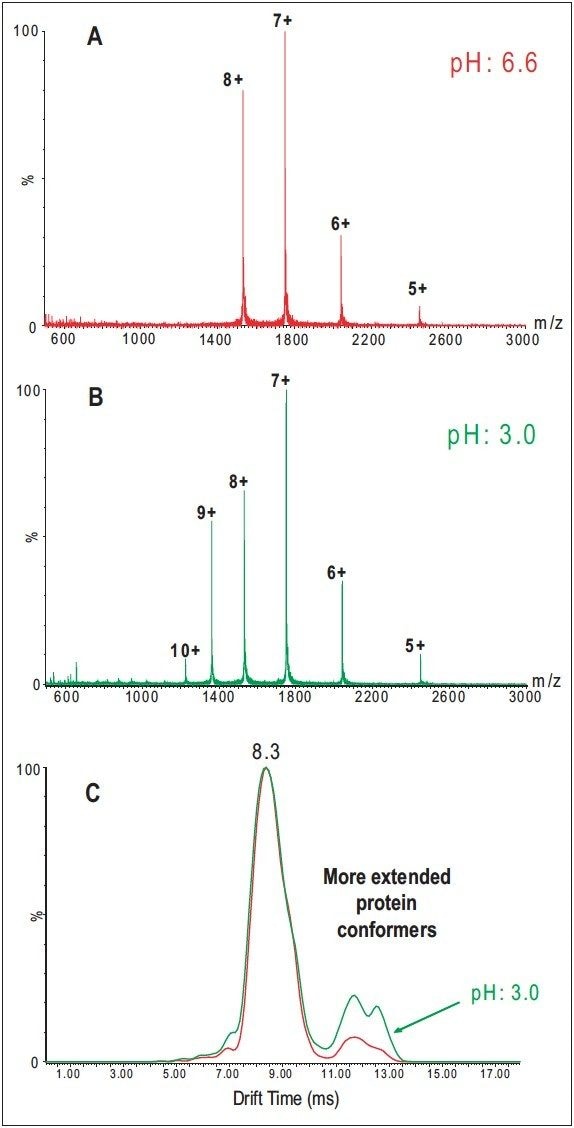
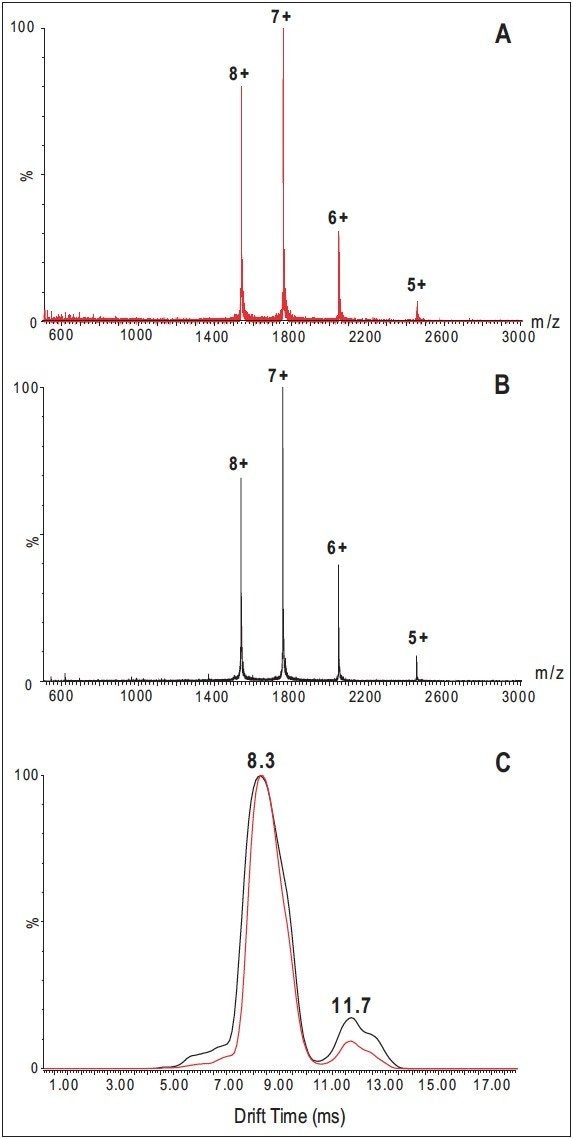
Ion mobility spectrometry (IMS) separates gas-phase ions with different collision cross-areas and/or charge states. When subjected to IMS separation, a tightly-folded protein conformer with a smaller cross section would travel faster (higher mobility) in an IMS cell, and hence is separated from a more extended, less-folded conformer of the same protein. Similarly, protein ions arising from the same protein conformer but with different charge states may also be separated, with the more highly charged species having a shorter mobility (drift) time. Thus, a combination of IMS and ESI-MS offers great potential to resolve and identify protein conformations in the gas phase that cannot be assessed by MS alone.

Here we present a study that uses a novel ion mobility mass spectrometer, the Waters SYNAPT High Definition Mass Spectrometry (HDMS) System, to probe the conformational structures of a model protein, cytochrome c. Results demonstrate that the instrument is a powerful tool for resolving the population of coexisting conformational states of cytochrome c and for revealing the conformational changes induced by the addition of acid or organic solvent, thus providing direct evidence that the protein is denatured.

Experimental

Cytochrome c (bovine heart) was purchased from Sigma. The protein was prepared at a concentration of 2.0 pmol/μL, either in 2.5 mM ammonium acetate (pH 6.6 or 3.0) or in 50:50 MeOH/5.0 mM ammonium acetate (pH 6.6). Samples were introduced to MS directly by infusion using a syringe pump (Harvard Apparatus) at a flow rate of 10 μL/min. MS conditions used for the analysis are listed below.

MS Conditions

MS system:

Waters SYNAPT HDMS System

Ionization mode:

ESI Positive

Capillary voltage:

2.8 kV

Cone voltage:

40 V

Desolvation temp.:

50 °C

Desolvation gas:

250 L/hr

Source temp.:

50 °C

Acquisition range:

500 to 3000 m/z

Trap collision energies:

6 V

IMS gas:

N2 gas

IMS gas pressure:

0.7 mbar

Pulse height:

Variable, 9 to 12 v

Results and Discussion

An ESI-TOF mass spectrum of cytochrome c (Figure 1A) was obtained by infusion of an acidic solution (pH 3.0). The mass spectrum exhibits six major peaks and several minor low-intensity peaks, each one corresponding to a different charge (protonation) state of cytochrome c. The highest charge state is 7+. The occurrence of more than one charge-state distribution implies the presence of a mixture of folded and less-folded protein conformers or conformational groups as initially suggested in the literature.1 This implication is confirmed when these ion species are subjected to analysis by SYNAPT HDMS. 

Figure 1B shows a two-dimensional plot of m/z vs. drift time (DriftScope Software), which displays ion species separations for each charge state of cytochrome c. Because ion species with the same charge state migrate at different times through the IMS cell, the data provide direct evidence that these ions have different collision cross sections (conformations), thus demonstrating that multiple, co-populated conformers of cytochrome c exist among all the ions generated. The number of distinct species associated with each charge state can be readily visualized with DriftScope. 

The ability of the SYNAPT HDMS to differentiate protein conformers is further illustrated in Figure 1C, which shows IMS separations of compact and less-folded conformers at three different charge states (8+, 9+, and 10+). 

A. Summed ESI-TOF-MS mass spectrum of cytochrome c. B. DriftScope. C. Ion mobility drift time vs. intensity plots.
Figure 1. A. Summed ESI-TOF-MS mass spectrum of cytochrome c in 2.5 mM aqueous ammonium acetate solution (pH 3.0) acquired using the SYNAPT HDMS System incorporating the enabling Triwave Technology. B. DriftScope shows drift time (x axis) vs. m/z (y axis) for the analysis of cytochrome c in 2.5 mM ammonium acetate at pH 3.0. C. Ion mobility drift time vs. intensity plots for the ions with m/z of 1224.1 (10+ ions; upper), 1360.0 (9+; middle) and 1530.1 (8+; lower) detected during the analysis of cytochrome c in 2.5 mM aqueous ammonium acetate solution at pH 3.0.

The 8+ ions show three distinct signals with drift times of 8.3, 11.6, and 12.5 ms; the 9+ ions show three signals with drift times of 7.4, 9.2, and 9.9 ms; and the 10+ ions show a predominant signal with a drift time of 8.4 ms together with a signal of low intensity at 6.6 ms.

In each case, the signal with the shortest drift time (i.e., higher mobility) can be attributed to a more compact conformation, compared with the signals detected at longer drift time (i.e., lower mobility), which can be assigned to a less-folded, more extended conformation. Thus the 8+ ion species exhibit a higher percentage of the folded conformation compared with the less-folded species. In comparison, the 9+ and 10+ ion species predominately have the less-folded species. 

Charge-state distributions of proteins from ESI processes depend on the pH of the solution. For a cytochrome c solution with a nearly neutral pH (6.6), the distribution peaks around the 7+ charge state (Figure 2A). When an acid is added, the distribution shifts to higher charge states (Figure 2B). The change in the charge-state distribution is interpreted as reflecting a change in the high-order structure in the solution phase.1 Cytochrome c is denatured in acidic solutions, and the appearance of the higher charge states is believed to be caused by more basic sites available for protonation from the unfolding structure. 

To test whether the conformational information obtained from SYNAPT HDMS can be used to correlate with the high-order structure changes of protein in solution, two cytochrome c solutions from a neutral (pH 6.6) or an acidic solution were analyzed underidentical experimental conditions. 

Figure 2C shows drift-time distributions recorded for the 8+ charge state of bovine cytochrome c from the two solutions. Although the 8+ charge state from both solutions displays a similar pattern in the drift-time distribution, the percentage of ion species with more extended conformational forms is clearly higher from the acidic solution than that from the neutral solution, implying that the acidic cytochrome c solution contains more unfolded species. This observation closely correlates with the fact that cytochrome c undergoes conformational changes (denaturation) in an acidic solution.2

Mass spectra and drift-time distributions.
Figure 2. Mass spectra and drift-time distributions for the 8+ charge states of cytochrome c, measured at two different pH levels (6.6 and 3.0). A. Summed ESI-IMS-MS spectrum of 2.0 pmol/μL of bovine cytochrome c in 2.5 mM ammonium acetate aqueous solution (pH 6.6). B. Summed ESI-IMS-TOF-MS spectrum of 2.0 pmol/μL of bovine cytochrome c in 2.5 mM ammonium acetate aqueous solution (pH 3.0). C. Comparison of the drift-time distribution of the 8+ charge states of bovine cytochrome c from the two aqueous solutions with different pHs (6.6 vs. 3.0), showing the correlation between the gas-phase ion conformations and solution denaturing changes.

The role of the SYNAPT HDMS System in probing high-order structure changes of proteins is additionally demonstrated in the analysis of cytochrome c solution containing 50% methanol, which is a relatively mild denaturant. 

The protein is completely denatured at methanol concentrations greater than 40% (in the absence of an acid). However, unlike acid denaturation at low ionic strength, which yields extended unfolded states, alcohol denaturation leads to a denatured form with increased helical content.

Mass spectra recorded for cytochrome c in a 1:1 solution of 5.0 mM ammonium acetate (pH 6.6) and methanol show essentially the same charge state distribution as recorded for a pure aqueous solution (2.5 mM ammonium acetate, pH 6.6), which suggests cytochrome c takes folded conformations (Figure 3A and 3B). 

However, the drift-time distribution recorded for the 8+ charge state from the 1:1 methanol/5.0 mM ammonium acetate solution (Figure 3C) clearly shows an increase in the more-extended, less-folded conformational forms compared to the drift-time distribution of the same charge state with the aqueous solution. This peak increase presumably results from a solution conformation with increased helical content.

Mass spectra and drift time distributions.
Figure 3. Mass spectra and drift time distributions for the 8+ charge states of bovine cytochrome c, measured at two different solutions (aqueous and 50% MeOH). A. Summed ESI-IMS-TOF-MS spectrum of 2.0 pmol/μL of bovine cytochrome c in 2.5 mM ammonium acetate aqueous solution (pH 6.6). B. Summed ESI-IMS-MS spectrum of 2.0 pmol/μL of bovine cytochrome c in 50% MeOH/50% 5.0 mM ammonium acetate aqueous solution (pH 6.6). C. Comparison of the 8+ charge states of bovine cytochrome c from the two solutions, showing the correlation between the gas-phase ion conformations and solution denaturing changes.

Conclusion

When applied to an analysis of a well-studied model system, cytochrome c, the SYNAPT HDMS System has demonstrated that it can be used to directly monitor and separate gas-phase ion conformers based on their cross sectional areas. These results indicate SYNAPT HDMS is a potentially powerful tool to correlate conformation changes of proteins under different solution conditions, and can be used to quickly probe the conformations or conformational changes of protein therapeutics in drug formulations.

References

  1. Chowdhury S, Katta V, Chait BJ. Am. Chem. Soc. 1990; 112: 9012–9013.
  2. Konermann L, Douglas DJ. Acid-Induced Unfolding of Cytochrome c at Different Methanol Concentrations: Electrospray Ionization Mass Spectrometry Specifically Monitors Changes in the Tertiary Structure. Biochemistry. 1997; 36 (40): 12296–302.
  3. Hudgins R, Woenckhaus J, Jarrold MF. Int. J. Mass Spectrum. Ion Processes 1992; 117:497–507.

720002636, May 2008

Haut de la page Haut de la page